Jordan Digital Biomarkers Market (2026-2032) Outlook | Share, Trends, Forecast, Value, Companies, Revenue, Size, Analysis, Industry, Growth
Market Forecast By Type (Wellness, Disease, Drugs), By Collection System Type (Wearables, Biosensors, Mobile Apps, Devices and Platforms, Desktop Based Software), By End-users (Pharmaceutical, Life Sciences, Medical Devices, App Vendors, Clinical Research Organizations), By Technology (Cloud Computing, Artificial Intelligence and Machine Learning, Augmented Reality, Blockchain) And Competitive Landscape
| Product Code: ETC072125 | Publication Date: Jun 2021 | Updated Date: Jun 2026 | Product Type: Report | |
| Publisher: 6Wresearch | Author: Dhaval Chaurasia | No. of Pages: 70 | No. of Figures: 35 | No. of Tables: 5 |
Indonesia Electric Vehicle Charging Infrastructure Market Size, Share & Growth Rate
The Indonesia Electric Vehicle Charging Infrastructure Market was estimated at USD 200 Million in 2025 and is projected to reach USD 265 Million by 2032, growing at a CAGR of 4.1% from 2026 to 2032. This growth trajectory is primarily propelled by Indonesia's national commitment to reducing carbon emissions and enhancing sustainable urban mobility. Furthermore, increasing consumer awareness and the government’s incentives for electric vehicles (EVs) are substantially driving the demand for a robust charging network across the archipelago.
Jordan Digital Biomarkers Market Growth Rate Analysis (2021-2032)
Indonesia Electric Vehicle Charging Infrastructure Market Growth Rate Analysis (2021-2032)
The Indonesia Electric Vehicle Charging Infrastructure market has shown a noteworthy upward trend, rebounding from a slight decline of -0.5% in 2021. Growth accelerated to 4.4% in 2022 and further advanced to 5.3% in 2023, as increased governmental support and investments in renewable energy amplified consumer adoption of electric vehicles (EVs). This momentum is expected to persist, with projected growth rates of 5.4% in 2024 and 5.5% in 2025. The ongoing digitalization efforts and significant infrastructure developments are enhancing accessibility to charging networks, catering to rising consumer demand. However, growth may stabilize slightly at 5.0% by 2028, reflective of market maturity and competitive factors within this evolving sector.
Indonesia Electric Vehicle Charging Infrastructure Market Year-wise Growth Rate and Key Drivers
This graph highlights how the Indonesia Electric Vehicle Charging Infrastructure Market has steadily grown over the past five years, supported by major growth factors.
The table below presents the year‑wise growth rates along with the key drivers influencing the market
| Year | Growth Rate | Major Drivers |
| 2021 | -0.5% | Consumer interest in EVs waned |
| 2022 | 4.4% | Government incentives spurred adoption |
| 2023 | 5.3% | Charging station installations accelerated growth |
| 2024 | 5.4% | Partnerships expanded charging networks |
| 2025 | 5.5% | Technological advancements enhanced efficiency |
| 2026 | 5.8% | Increased investment attracted new players |
| 2027 | 5.3% | Public awareness campaigns drove demand |
| 2028 | 5.0% | Urban infrastructure improvements facilitated access |
| 2029 | 5.6% | Corporate sustainability initiatives gained traction |
| 2030 | 5.3% | Integration with renewable energy sources |
| 2031 | 5.7% | Consumer preferences shifted towards EVs |
| 2032 | 5.4% | Smart charging solutions enhanced convenience |
Note - Market size estimations and growth projections presented in this report are based on 6Wresearch’s advanced forecasting approach, validated with industry datasets as of June 2026.
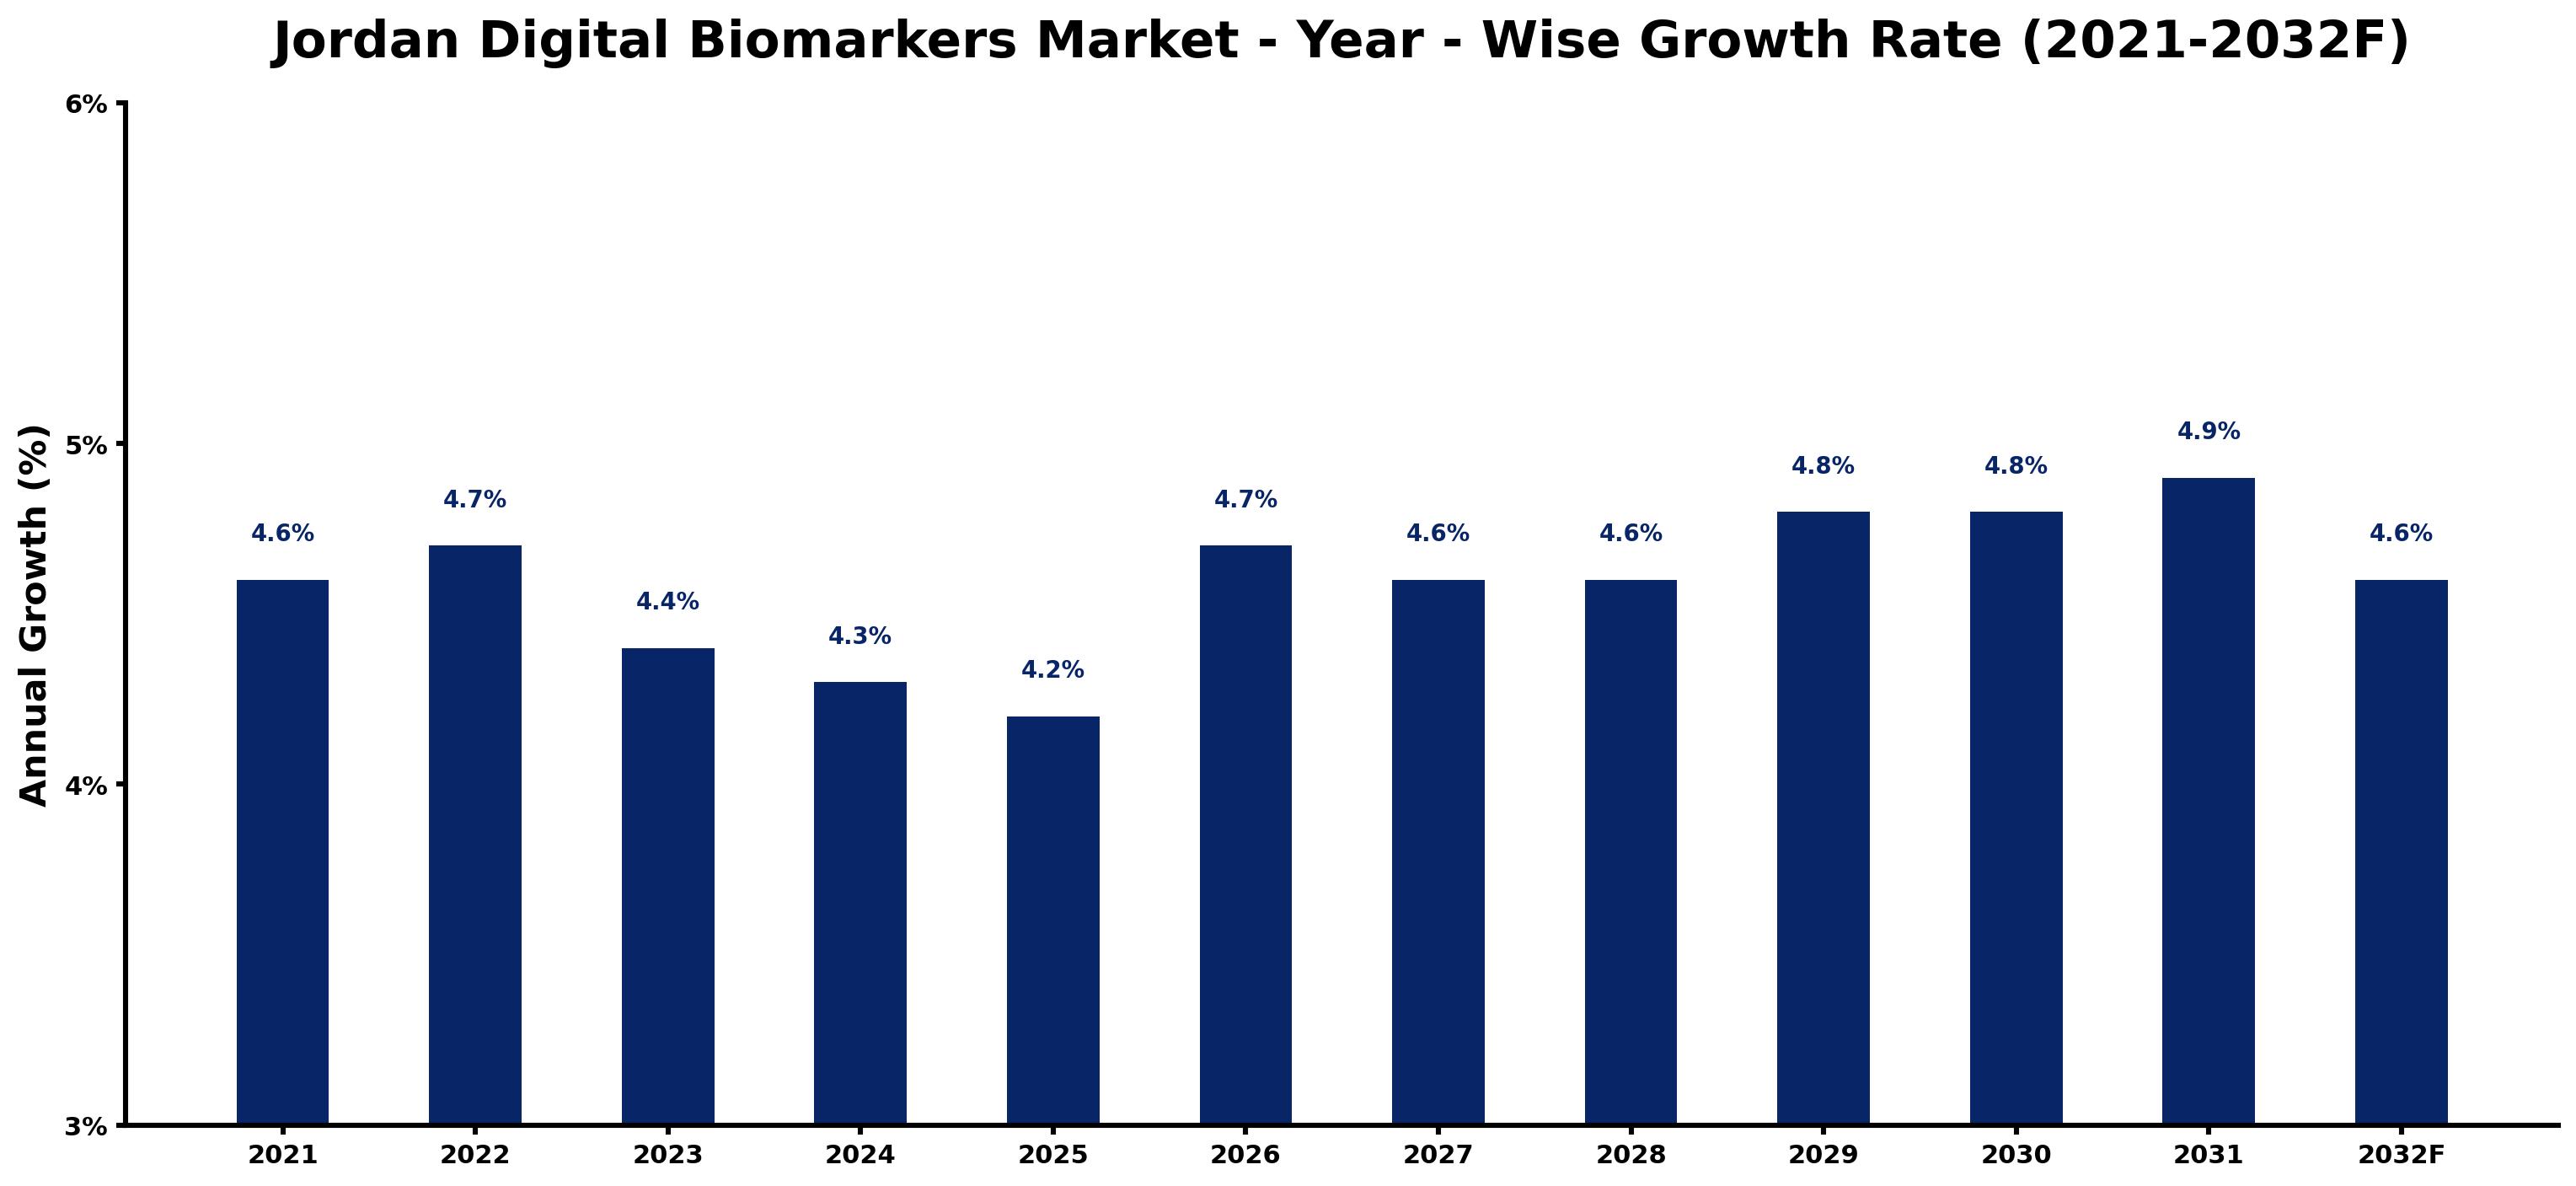
The Jordan Digital Biomarkers market is experiencing stable yet modest growth, with yearly increases ranging from 4.2% to 4.9% from 2021 through 2032. Notably, growth peaked at 4.9% in 2031, spurred by rising consumer demand for personalized healthcare solutions and advancements in digital health technologies. The market's slight fluctuation, particularly the dip to 4.4% in 2023 and 4.2% in 2025, can be attributed to inconsistent policy support and a temporary slowdown in infrastructure development. However, as digitalization gains traction, investments in innovative health monitoring applications are projected to rejuvenate growth, seen in the anticipated 4.8% increase in 2029 and 2030, reflecting a robust response to evolving healthcare demands in Jordan.
Jordan Digital Biomarkers Market Year-wise Growth Rate and Key Drivers
This graph highlights how the Jordan Digital Biomarkers Market has steadily grown over the past five years, supported by major growth factors.
The table below presents the year‑wise growth rates along with the key drivers influencing the market
| Year | Growth Rate | Major Drivers |
| 2021 | 4.6% | Growing urbanization and commercial development |
| 2022 | 4.7% | Expansion of commercial construction activities |
| 2023 | 4.4% | Government infrastructure modernization initiatives |
| 2024 | 4.3% | Expansion of manufacturing activities |
| 2025 | 4.2% | Increasing adoption of advanced technologies |
| 2026 | 4.7% | Rising electricity demand across industries |
| 2027 | 4.6% | Increasing industrial infrastructure investments |
| 2028 | 4.6% | Increasing industrial infrastructure investments |
| 2029 | 4.8% | Expansion of commercial construction activities |
| 2030 | 4.8% | Expansion of transportation and logistics networks |
| 2031 | 4.9% | Increasing industrial infrastructure investments |
| 2032 | 4.6% | Increasing smart city development projects |
Note - Market size estimations and growth projections presented in this report are based on 6Wresearch’s advanced forecasting approach, validated with industry datasets as of June 2026.
Indonesia Electric Vehicle Charging Infrastructure Market Synopsis
The most significant force shaping the Indonesia Electric Vehicle Charging Infrastructure Market is the government’s strategic push towards achieving a greener transportation system. Policies aimed at fostering the adoption of electric vehicles are creating a pressing need for the establishment of accessible and efficient charging stations.
Additionally, public-private partnerships are becoming increasingly crucial in scaling up infrastructure investments. These collaborations facilitate technology sharing and help address the financial barriers often associated with charging station development, ultimately propelling the market forward.
Indonesia Electric Vehicle Charging Infrastructure Market Key Takeaways
- The market is benefitting from substantial government initiatives aimed at promoting electric vehicle adoption.
- Technological advancements in charging solutions are enhancing efficiency and user convenience.
- Public-private partnerships are key to developing a comprehensive charging network.
- Consumer awareness regarding sustainability is increasing, further driving the demand for electric vehicles and, consequently, charging infrastructure.
- Urbanization trends in Indonesia are necessitating the expansion of charging facilities to cater to growing urban populations.
Evaluation of Restraints in Indonesia Electric Vehicle Charging Infrastructure Market
Despite the optimistic outlook, several factors restrain the growth of the Indonesia Electric Vehicle Charging Infrastructure Market. A significant challenge is the current underdeveloped charging infrastructure, which struggles to meet the expected increase in electric vehicle adoption. Additionally, there are concerns over the availability of investment for large-scale deployment, as potential investors remain cautious amidst economic uncertainties. Furthermore, the varying pace of infrastructure development across different regions in Indonesia creates imbalances that may hinder nationwide adoption of electric vehicles.
Indonesia Electric Vehicle Charging Infrastructure Market Trends
Several notable trends are influencing the Indonesia Electric Vehicle Charging Infrastructure Market. The rise of fast-charging technologies is reshaping the landscape by significantly reducing charging times, making electric vehicles more appealing to consumers. Additionally, the integration of smart technology into charging stations, enabling features like real-time monitoring and mobile app connectivity, is becoming increasingly commonplace. Such advancements not only enhance user experience but also optimize energy management in charging operations.
Indonesia Electric Vehicle Charging Infrastructure Market Opportunities
Investment opportunities in the Indonesia Electric Vehicle Charging Infrastructure Market are thriving, particularly in urban areas where the density of electric vehicle users is anticipated to rise. Companies focusing on building and operating charging stations can leverage government incentives to establish competitive pricing and gain market share. Moreover, the growing collaboration with technology firms to develop efficient charging solutions and energy management systems presents a fertile ground for innovation and growth.
Government Initiatives in the Indonesia Electric Vehicle Charging Infrastructure Market
The Indonesian government is actively promoting electric vehicle adoption through various initiatives, including subsidies for electric vehicle purchases and funding for charging infrastructure development. Programs aimed at facilitating partnerships between the public and private sectors are also underway, designed to expedite the establishment of charging stations across urban and rural areas alike. These policies not only enhance the visibility of electric vehicles but also seek to build a comprehensive network of charging facilities, ensuring seamless access for users.
Future Insights of the Indonesia Electric Vehicle Charging Infrastructure Market
Looking ahead to 2026-2032, the Indonesia Electric Vehicle Charging Infrastructure Market is expected to experience robust growth propelled by the accelerating shift towards sustainability. The increasing urgency to combat climate change and air pollution will likely lead to stricter regulations on fossil fuel vehicles, further incentivizing electric vehicle adoption. In turn, this will amplify the demand for charging infrastructure, presenting significant opportunities for stakeholders across the spectrum. The future market landscape will be shaped by technological advancements, evolving consumer preferences, and comprehensive government policies aimed at fostering a sustainable and efficient transportation ecosystem.
Indonesia Electric Vehicle Charging Infrastructure Market Latest Developments (May 2025 - June 2026)
Recent developments in the Indonesia Electric Vehicle Charging Infrastructure Market indicate a heightened focus on expanding charging networks across major cities. Ongoing pilot projects are testing innovative charging solutions, including solar-powered stations and ultra-fast charging technology. Additionally, collaborations between local governments and private enterprises are beginning to emerge, aimed at addressing infrastructure gaps and enhancing user accessibility. The landscape is evolving rapidly as stakeholders work collectively to meet the growing demand for electric vehicle infrastructure.
Indonesia Electric Vehicle Charging Infrastructure Market - Key Attractiveness of the Report
- 10 Years of Market Numbers
- Historical Data Starting from 2022 to 2025
- Base Year: 2025
- Forecast Data until 2032
- Key Performance Indicators Impacting the Market
- Major Upcoming Developments and Projects
Key Highlights of the Report:
- Jordan Digital Biomarkers Market Outlook
- Market Size of Jordan Digital Biomarkers Market, 2025
- Forecast of Jordan Digital Biomarkers Market, 2032
- Historical Data and Forecast of Jordan Digital Biomarkers Revenues & Volume for the Period 2022-2032F
- Jordan Digital Biomarkers Market Trend Evolution
- Jordan Digital Biomarkers Market Drivers and Challenges
- Jordan Digital Biomarkers Price Trends
- Jordan Digital Biomarkers Porter's Five Forces
- Jordan Digital Biomarkers Industry Life Cycle
- Historical Data and Forecast of Jordan Digital Biomarkers Market Revenues & Volume By Type for the Period 2022-2032F
- Historical Data and Forecast of Jordan Digital Biomarkers Market Revenues & Volume By Wellness for the Period 2022-2032F
- Historical Data and Forecast of Jordan Digital Biomarkers Market Revenues & Volume By Disease for the Period 2022-2032F
- Historical Data and Forecast of Jordan Digital Biomarkers Market Revenues & Volume By Drugs for the Period 2022-2032F
- Historical Data and Forecast of Jordan Digital Biomarkers Market Revenues & Volume By Collection System Type for the Period 2022-2032F
- Historical Data and Forecast of Jordan Digital Biomarkers Market Revenues & Volume By Wearables for the Period 2022-2032F
- Historical Data and Forecast of Jordan Digital Biomarkers Market Revenues & Volume By Biosensors for the Period 2022-2032F
- Historical Data and Forecast of Jordan Digital Biomarkers Market Revenues & Volume By Mobile Apps for the Period 2022-2032F
- Historical Data and Forecast of Jordan Digital Biomarkers Market Revenues & Volume By Devices and Platforms for the Period 2022-2032F
- Historical Data and Forecast of Jordan Digital Biomarkers Market Revenues & Volume By Desktop Based Software for the Period 2022-2032F
- Historical Data and Forecast of Jordan Digital Biomarkers Market Revenues & Volume By End-users for the Period 2022-2032F
- Historical Data and Forecast of Jordan Digital Biomarkers Market Revenues & Volume By Pharmaceutical for the Period 2022-2032F
- Historical Data and Forecast of Jordan Digital Biomarkers Market Revenues & Volume By Life Sciences for the Period 2022-2032F
- Historical Data and Forecast of Jordan Digital Biomarkers Market Revenues & Volume By Medical Devices for the Period 2022-2032F
- Historical Data and Forecast of Jordan Digital Biomarkers Market Revenues & Volume By App Vendors for the Period 2022-2032F
- Historical Data and Forecast of Jordan Digital Biomarkers Market Revenues & Volume By Clinical Research Organizations for the Period 2022-2032F
- Historical Data and Forecast of Jordan Digital Biomarkers Market Revenues & Volume By Technology for the Period 2022-2032F
- Historical Data and Forecast of Jordan Digital Biomarkers Market Revenues & Volume By Cloud Computing for the Period 2022-2032F
- Historical Data and Forecast of Jordan Digital Biomarkers Market Revenues & Volume By Artificial Intelligence and Machine Learning for the Period 2022-2032F
- Historical Data and Forecast of Jordan Digital Biomarkers Market Revenues & Volume By Augmented Reality for the Period 2022-2032F
- Historical Data and Forecast of Jordan Digital Biomarkers Market Revenues & Volume By Blockchain for the Period 2022-2032F
- Jordan Digital Biomarkers Import Export Trade Statistics
- Market Opportunity Assessment By Type
- Market Opportunity Assessment By Collection System Type
- Market Opportunity Assessment By End-users
- Market Opportunity Assessment By Technology
- Jordan Digital Biomarkers Top Companies Market Share
- Jordan Digital Biomarkers Competitive Benchmarking By Technical and Operational Parameters
- Jordan Digital Biomarkers Company Profiles
- Jordan Digital Biomarkers Key Strategic Recommendations
Frequently Asked Questions About the Market Study (FAQs):
The market was valued at USD 200 Million in 2025 and is projected to grow to USD 265 Million by 2032, indicating a CAGR of 4.1% between 2026 and 2032.
The Indonesian government is implementing various initiatives, including subsidies for EV purchases and funding programs to expand the charging infrastructure, encouraging both private investment and public participation.
Current trends include advancements in fast-charging technologies and the integration of smart features into charging stations, enhancing both user experience and operational efficiency.
Urban areas, particularly major cities like Jakarta and Surabaya, are witnessing the fastest growth due to higher concentrations of electric vehicle users and supportive local policies.
Investors face challenges such as the uneven pace of infrastructure development across regions, potential financial risks, and the need for public engagement to increase electric vehicle adoption.
6Wresearch actively monitors the Jordan Digital Biomarkers Market and publishes its comprehensive annual report, highlighting emerging trends, growth drivers, revenue analysis, and forecast outlook. Our insights help businesses to make data-backed strategic decisions with ongoing market dynamics. Our analysts track relevent industries related to the Jordan Digital Biomarkers Market, allowing our clients with actionable intelligence and reliable forecasts tailored to emerging regional needs.
Yes, we provide customisation as per your requirements. To learn more, feel free to contact us on sales@6wresearch.com
1 Executive Summary |
2 Introduction |
2.1 Key Highlights of the Report |
2.2 Report Description |
2.3 Market Scope & Segmentation |
2.4 Research Methodology |
2.5 Assumptions |
3 Jordan Digital Biomarkers Market Overview |
3.1 Jordan Country Macro Economic Indicators |
3.2 Jordan Digital Biomarkers Market Revenues & Volume, 2022 & 2032F |
3.3 Jordan Digital Biomarkers Market - Industry Life Cycle |
3.4 Jordan Digital Biomarkers Market - Porter's Five Forces |
3.5 Jordan Digital Biomarkers Market Revenues & Volume Share, By Type, 2022 & 2032F |
3.6 Jordan Digital Biomarkers Market Revenues & Volume Share, By Collection System Type, 2022 & 2032F |
3.7 Jordan Digital Biomarkers Market Revenues & Volume Share, By End-users, 2022 & 2032F |
3.8 Jordan Digital Biomarkers Market Revenues & Volume Share, By Technology, 2022 & 2032F |
4 Jordan Digital Biomarkers Market Dynamics |
4.1 Impact Analysis |
4.2 Market Drivers |
4.2.1 Government initiatives and policies promoting electric vehicles and charging infrastructure. |
4.2.2 Growing awareness and adoption of electric vehicles among consumers and businesses. |
4.2.3 Increasing concerns about environmental sustainability and reducing carbon emissions. |
4.3 Market Restraints |
4.3.1 High initial investment and infrastructure setup costs. |
4.3.2 Limited availability of charging stations, especially in rural areas. |
4.3.3 Technological challenges and interoperability issues among different charging standards. |
5 Jordan Digital Biomarkers Market Trends |
6 Jordan Digital Biomarkers Market, By Types |
6.1 Jordan Digital Biomarkers Market, By Type |
6.1.1 Overview and Analysis |
6.1.2 Jordan Digital Biomarkers Market Revenues & Volume, By Type, 2022-2032F |
6.1.3 Jordan Digital Biomarkers Market Revenues & Volume, By Wellness, 2022-2032F |
6.1.4 Jordan Digital Biomarkers Market Revenues & Volume, By Disease, 2022-2032F |
6.1.5 Jordan Digital Biomarkers Market Revenues & Volume, By Drugs, 2022-2032F |
6.2 Jordan Digital Biomarkers Market, By Collection System Type |
6.2.1 Overview and Analysis |
6.2.2 Jordan Digital Biomarkers Market Revenues & Volume, By Wearables, 2022-2032F |
6.2.3 Jordan Digital Biomarkers Market Revenues & Volume, By Biosensors, 2022-2032F |
6.2.4 Jordan Digital Biomarkers Market Revenues & Volume, By Mobile Apps, 2022-2032F |
6.2.5 Jordan Digital Biomarkers Market Revenues & Volume, By Devices and Platforms, 2022-2032F |
6.2.6 Jordan Digital Biomarkers Market Revenues & Volume, By Desktop Based Software, 2022-2032F |
6.3 Jordan Digital Biomarkers Market, By End-users |
6.3.1 Overview and Analysis |
6.3.2 Jordan Digital Biomarkers Market Revenues & Volume, By Pharmaceutical, 2022-2032F |
6.3.3 Jordan Digital Biomarkers Market Revenues & Volume, By Life Sciences, 2022-2032F |
6.3.4 Jordan Digital Biomarkers Market Revenues & Volume, By Medical Devices, 2022-2032F |
6.3.5 Jordan Digital Biomarkers Market Revenues & Volume, By App Vendors, 2022-2032F |
6.3.6 Jordan Digital Biomarkers Market Revenues & Volume, By Clinical Research Organizations, 2022-2032F |
6.4 Jordan Digital Biomarkers Market, By Technology |
6.4.1 Overview and Analysis |
6.4.2 Jordan Digital Biomarkers Market Revenues & Volume, By Cloud Computing, 2022-2032F |
6.4.3 Jordan Digital Biomarkers Market Revenues & Volume, By Artificial Intelligence and Machine Learning, 2022-2032F |
6.4.4 Jordan Digital Biomarkers Market Revenues & Volume, By Augmented Reality, 2022-2032F |
6.4.5 Jordan Digital Biomarkers Market Revenues & Volume, By Blockchain, 2022-2032F |
7 Jordan Digital Biomarkers Market Import-Export Trade Statistics |
7.1 Jordan Digital Biomarkers Market Export to Major Countries |
7.2 Jordan Digital Biomarkers Market Imports from Major Countries |
8 Jordan Digital Biomarkers Market Key Performance Indicators |
8.1 Number of public and private charging stations installed. |
8.2 Average charging time and efficiency of charging stations. |
8.3 Percentage increase in electric vehicle adoption rate. |
8.4 Number of partnerships and collaborations between stakeholders in the EV charging infrastructure market. |
8.5 Average distance between charging stations to assess accessibility and coverage. |
9 Jordan Digital Biomarkers Market - Opportunity Assessment |
9.1 Jordan Digital Biomarkers Market Opportunity Assessment, By Type, 2022 & 2032F |
9.2 Jordan Digital Biomarkers Market Opportunity Assessment, By Collection System Type, 2022 & 2032F |
9.3 Jordan Digital Biomarkers Market Opportunity Assessment, By End-users, 2022 & 2032F |
9.4 Jordan Digital Biomarkers Market Opportunity Assessment, By Technology, 2022 & 2032F |
10 Jordan Digital Biomarkers Market - Competitive Landscape |
10.1 Jordan Digital Biomarkers Market Revenue Share, By Companies, 2025 |
10.2 Jordan Digital Biomarkers Market Competitive Benchmarking, By Operating and Technical Parameters |
11 Company Profiles |
12 Recommendations |
13 Disclaimer |
Global Go To Market Strategy - 2030
Export potential enables firms to identify high-growth global markets with greater confidence by combining advanced trade intelligence with a structured quantitative methodology. The framework analyzes emerging demand trends and country-level import patterns while integrating macroeconomic and trade datasets such as GDP and population forecasts, bilateral import–export flows, tariff structures, elasticity differentials between developed and developing economies, geographic distance, and import demand projections. Using weighted trade values from 2020–2024 as the base period to project country-to-country export potential for 2030, these inputs are operationalized through calculated drivers such as gravity model parameters, tariff impact factors, and projected GDP per-capita growth. Through an analysis of hidden potentials, demand hotspots, and market conditions that are most favorable to success, this method enables firms to focus on target countries, maximize returns, and global expansion with data, backed by accuracy.
By factoring in the projected importer demand gap that is currently unmet and could be potential opportunity, it identifies the potential for the Exporter (Country) among 190 countries, against the general trade analysis, which identifies the biggest importer or exporter.
To discover high-growth global markets and optimize your business strategy:
Click Here
Pricing
- Single User License$ 1,995
- Department License$ 2,400
- Site License$ 3,120
- Global License$ 3,795

Leadership Perspectives from Industry Events
Search
Thought Leadership and Analyst Meet


Our Clients
6WResearch In News
- India Air Conditioner Market Set for Strong Rebound in 2026 After Weather-Led Correction and GST-Driven Recovery: 6Wresearch
- ADAS in India: How Automatic Emergency Braking, Blind Spot Detection & Driver Monitoring are Transforming Road Safety
- Doha a strategic location for EV manufacturing hub: IPA Qatar
- Demand for luxury TVs surging in the GCC, says Samsung
- Empowering Growth: The Thriving Journey of Bangladesh’s Cable Industry
- Demand for luxury TVs surging in the GCC, says Samsung
Latest Reports
- Poland Fire Protection Systems Market (2026-2032)
- Cape Verde Portable Hand-Thrown Extinguisher Market (2026-2032)
- Canada Portable Hand-Thrown Extinguisher Market (2026-2032)
- Cameroon Portable Hand-Thrown Extinguisher Market (2026-2032)
- Burundi Portable Hand-Thrown Extinguisher Market (2026-2032)
- Burkina Faso Portable Hand-Thrown Extinguisher Market (2026-2032)
- Bulgaria Portable Hand-Thrown Extinguisher Market (2026-2032)
- Brunei Portable Hand-Thrown Extinguisher Market (2026-2032)
- Botswana Portable Hand-Thrown Extinguisher Market (2026-2032)
- Bosnia and Herzegovina Portable Hand-Thrown Extinguisher Market (2026-2032)
Industry Events and Analyst Meet

HIMTEX 2026

India Refining Summit 2026

India EV Show 2026

EV tech India Expo 2026

Auto Tech Asia 2026
Whitepaper
- Middle East & Africa Commercial Security Market Click here to view more.
- Middle East & Africa Fire Safety Systems & Equipment Market Click here to view more.
- GCC Drone Market Click here to view more.
- Middle East Lighting Fixture Market Click here to view more.
- GCC Physical & Perimeter Security Market Click here to view more.