Belgium Canned Tuna Market (2025-2031) | Value, Trends, Growth, Share, Size, Segmentation, Outlook, Forecast, Analysis, Industry, Companies & Revenue
Market Forecast By Product (Skipjack, Yellowfin, Others), By Distribution Channel (Hypermarket & Supermarket, Specialty Stores, Online) And Competitive Landscape
| Product Code: ETC4816997 | Publication Date: Nov 2023 | Updated Date: Apr 2026 | Product Type: Market Research Report | |
| Publisher: 6Wresearch | Author: Sachin Kumar Rai | No. of Pages: 60 | No. of Figures: 30 | No. of Tables: 5 |
Belgium Canned Tuna Market Size (2020-2030)
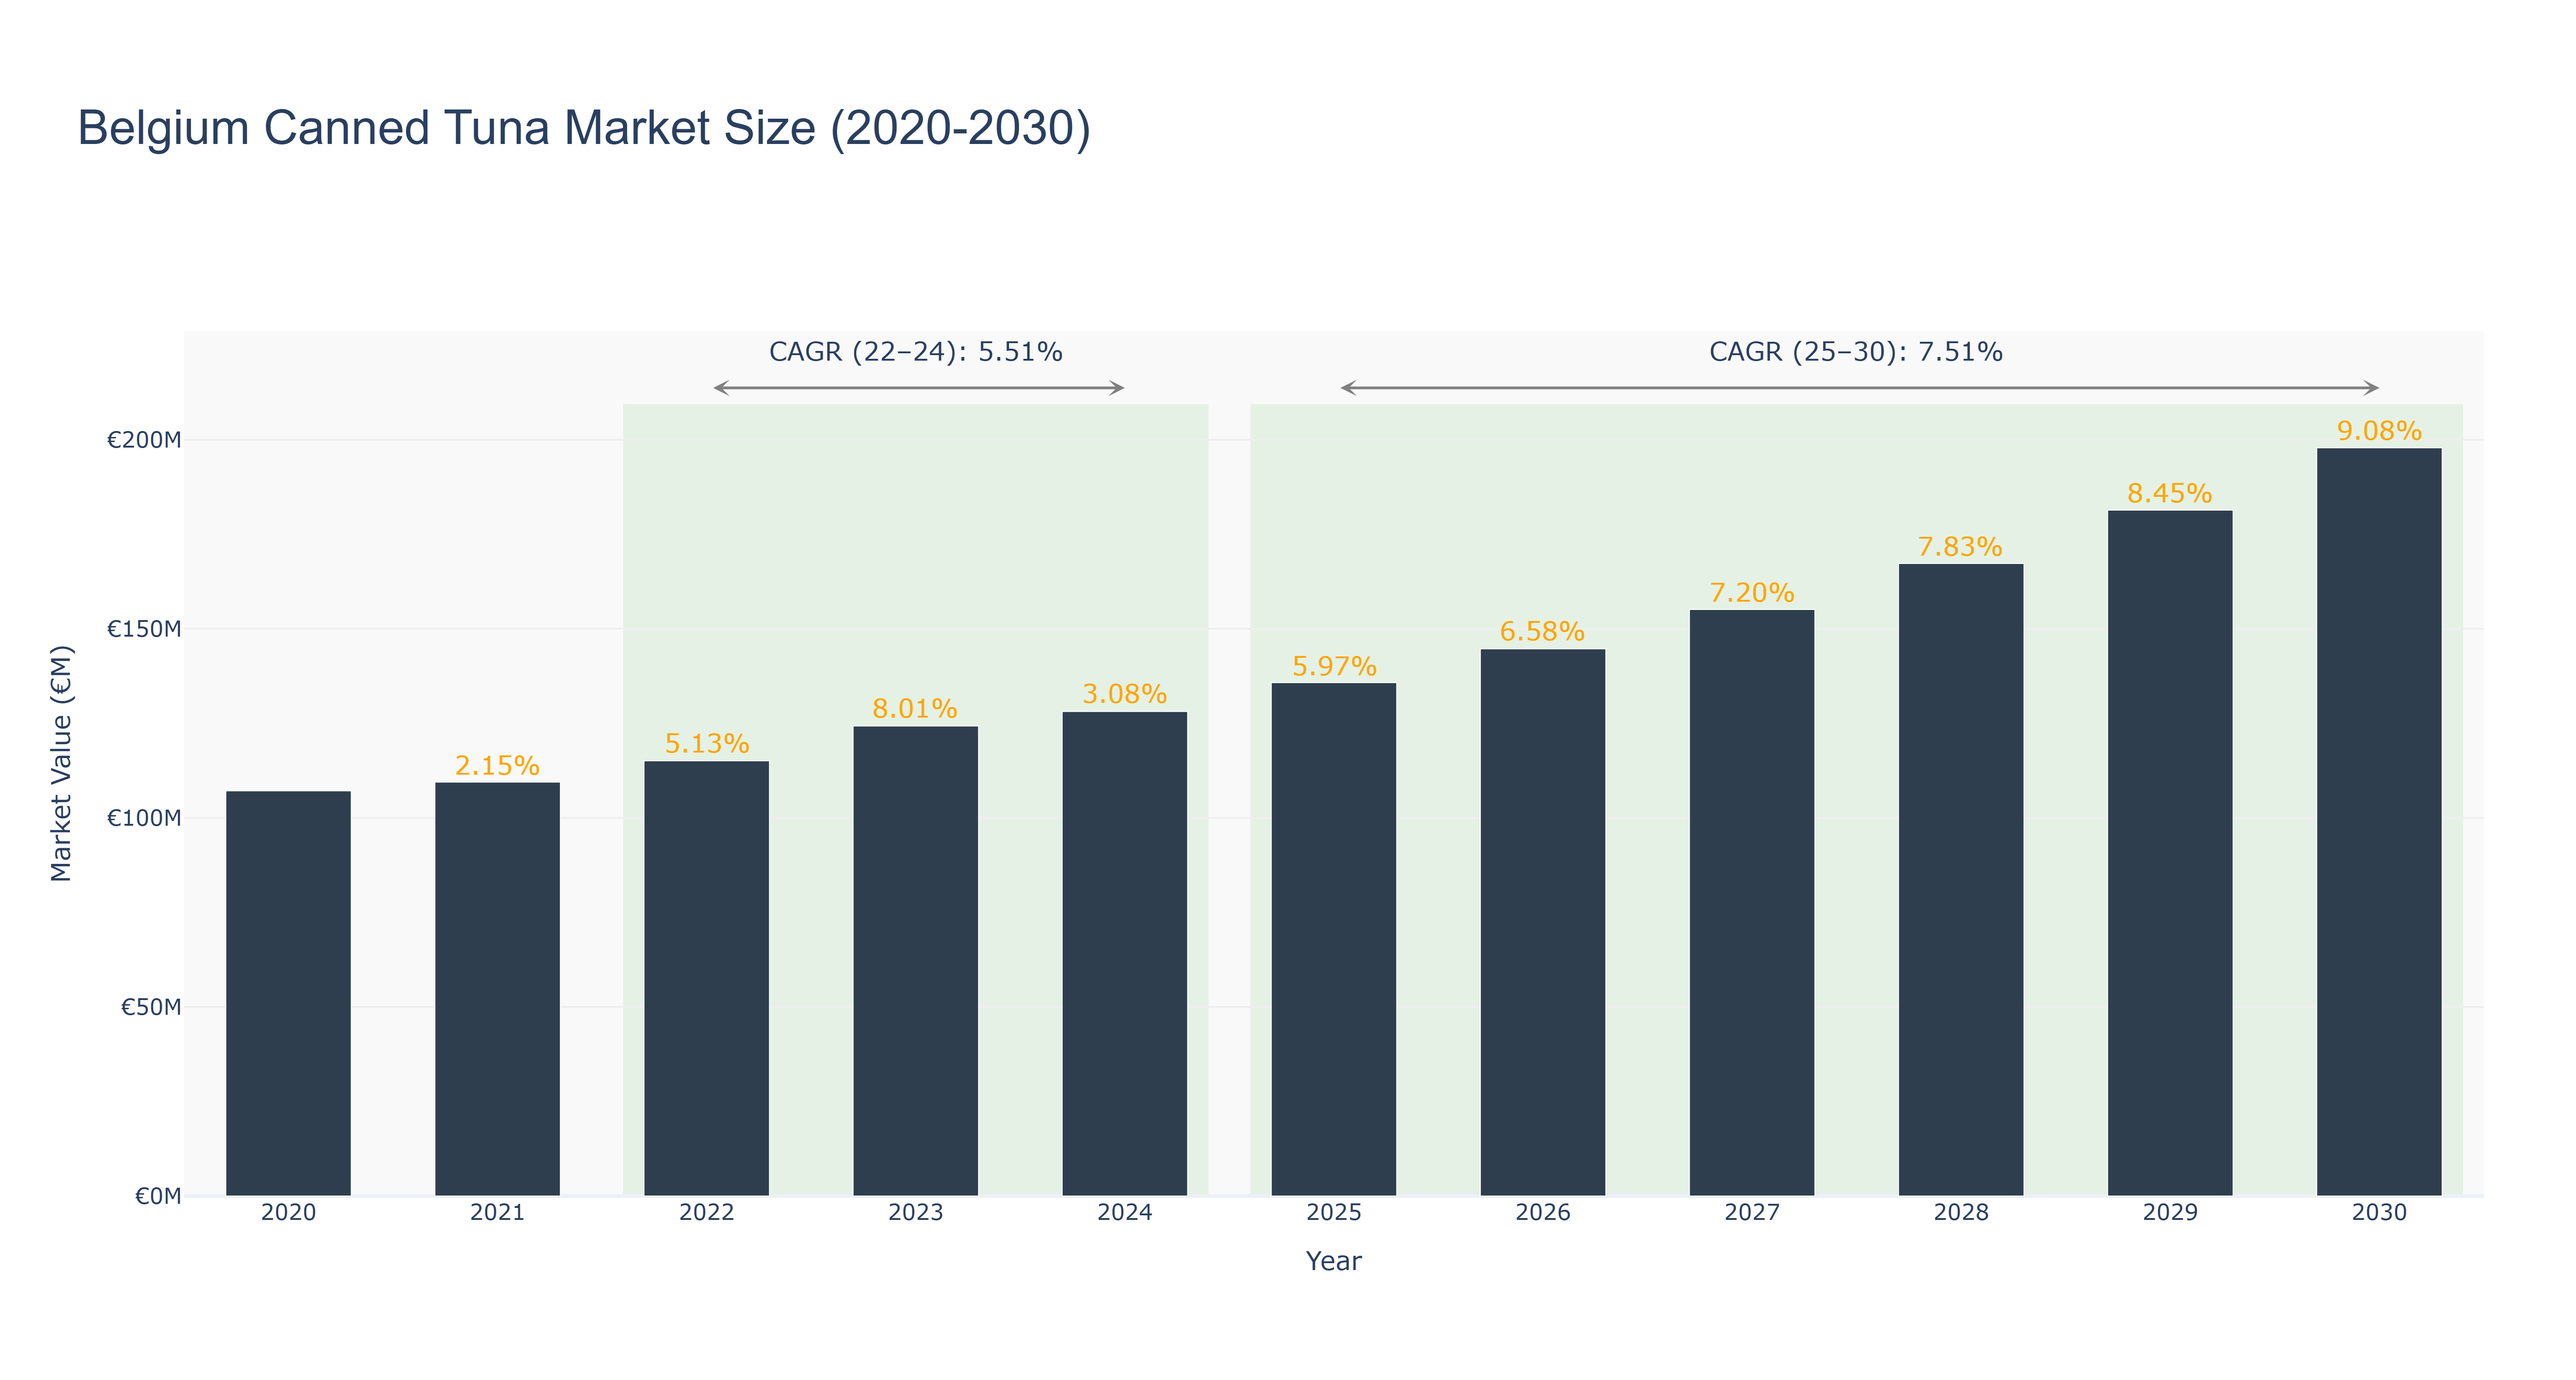
The Belgium Canned Tuna Market has demonstrated a robust growth trajectory, with the market size reaching its peak of €124.29 million in 2023, up from €115.08 million in 2022, reflecting a significant growth rate of 8.01% during this period. The actual CAGR from 2022 to 2024 is recorded at 5.51%, indicating stable growth amid rising consumer demand for convenient and healthy food options. Looking ahead, the forecasted market size is projected to increase substantially, reaching €197.88 million by 2030, with a CAGR of 7.51% from 2025-2030. This anticipated growth can be attributed to the ongoing trends of sustainability and a growing emphasis on marine conservation, driving innovations in eco-friendly packaging and sustainable sourcing practices. As consumers increasingly seek responsibly sourced products, the market is poised for dynamic expansion, supported by the strategic initiatives of key players within the industry.
Belgium Canned Tuna Market: Production & Trade Performance (2019-2025)
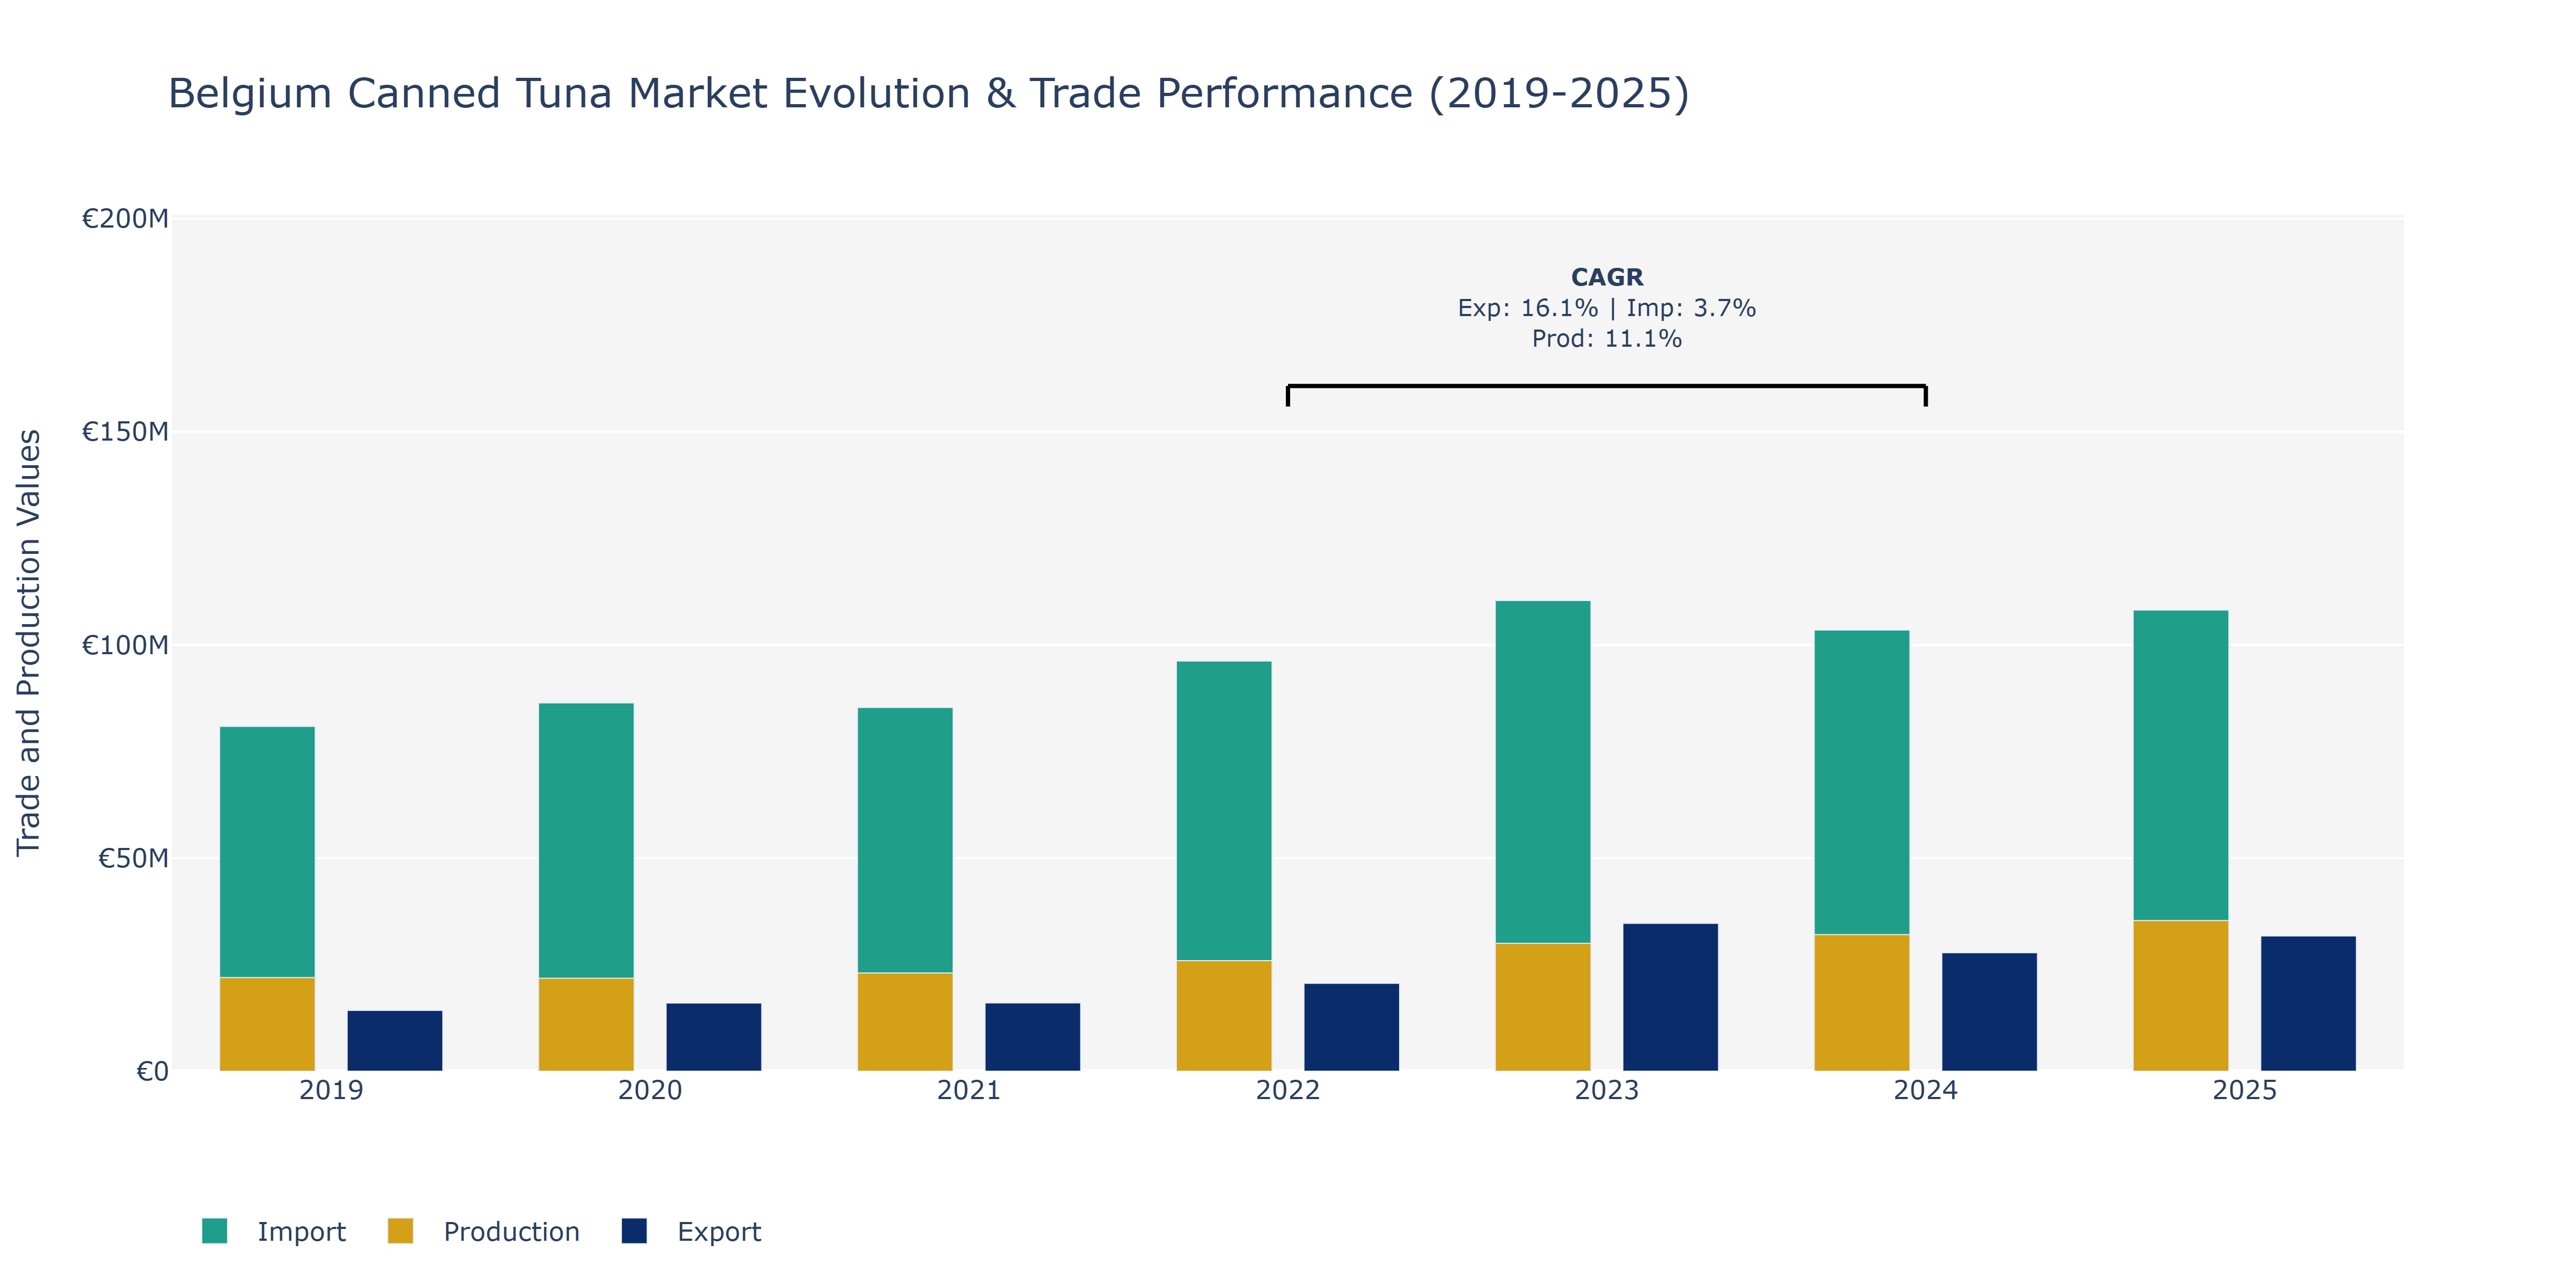
In the Belgium Canned Tuna Market, from 2019 to 2025, Exports exhibited an upward trajectory, reaching a peak of around €34.68 million in 2023 before slightly decreasing in 2024. This surge in Exports could be attributed to increased global demand for canned tuna products, reflecting changing consumer preferences towards convenient and healthy food options. Imports also showed a consistent growth pattern, with a notable increase from €80.88 million in 2019 to €108.18 million in 2025, indicative of the market's reliance on imported tuna products. On the other hand, Production levels steadily rose year on year, hitting a high of €35.35 million in 2025, driven by technological advancements in processing facilities and efforts to meet growing market demands. The CAGR figures further emphasize the market's positive momentum, especially in Exports and Production, highlighting the industry's potential for sustained growth in the coming years. Such trends align with the broader seafood industry's shift towards sustainable practices and the rising popularity of canned tuna as a convenient protein source among consumers.
Belgium Canned Tuna Market Overview
Canned tuna is a major segment of the canned seafood market in Belgium. It is widely used in salads, sandwiches, and pasta dishes. The market benefits from the product`s high protein content and versatility. Sustainability concerns are significant in this market, with many consumers seeking tuna sourced from certified sustainable fisheries. The industry is also responding to demands for transparency in sourcing and processing, as well as innovations in packaging to reduce environmental impact.
Drivers of the market
The demand for canned tuna in Belgium is fueled by its popularity as a healthy and convenient food option. Canned tuna is a versatile ingredient used in various dishes, from salads to sandwiches. The increasing awareness of the health benefits associated with tuna, such as its high protein and omega-3 content, drives market demand. Additionally, the long shelf life and ease of storage of canned tuna make it a staple in many households.
Challenges of the market
The Belgium canned tuna market is challenged by issues related to sustainability and market competition. Overfishing and strict regulations on tuna fishing quotas affect the availability and cost of raw materials, leading to supply chain instability and price volatility. Consumer demand for sustainably sourced tuna necessitates adherence to certification standards, which can increase operational costs. Additionally, the market faces intense competition from fresh and frozen tuna products, as well as other protein sources, driving the need for product innovation and differentiation. Health concerns about mercury levels in tuna and the use of preservatives in canned products also impact consumer confidence and demand.
Government Policy of the market
The canned tuna market in Belgium is influenced by both consumer demand for convenient protein sources and government regulations. Policies aimed at ensuring sustainable fishing practices and reducing overfishing are critical for the market. The government also supports initiatives to promote the health benefits of tuna consumption. Compliance with stringent EU food safety standards ensures that canned tuna products are safe and of high quality, thereby supporting market growth.
Key Highlights of the Report:
- Belgium Canned Tuna Market Outlook
- Market Size of Belgium Canned Tuna Market, 2024
- Forecast of Belgium Canned Tuna Market, 2031
- Historical Data and Forecast of Belgium Canned Tuna Revenues & Volume for the Period 2021-2031
- Belgium Canned Tuna Market Trend Evolution
- Belgium Canned Tuna Market Drivers and Challenges
- Belgium Canned Tuna Price Trends
- Belgium Canned Tuna Porter`s Five Forces
- Belgium Canned Tuna Industry Life Cycle
- Historical Data and Forecast of Belgium Canned Tuna Market Revenues & Volume By Product for the Period 2021-2031
- Historical Data and Forecast of Belgium Canned Tuna Market Revenues & Volume By Skipjack for the Period 2021-2031
- Historical Data and Forecast of Belgium Canned Tuna Market Revenues & Volume By Yellowfin for the Period 2021-2031
- Historical Data and Forecast of Belgium Canned Tuna Market Revenues & Volume By Others for the Period 2021-2031
- Historical Data and Forecast of Belgium Canned Tuna Market Revenues & Volume By Distribution Channel for the Period 2021-2031
- Historical Data and Forecast of Belgium Canned Tuna Market Revenues & Volume By Hypermarket & Supermarket for the Period 2021-2031
- Historical Data and Forecast of Belgium Canned Tuna Market Revenues & Volume By Specialty Stores for the Period 2021-2031
- Historical Data and Forecast of Belgium Canned Tuna Market Revenues & Volume By Online for the Period 2021-2031
- Belgium Canned Tuna Import Export Trade Statistics
- Market Opportunity Assessment By Product
- Market Opportunity Assessment By Distribution Channel
- Belgium Canned Tuna Top Companies Market Share
- Belgium Canned Tuna Competitive Benchmarking By Technical and Operational Parameters
- Belgium Canned Tuna Company Profiles
- Belgium Canned Tuna Key Strategic Recommendations
Frequently Asked Questions About the Market Study (FAQs):
6Wresearch actively monitors the Belgium Canned Tuna Market and publishes its comprehensive annual report, highlighting emerging trends, growth drivers, revenue analysis, and forecast outlook. Our insights help businesses to make data-backed strategic decisions with ongoing market dynamics. Our analysts track relevent industries related to the Belgium Canned Tuna Market, allowing our clients with actionable intelligence and reliable forecasts tailored to emerging regional needs.
Yes, we provide customisation as per your requirements. To learn more, feel free to contact us on sales@6wresearch.com
1 Executive Summary |
2 Introduction |
2.1 Key Highlights of the Report |
2.2 Report Description |
2.3 Market Scope & Segmentation |
2.4 Research Methodology |
2.5 Assumptions |
3 Belgium Canned Tuna Market Overview |
3.1 Belgium Country Macro Economic Indicators |
3.2 Belgium Canned Tuna Market Revenues & Volume, 2021 & 2031F |
3.3 Belgium Canned Tuna Market - Industry Life Cycle |
3.4 Belgium Canned Tuna Market - Porter's Five Forces |
3.5 Belgium Canned Tuna Market Revenues & Volume Share, By Product, 2021 & 2031F |
3.6 Belgium Canned Tuna Market Revenues & Volume Share, By Distribution Channel, 2021 & 2031F |
4 Belgium Canned Tuna Market Dynamics |
4.1 Impact Analysis |
4.2 Market Drivers |
4.2.1 Increasing consumer awareness about the health benefits of consuming tuna. |
4.2.2 Growing demand for convenient and ready-to-eat food products. |
4.2.3 Rising popularity of seafood-based diets. |
4.3 Market Restraints |
4.3.1 Fluctuating raw material prices affecting production costs. |
4.3.2 Competition from other protein sources like chicken or plant-based alternatives. |
4.3.3 Concerns over sustainability and overfishing in the tuna industry. |
5 Belgium Canned Tuna Market Trends |
6 Belgium Canned Tuna Market Segmentations |
6.1 Belgium Canned Tuna Market, By Product |
6.1.1 Overview and Analysis |
6.1.2 Belgium Canned Tuna Market Revenues & Volume, By Skipjack, 2021-2031F |
6.1.3 Belgium Canned Tuna Market Revenues & Volume, By Yellowfin, 2021-2031F |
6.1.4 Belgium Canned Tuna Market Revenues & Volume, By Others, 2021-2031F |
6.2 Belgium Canned Tuna Market, By Distribution Channel |
6.2.1 Overview and Analysis |
6.2.2 Belgium Canned Tuna Market Revenues & Volume, By Hypermarket & Supermarket, 2021-2031F |
6.2.3 Belgium Canned Tuna Market Revenues & Volume, By Specialty Stores, 2021-2031F |
6.2.4 Belgium Canned Tuna Market Revenues & Volume, By Online, 2021-2031F |
7 Belgium Canned Tuna Market Import-Export Trade Statistics |
7.1 Belgium Canned Tuna Market Export to Major Countries |
7.2 Belgium Canned Tuna Market Imports from Major Countries |
8 Belgium Canned Tuna Market Key Performance Indicators |
8.1 Percentage growth in the consumption of canned tuna per capita. |
8.2 Number of new product launches in the canned tuna market. |
8.3 Retail penetration of canned tuna products in Belgium. |
9 Belgium Canned Tuna Market - Opportunity Assessment |
9.1 Belgium Canned Tuna Market Opportunity Assessment, By Product, 2021 & 2031F |
9.2 Belgium Canned Tuna Market Opportunity Assessment, By Distribution Channel, 2021 & 2031F |
10 Belgium Canned Tuna Market - Competitive Landscape |
10.1 Belgium Canned Tuna Market Revenue Share, By Companies, 2024 |
10.2 Belgium Canned Tuna Market Competitive Benchmarking, By Operating and Technical Parameters |
11 Company Profiles |
12 Recommendations | 13 Disclaimer |
Global Go To Market Strategy - 2030
Export potential enables firms to identify high-growth global markets with greater confidence by combining advanced trade intelligence with a structured quantitative methodology. The framework analyzes emerging demand trends and country-level import patterns while integrating macroeconomic and trade datasets such as GDP and population forecasts, bilateral import–export flows, tariff structures, elasticity differentials between developed and developing economies, geographic distance, and import demand projections. Using weighted trade values from 2020–2024 as the base period to project country-to-country export potential for 2030, these inputs are operationalized through calculated drivers such as gravity model parameters, tariff impact factors, and projected GDP per-capita growth. Through an analysis of hidden potentials, demand hotspots, and market conditions that are most favorable to success, this method enables firms to focus on target countries, maximize returns, and global expansion with data, backed by accuracy.
By factoring in the projected importer demand gap that is currently unmet and could be potential opportunity, it identifies the potential for the Exporter (Country) among 190 countries, against the general trade analysis, which identifies the biggest importer or exporter.
To discover high-growth global markets and optimize your business strategy:
Click Here
Pricing
- Single User License$ 1,995
- Department License$ 2,400
- Site License$ 3,120
- Global License$ 3,795

Leadership Perspectives from Industry Events
Search
Thought Leadership and Analyst Meet


Our Clients
6WResearch In News
- India Export Attractiveness Tracker 2026
- India Air Conditioner Market Set for Strong Rebound in 2026 After Weather-Led Correction and GST-Driven Recovery: 6Wresearch
- ADAS in India: How Automatic Emergency Braking, Blind Spot Detection & Driver Monitoring are Transforming Road Safety
- Doha a strategic location for EV manufacturing hub: IPA Qatar
- Demand for luxury TVs surging in the GCC, says Samsung
- Empowering Growth: The Thriving Journey of Bangladesh’s Cable Industry
Latest Reports
- Nicaragua RPG Gaming Market (2026-2032)
- New Zealand RPG Gaming Market (2026-2032)
- Netherlands RPG Gaming Market (2026-2032)
- Nauru RPG Gaming Market (2026-2032)
- Namibia RPG Gaming Market (2026-2032)
- Mozambique RPG Gaming Market (2026-2032)
- Montenegro RPG Gaming Market (2026-2032)
- Mongolia RPG Gaming Market (2026-2032)
- Monaco RPG Gaming Market (2026-2032)
- Micronesia RPG Gaming Market (2026-2032)
Industry Events and Analyst Meet

EV India Expo 2026

HIMTEX 2026

India Refining Summit 2026

India EV Show 2026

EV tech India Expo 2026
Whitepaper
- Middle East & Africa Commercial Security Market Click here to view more.
- Middle East & Africa Fire Safety Systems & Equipment Market Click here to view more.
- GCC Drone Market Click here to view more.
- Middle East Lighting Fixture Market Click here to view more.
- GCC Physical & Perimeter Security Market Click here to view more.