Belgium Copra Meal Market (2026-2032) | Value, Pricing Analysis, Demand, Strategic Insights, Competition, Forecast, Segments, Analysis, Challenges, Share, Consumer Insights, Segmentation, Growth, Companies, Drivers, Supply, Strategy, Restraints, Opportunities, Size, Revenue, Trends, Competitive, Outlook, Investment Trends, Industry
Market Forecast By Form (Pellets, Powder, Granules, Others), By Application (Animal Feed, Organic Fertilizer, Industrial Use, Others), By End User (Livestock, Agriculture, Biofuel, Others), By Processing Method (Mechanical Pressing, Solvent Extraction, Cold Pressing, Others), By Distribution Channel (Wholesale, Direct Sales, Distributors, Others) And Competitive Landscape
| Product Code: ETC11762242 | Publication Date: Apr 2025 | Updated Date: Apr 2026 | Product Type: Market Research Report | |
| Publisher: 6Wresearch | No. of Pages: 65 | No. of Figures: 34 | No. of Tables: 19 | |
Belgium Copra Meal Market Size (2020-2030)
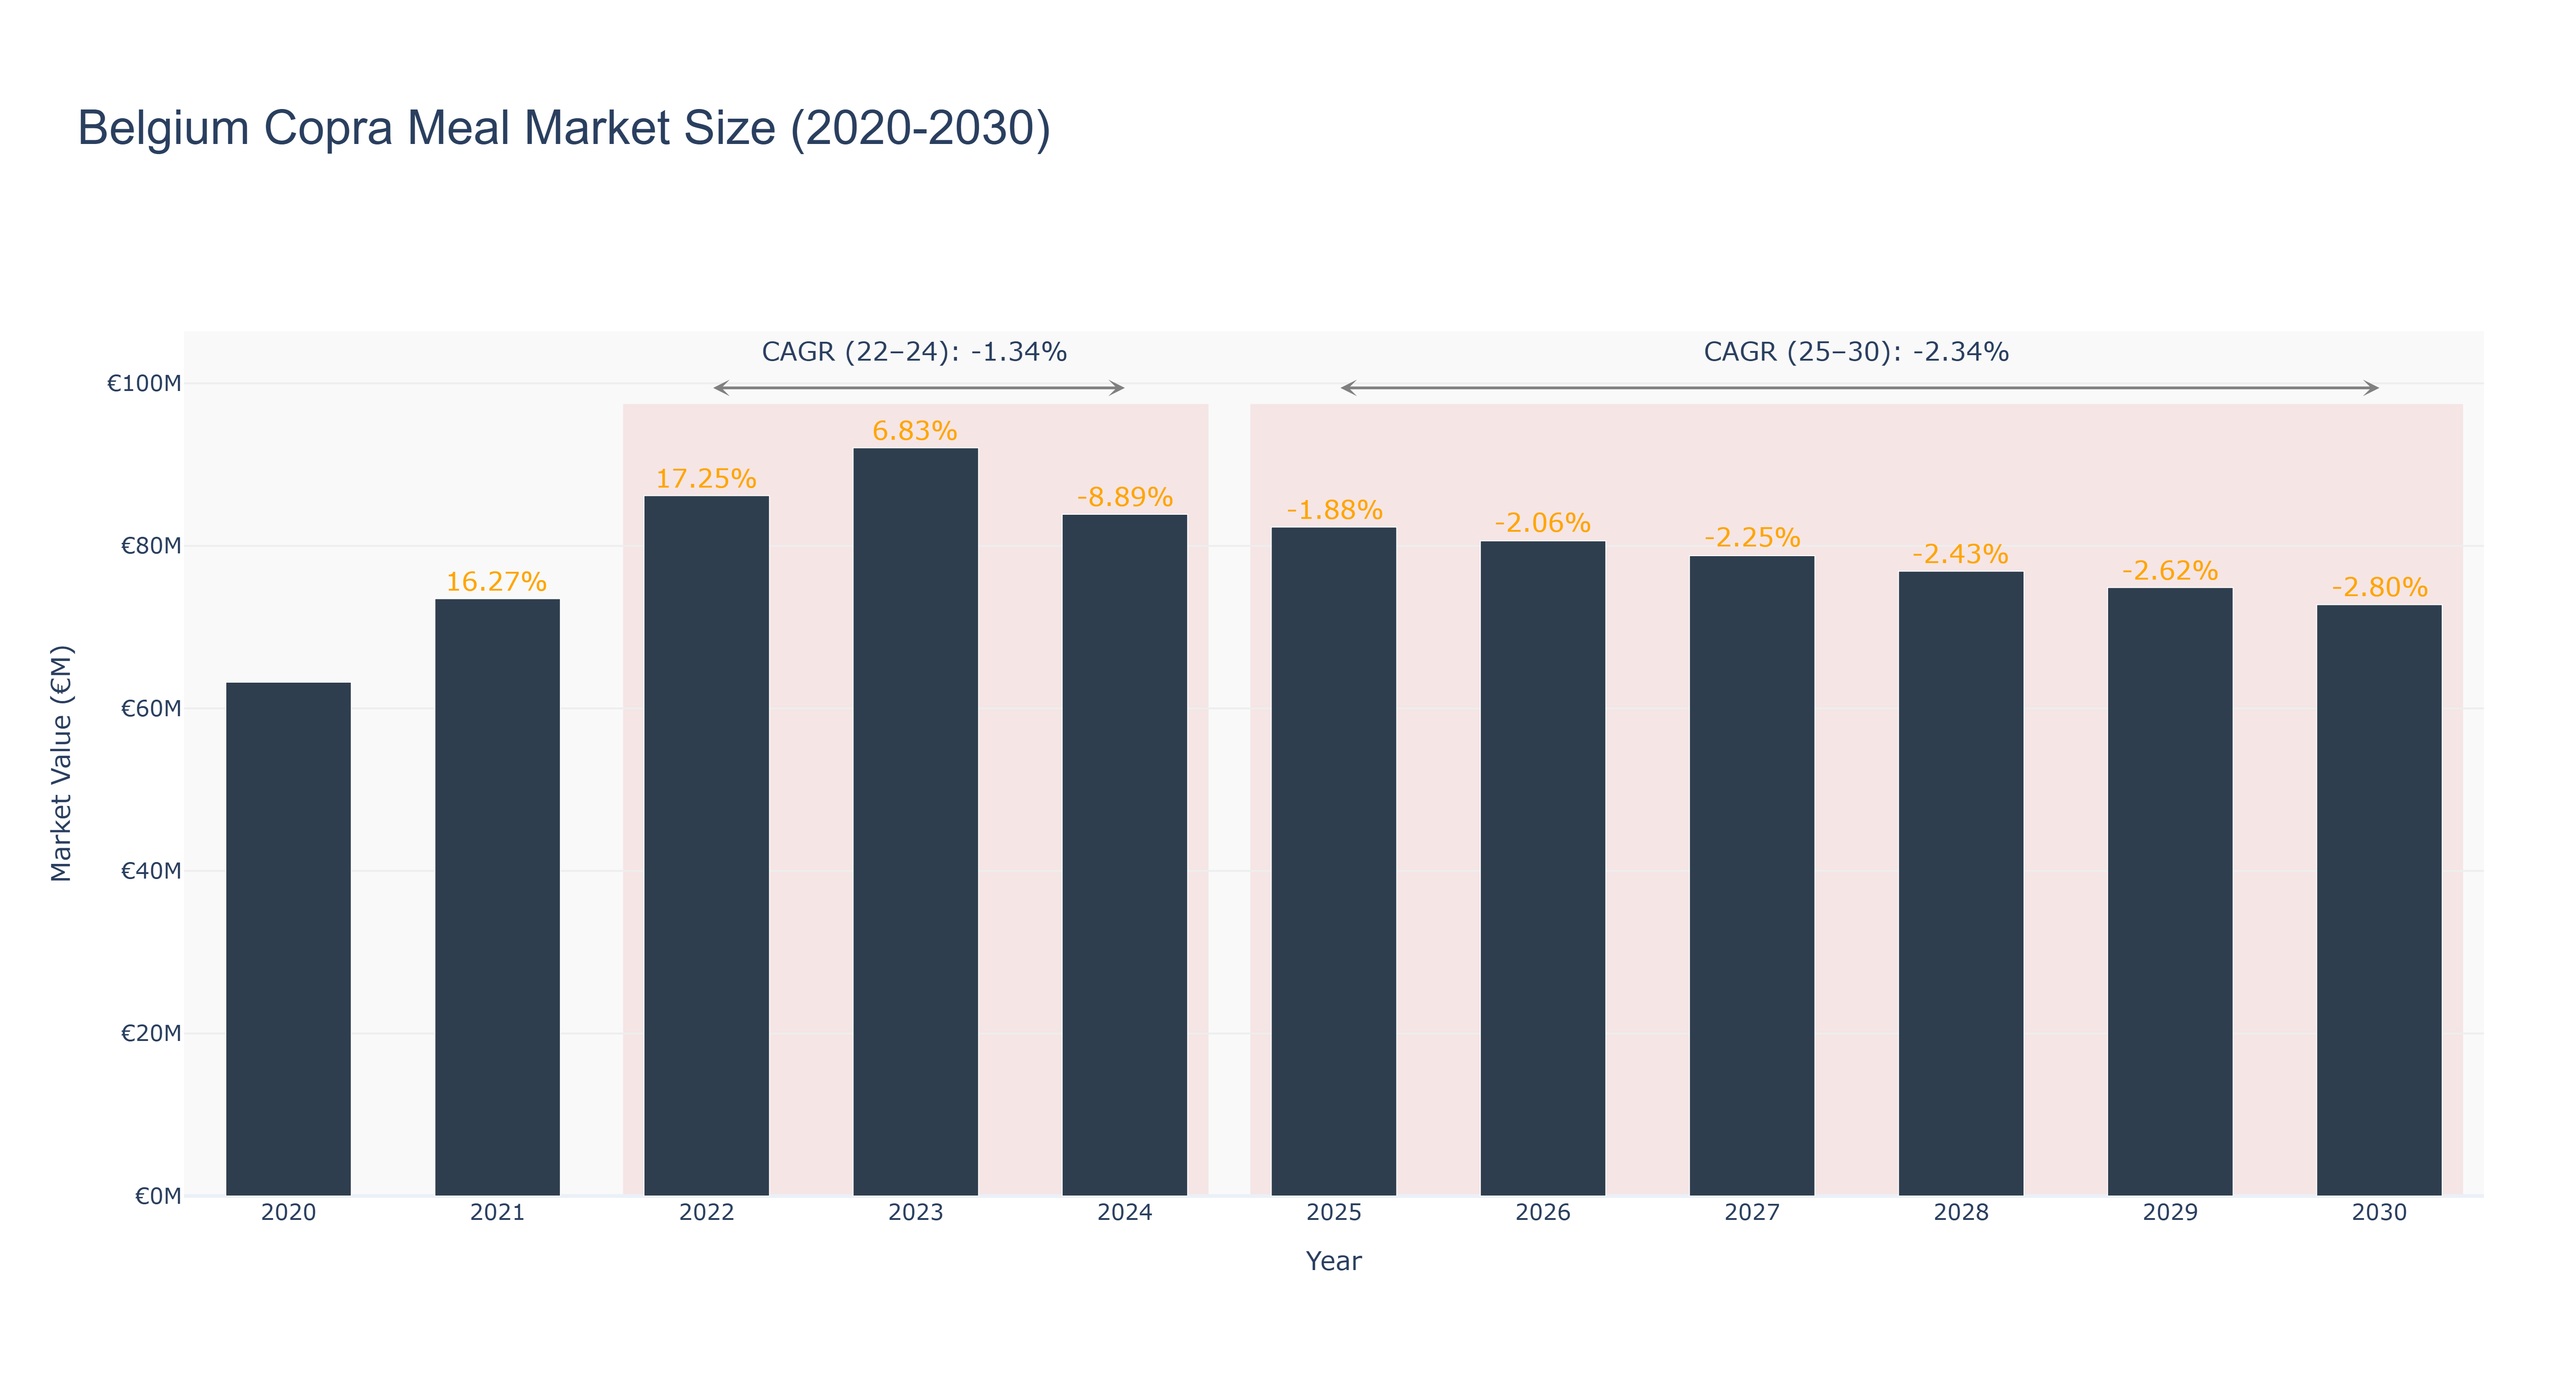
Belgium Copra Meal Market has shown a declining trend over the years. The peak market size of €92.07 million was recorded in 2023. From 2020 to 2024, the actual market size decreased steadily to €83.89 million due to factors such as changing consumer preferences and market saturation. Forecasted market size from 2025 to 2030 is expected to continue this downward trend, with a CAGR of -2.34%. The recent decline in market size can be attributed to the negative compound annual growth rate (CAGR) of -1.34% from 2022 to 2024, and further decline with a CAGR of -2.34% from 2025 to 2030. Looking ahead, the industry drivers for this market may include technological advancements in production processes and sustainable farming practices. Future developments could focus on enhancing product quality and expanding market reach through strategic partnerships with key stakeholders in the agriculture sector.
Belgium Copra Meal Market: Production & Trade Performance (2019-2025)
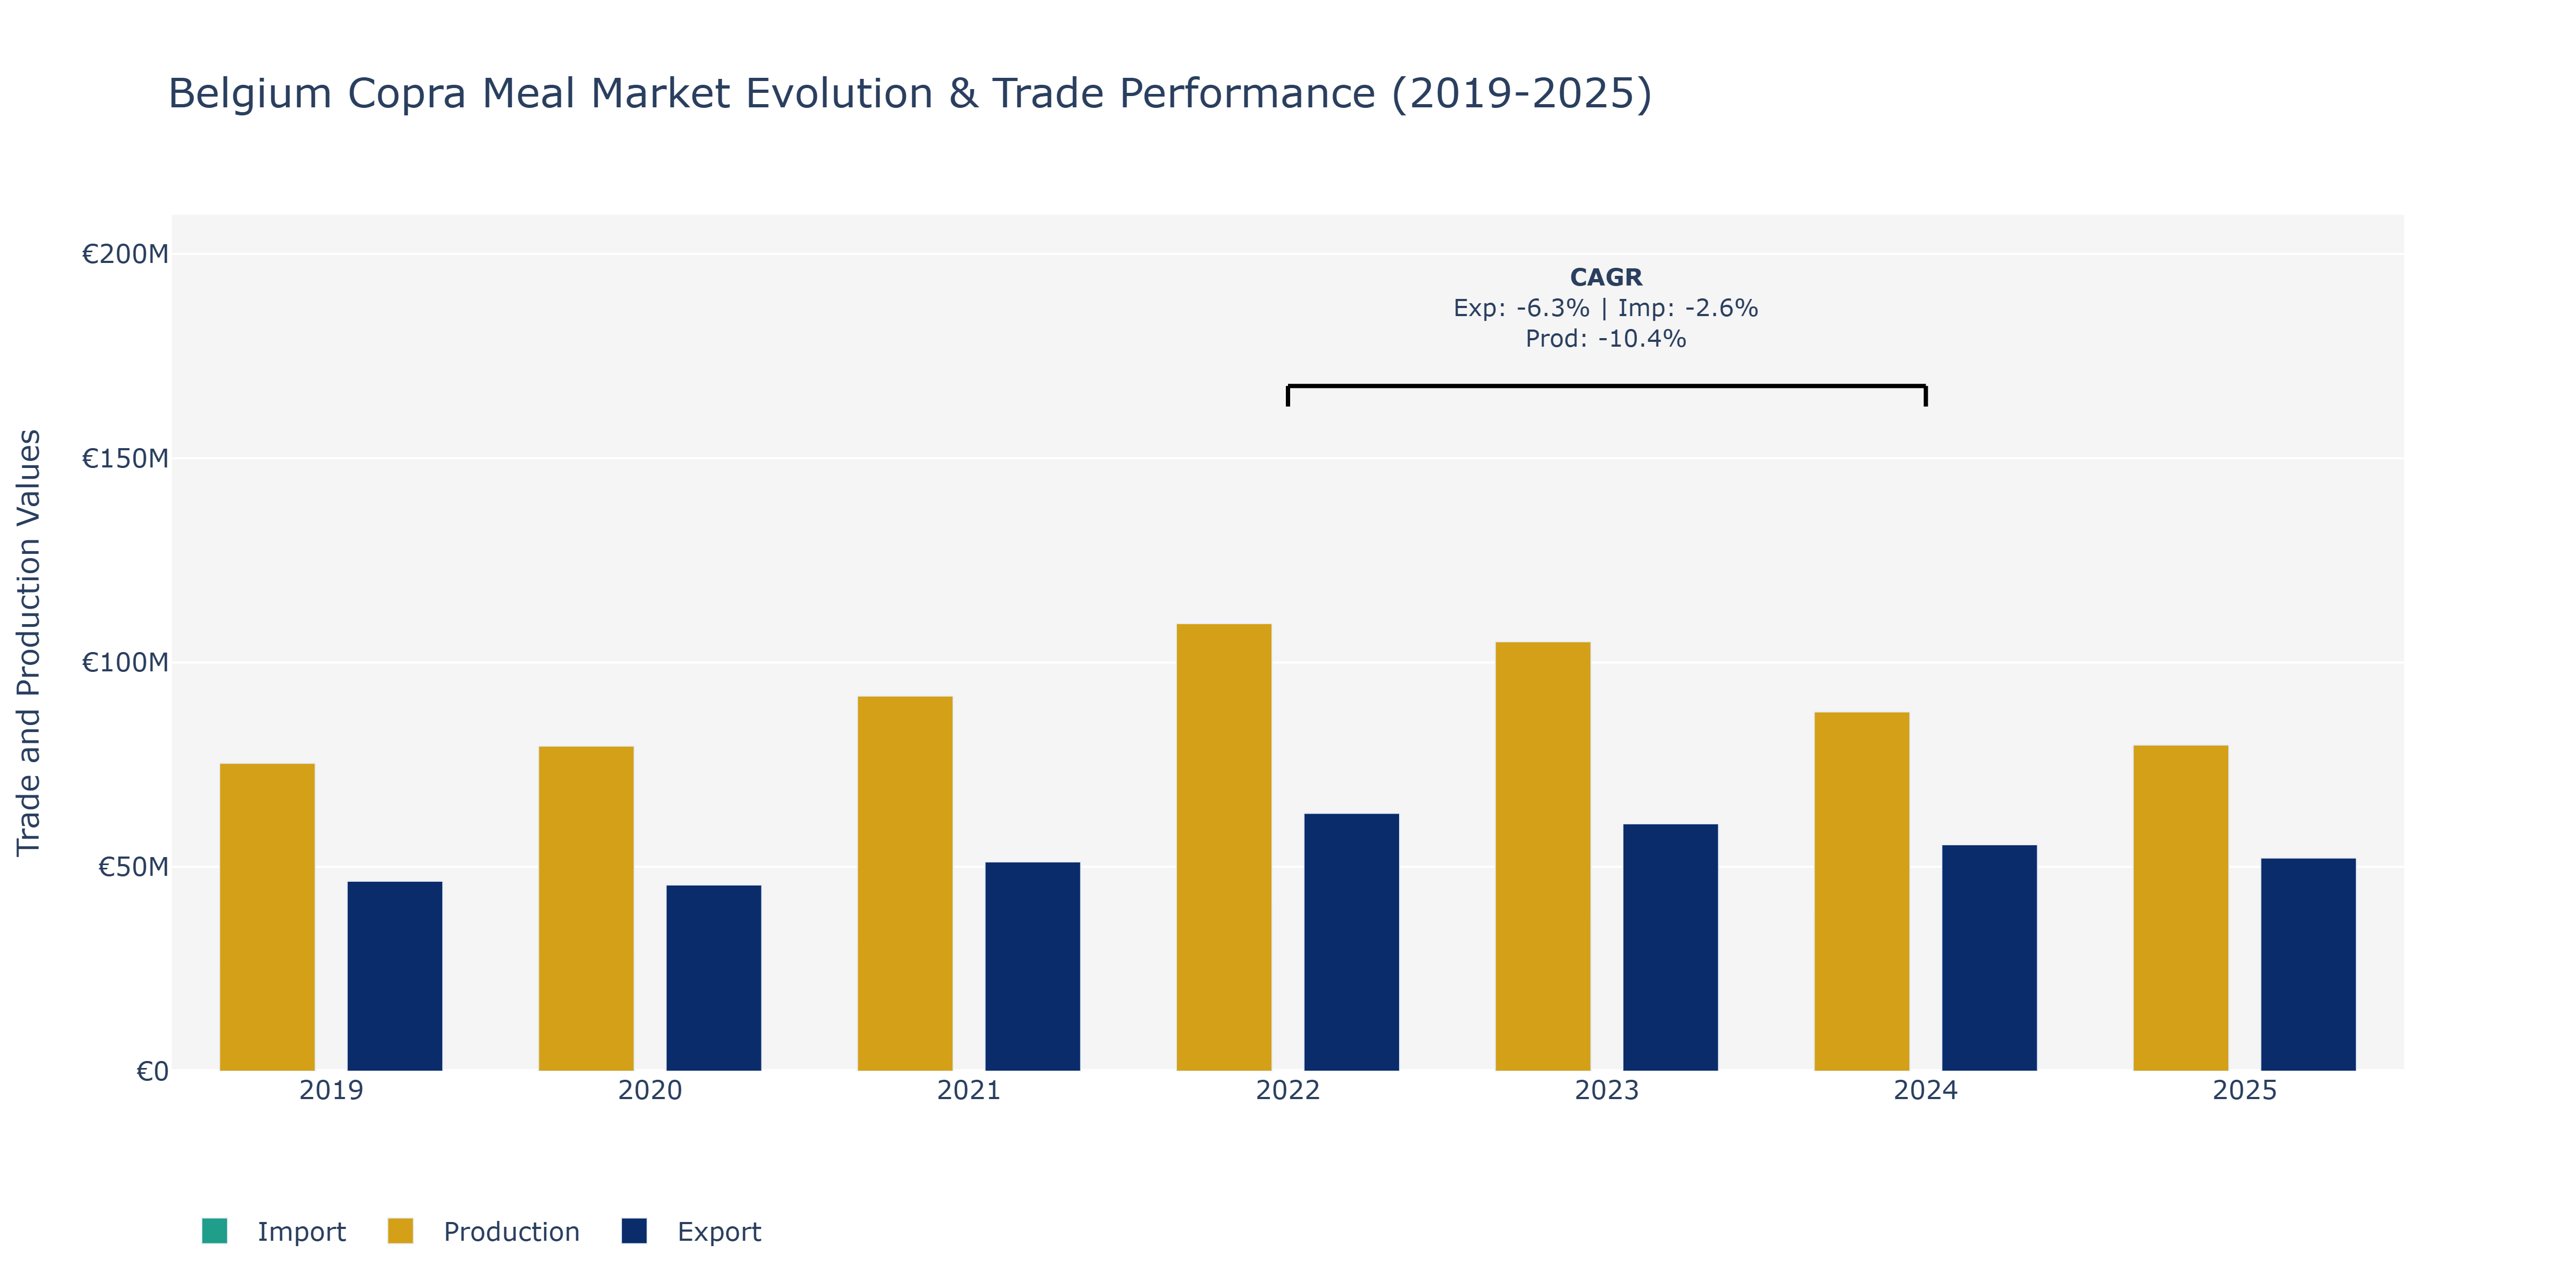
Between 2019 and 2025, the Belgium Copra Meal Market witnessed fluctuations in exports, imports, and production volumes. Exports started at €46.47 million in 2019, showing a downward trend until 2024, before slightly recovering in 2025 to €52.16 million. Imports followed a similar trajectory, starting at €23.57 million in 2019, peaking in 2020 at €29.42 million, and then gradually decreasing to €37.04 million in 2025. Production value displayed a different pattern, starting at €75.35 billion in 2019, experiencing steady growth until 2022, peaking at €109.53 billion, and declining thereafter to €79.81 billion in 2025. These fluctuations can be attributed to various factors such as changes in global demand, supply chain disruptions, and pricing dynamics. For instance, the decrease in exports and imports post-2022 could be linked to shifts in trade policies or evolving market preferences. Additionally, the decline in production post-2022 might be influenced by environmental challenges impacting crop yields or technological advancements altering production efficiencies in the copra meal market.
Key Highlights of the Report:
- Belgium Copra Meal Market Outlook
- Market Size of Belgium Copra Meal Market, 2025
- Forecast of Belgium Copra Meal Market, 2032
- Historical Data and Forecast of Belgium Copra Meal Revenues & Volume for the Period 2022 - 2032F
- Belgium Copra Meal Market Trend Evolution
- Belgium Copra Meal Market Drivers and Challenges
- Belgium Copra Meal Price Trends
- Belgium Copra Meal Porter's Five Forces
- Belgium Copra Meal Industry Life Cycle
- Historical Data and Forecast of Belgium Copra Meal Market Revenues & Volume By Form for the Period 2022 - 2032F
- Historical Data and Forecast of Belgium Copra Meal Market Revenues & Volume By Pellets for the Period 2022 - 2032F
- Historical Data and Forecast of Belgium Copra Meal Market Revenues & Volume By Powder for the Period 2022 - 2032F
- Historical Data and Forecast of Belgium Copra Meal Market Revenues & Volume By Granules for the Period 2022 - 2032F
- Historical Data and Forecast of Belgium Copra Meal Market Revenues & Volume By Others for the Period 2022 - 2032F
- Historical Data and Forecast of Belgium Copra Meal Market Revenues & Volume By Application for the Period 2022 - 2032F
- Historical Data and Forecast of Belgium Copra Meal Market Revenues & Volume By Animal Feed for the Period 2022 - 2032F
- Historical Data and Forecast of Belgium Copra Meal Market Revenues & Volume By Organic Fertilizer for the Period 2022 - 2032F
- Historical Data and Forecast of Belgium Copra Meal Market Revenues & Volume By Industrial Use for the Period 2022 - 2032F
- Historical Data and Forecast of Belgium Copra Meal Market Revenues & Volume By Others for the Period 2022 - 2032F
- Historical Data and Forecast of Belgium Copra Meal Market Revenues & Volume By End User for the Period 2022 - 2032F
- Historical Data and Forecast of Belgium Copra Meal Market Revenues & Volume By Livestock for the Period 2022 - 2032F
- Historical Data and Forecast of Belgium Copra Meal Market Revenues & Volume By Agriculture for the Period 2022 - 2032F
- Historical Data and Forecast of Belgium Copra Meal Market Revenues & Volume By Biofuel for the Period 2022 - 2032F
- Historical Data and Forecast of Belgium Copra Meal Market Revenues & Volume By Others for the Period 2022 - 2032F
- Historical Data and Forecast of Belgium Copra Meal Market Revenues & Volume By Processing Method for the Period 2022 - 2032F
- Historical Data and Forecast of Belgium Copra Meal Market Revenues & Volume By Mechanical Pressing for the Period 2022 - 2032F
- Historical Data and Forecast of Belgium Copra Meal Market Revenues & Volume By Solvent Extraction for the Period 2022 - 2032F
- Historical Data and Forecast of Belgium Copra Meal Market Revenues & Volume By Cold Pressing for the Period 2022 - 2032F
- Historical Data and Forecast of Belgium Copra Meal Market Revenues & Volume By Others for the Period 2022 - 2032F
- Historical Data and Forecast of Belgium Copra Meal Market Revenues & Volume By Distribution Channel for the Period 2022 - 2032F
- Historical Data and Forecast of Belgium Copra Meal Market Revenues & Volume By Wholesale for the Period 2022 - 2032F
- Historical Data and Forecast of Belgium Copra Meal Market Revenues & Volume By Direct Sales for the Period 2022 - 2032F
- Historical Data and Forecast of Belgium Copra Meal Market Revenues & Volume By Distributors for the Period 2022 - 2032F
- Historical Data and Forecast of Belgium Copra Meal Market Revenues & Volume By Others for the Period 2022 - 2032F
- Belgium Copra Meal Import Export Trade Statistics
- Market Opportunity Assessment By Form
- Market Opportunity Assessment By Application
- Market Opportunity Assessment By End User
- Market Opportunity Assessment By Processing Method
- Market Opportunity Assessment By Distribution Channel
- Belgium Copra Meal Top Companies Market Share
- Belgium Copra Meal Competitive Benchmarking By Technical and Operational Parameters
- Belgium Copra Meal Company Profiles
- Belgium Copra Meal Key Strategic Recommendations
Frequently Asked Questions About the Market Study (FAQs):
6Wresearch actively monitors the Belgium Copra Meal Market and publishes its comprehensive annual report, highlighting emerging trends, growth drivers, revenue analysis, and forecast outlook. Our insights help businesses to make data-backed strategic decisions with ongoing market dynamics. Our analysts track relevent industries related to the Belgium Copra Meal Market, allowing our clients with actionable intelligence and reliable forecasts tailored to emerging regional needs.
Yes, we provide customisation as per your requirements. To learn more, feel free to contact us on sales@6wresearch.com
1 Executive Summary |
2 Introduction |
2.1 Key Highlights of the Report |
2.2 Report Description |
2.3 Market Scope & Segmentation |
2.4 Research Methodology |
2.5 Assumptions |
3 Belgium Copra Meal Market Overview |
3.1 Belgium Country Macro Economic Indicators |
3.2 Belgium Copra Meal Market Revenues & Volume, 2022 & 2032F |
3.3 Belgium Copra Meal Market - Industry Life Cycle |
3.4 Belgium Copra Meal Market - Porter's Five Forces |
3.5 Belgium Copra Meal Market Revenues & Volume Share, By Form, 2022 & 2032F |
3.6 Belgium Copra Meal Market Revenues & Volume Share, By Application, 2022 & 2032F |
3.7 Belgium Copra Meal Market Revenues & Volume Share, By End User, 2022 & 2032F |
3.8 Belgium Copra Meal Market Revenues & Volume Share, By Processing Method, 2022 & 2032F |
3.9 Belgium Copra Meal Market Revenues & Volume Share, By Distribution Channel, 2022 & 2032F |
4 Belgium Copra Meal Market Dynamics |
4.1 Impact Analysis |
4.2 Market Drivers |
4.2.1 Increasing demand for animal feed ingredients due to growth in the livestock industry in Belgium |
4.2.2 Rising awareness about the nutritional benefits of copra meal for livestock |
4.2.3 Growing trend towards organic and sustainable feed ingredients in the agriculture sector |
4.3 Market Restraints |
4.3.1 Fluctuating prices of copra meal influenced by global supply and demand dynamics |
4.3.2 Competition from alternative feed ingredients in the market |
4.3.3 Regulatory challenges related to import/export of copra meal and compliance with quality standards |
5 Belgium Copra Meal Market Trends |
6 Belgium Copra Meal Market, By Types |
6.1 Belgium Copra Meal Market, By Form |
6.1.1 Overview and Analysis |
6.1.2 Belgium Copra Meal Market Revenues & Volume, By Form, 2022 - 2032F |
6.1.3 Belgium Copra Meal Market Revenues & Volume, By Pellets, 2022 - 2032F |
6.1.4 Belgium Copra Meal Market Revenues & Volume, By Powder, 2022 - 2032F |
6.1.5 Belgium Copra Meal Market Revenues & Volume, By Granules, 2022 - 2032F |
6.1.6 Belgium Copra Meal Market Revenues & Volume, By Others, 2022 - 2032F |
6.2 Belgium Copra Meal Market, By Application |
6.2.1 Overview and Analysis |
6.2.2 Belgium Copra Meal Market Revenues & Volume, By Animal Feed, 2022 - 2032F |
6.2.3 Belgium Copra Meal Market Revenues & Volume, By Organic Fertilizer, 2022 - 2032F |
6.2.4 Belgium Copra Meal Market Revenues & Volume, By Industrial Use, 2022 - 2032F |
6.2.5 Belgium Copra Meal Market Revenues & Volume, By Others, 2022 - 2032F |
6.3 Belgium Copra Meal Market, By End User |
6.3.1 Overview and Analysis |
6.3.2 Belgium Copra Meal Market Revenues & Volume, By Livestock, 2022 - 2032F |
6.3.3 Belgium Copra Meal Market Revenues & Volume, By Agriculture, 2022 - 2032F |
6.3.4 Belgium Copra Meal Market Revenues & Volume, By Biofuel, 2022 - 2032F |
6.3.5 Belgium Copra Meal Market Revenues & Volume, By Others, 2022 - 2032F |
6.4 Belgium Copra Meal Market, By Processing Method |
6.4.1 Overview and Analysis |
6.4.2 Belgium Copra Meal Market Revenues & Volume, By Mechanical Pressing, 2022 - 2032F |
6.4.3 Belgium Copra Meal Market Revenues & Volume, By Solvent Extraction, 2022 - 2032F |
6.4.4 Belgium Copra Meal Market Revenues & Volume, By Cold Pressing, 2022 - 2032F |
6.4.5 Belgium Copra Meal Market Revenues & Volume, By Others, 2022 - 2032F |
6.5 Belgium Copra Meal Market, By Distribution Channel |
6.5.1 Overview and Analysis |
6.5.2 Belgium Copra Meal Market Revenues & Volume, By Wholesale, 2022 - 2032F |
6.5.3 Belgium Copra Meal Market Revenues & Volume, By Direct Sales, 2022 - 2032F |
6.5.4 Belgium Copra Meal Market Revenues & Volume, By Distributors, 2022 - 2032F |
6.5.5 Belgium Copra Meal Market Revenues & Volume, By Others, 2022 - 2032F |
7 Belgium Copra Meal Market Import-Export Trade Statistics |
7.1 Belgium Copra Meal Market Export to Major Countries |
7.2 Belgium Copra Meal Market Imports from Major Countries |
8 Belgium Copra Meal Market Key Performance Indicators |
8.1 Average selling price of copra meal in Belgium |
8.2 Percentage of livestock farmers using copra meal in their feed formulations |
8.3 Growth rate of organic livestock farming practices in Belgium using copra meal as a feed ingredient |
9 Belgium Copra Meal Market - Opportunity Assessment |
9.1 Belgium Copra Meal Market Opportunity Assessment, By Form, 2022 & 2032F |
9.2 Belgium Copra Meal Market Opportunity Assessment, By Application, 2022 & 2032F |
9.3 Belgium Copra Meal Market Opportunity Assessment, By End User, 2022 & 2032F |
9.4 Belgium Copra Meal Market Opportunity Assessment, By Processing Method, 2022 & 2032F |
9.5 Belgium Copra Meal Market Opportunity Assessment, By Distribution Channel, 2022 & 2032F |
10 Belgium Copra Meal Market - Competitive Landscape |
10.1 Belgium Copra Meal Market Revenue Share, By Companies, 2025 |
10.2 Belgium Copra Meal Market Competitive Benchmarking, By Operating and Technical Parameters |
11 Company Profiles |
12 Recommendations |
13 Disclaimer |
Global Go To Market Strategy - 2030
Export potential enables firms to identify high-growth global markets with greater confidence by combining advanced trade intelligence with a structured quantitative methodology. The framework analyzes emerging demand trends and country-level import patterns while integrating macroeconomic and trade datasets such as GDP and population forecasts, bilateral import–export flows, tariff structures, elasticity differentials between developed and developing economies, geographic distance, and import demand projections. Using weighted trade values from 2020–2024 as the base period to project country-to-country export potential for 2030, these inputs are operationalized through calculated drivers such as gravity model parameters, tariff impact factors, and projected GDP per-capita growth. Through an analysis of hidden potentials, demand hotspots, and market conditions that are most favorable to success, this method enables firms to focus on target countries, maximize returns, and global expansion with data, backed by accuracy.
By factoring in the projected importer demand gap that is currently unmet and could be potential opportunity, it identifies the potential for the Exporter (Country) among 190 countries, against the general trade analysis, which identifies the biggest importer or exporter.
To discover high-growth global markets and optimize your business strategy:
Click Here
Pricing
- Single User License$ 1,995
- Department License$ 2,400
- Site License$ 3,120
- Global License$ 3,795

Leadership Perspectives from Industry Events
Search
Thought Leadership and Analyst Meet


Our Clients
6WResearch In News
- India Export Attractiveness Tracker 2026
- India Air Conditioner Market Set for Strong Rebound in 2026 After Weather-Led Correction and GST-Driven Recovery: 6Wresearch
- ADAS in India: How Automatic Emergency Braking, Blind Spot Detection & Driver Monitoring are Transforming Road Safety
- Doha a strategic location for EV manufacturing hub: IPA Qatar
- Demand for luxury TVs surging in the GCC, says Samsung
- Empowering Growth: The Thriving Journey of Bangladesh’s Cable Industry
Latest Reports
- Nicaragua RPG Gaming Market (2026-2032)
- New Zealand RPG Gaming Market (2026-2032)
- Netherlands RPG Gaming Market (2026-2032)
- Nauru RPG Gaming Market (2026-2032)
- Namibia RPG Gaming Market (2026-2032)
- Mozambique RPG Gaming Market (2026-2032)
- Montenegro RPG Gaming Market (2026-2032)
- Mongolia RPG Gaming Market (2026-2032)
- Monaco RPG Gaming Market (2026-2032)
- Micronesia RPG Gaming Market (2026-2032)
Industry Events and Analyst Meet

EV India Expo 2026

HIMTEX 2026

India Refining Summit 2026

India EV Show 2026

EV tech India Expo 2026
Whitepaper
- Middle East & Africa Commercial Security Market Click here to view more.
- Middle East & Africa Fire Safety Systems & Equipment Market Click here to view more.
- GCC Drone Market Click here to view more.
- Middle East Lighting Fixture Market Click here to view more.
- GCC Physical & Perimeter Security Market Click here to view more.