Belgium Over the Counter (OTC) Braces Market (2026-2032) | Analysis, Forecast, Industry, Value, Share, Growth, Size & Revenue, Companies, Outlook, Competitive Landscape, Segmentation, Trends
Market Forecast By Product (Knee Braces, Ankle Braces, Foot Walkers and Orthoses, Shoulder Braces, Elbow Braces, Hand and Wrist Braces, Facial Braces), By Indication (Osteoarthritis, Injury, Prophylactic, Others), By Type (Soft and Elastic Braces, Hard and Rigid Braces, Hinged Braces), By Application (Ligament Injury Repair, Preventive Care, Post-Operative Rehabilitation, Osteoarthritis, Compression Therapy, Others), By Distribution Channel (Pharmacies and Retailers, E-Commerce, Orthopedic Clinics), By End User (Hospitals, Home Healthcare, Others) And Competitive Landscape
| Product Code: ETC6360349 | Publication Date: Sep 2024 | Updated Date: Apr 2026 | Product Type: Market Research Report | |
| Publisher: 6Wresearch | Author: Dhaval Chaurasia | No. of Pages: 75 | No. of Figures: 35 | No. of Tables: 20 |
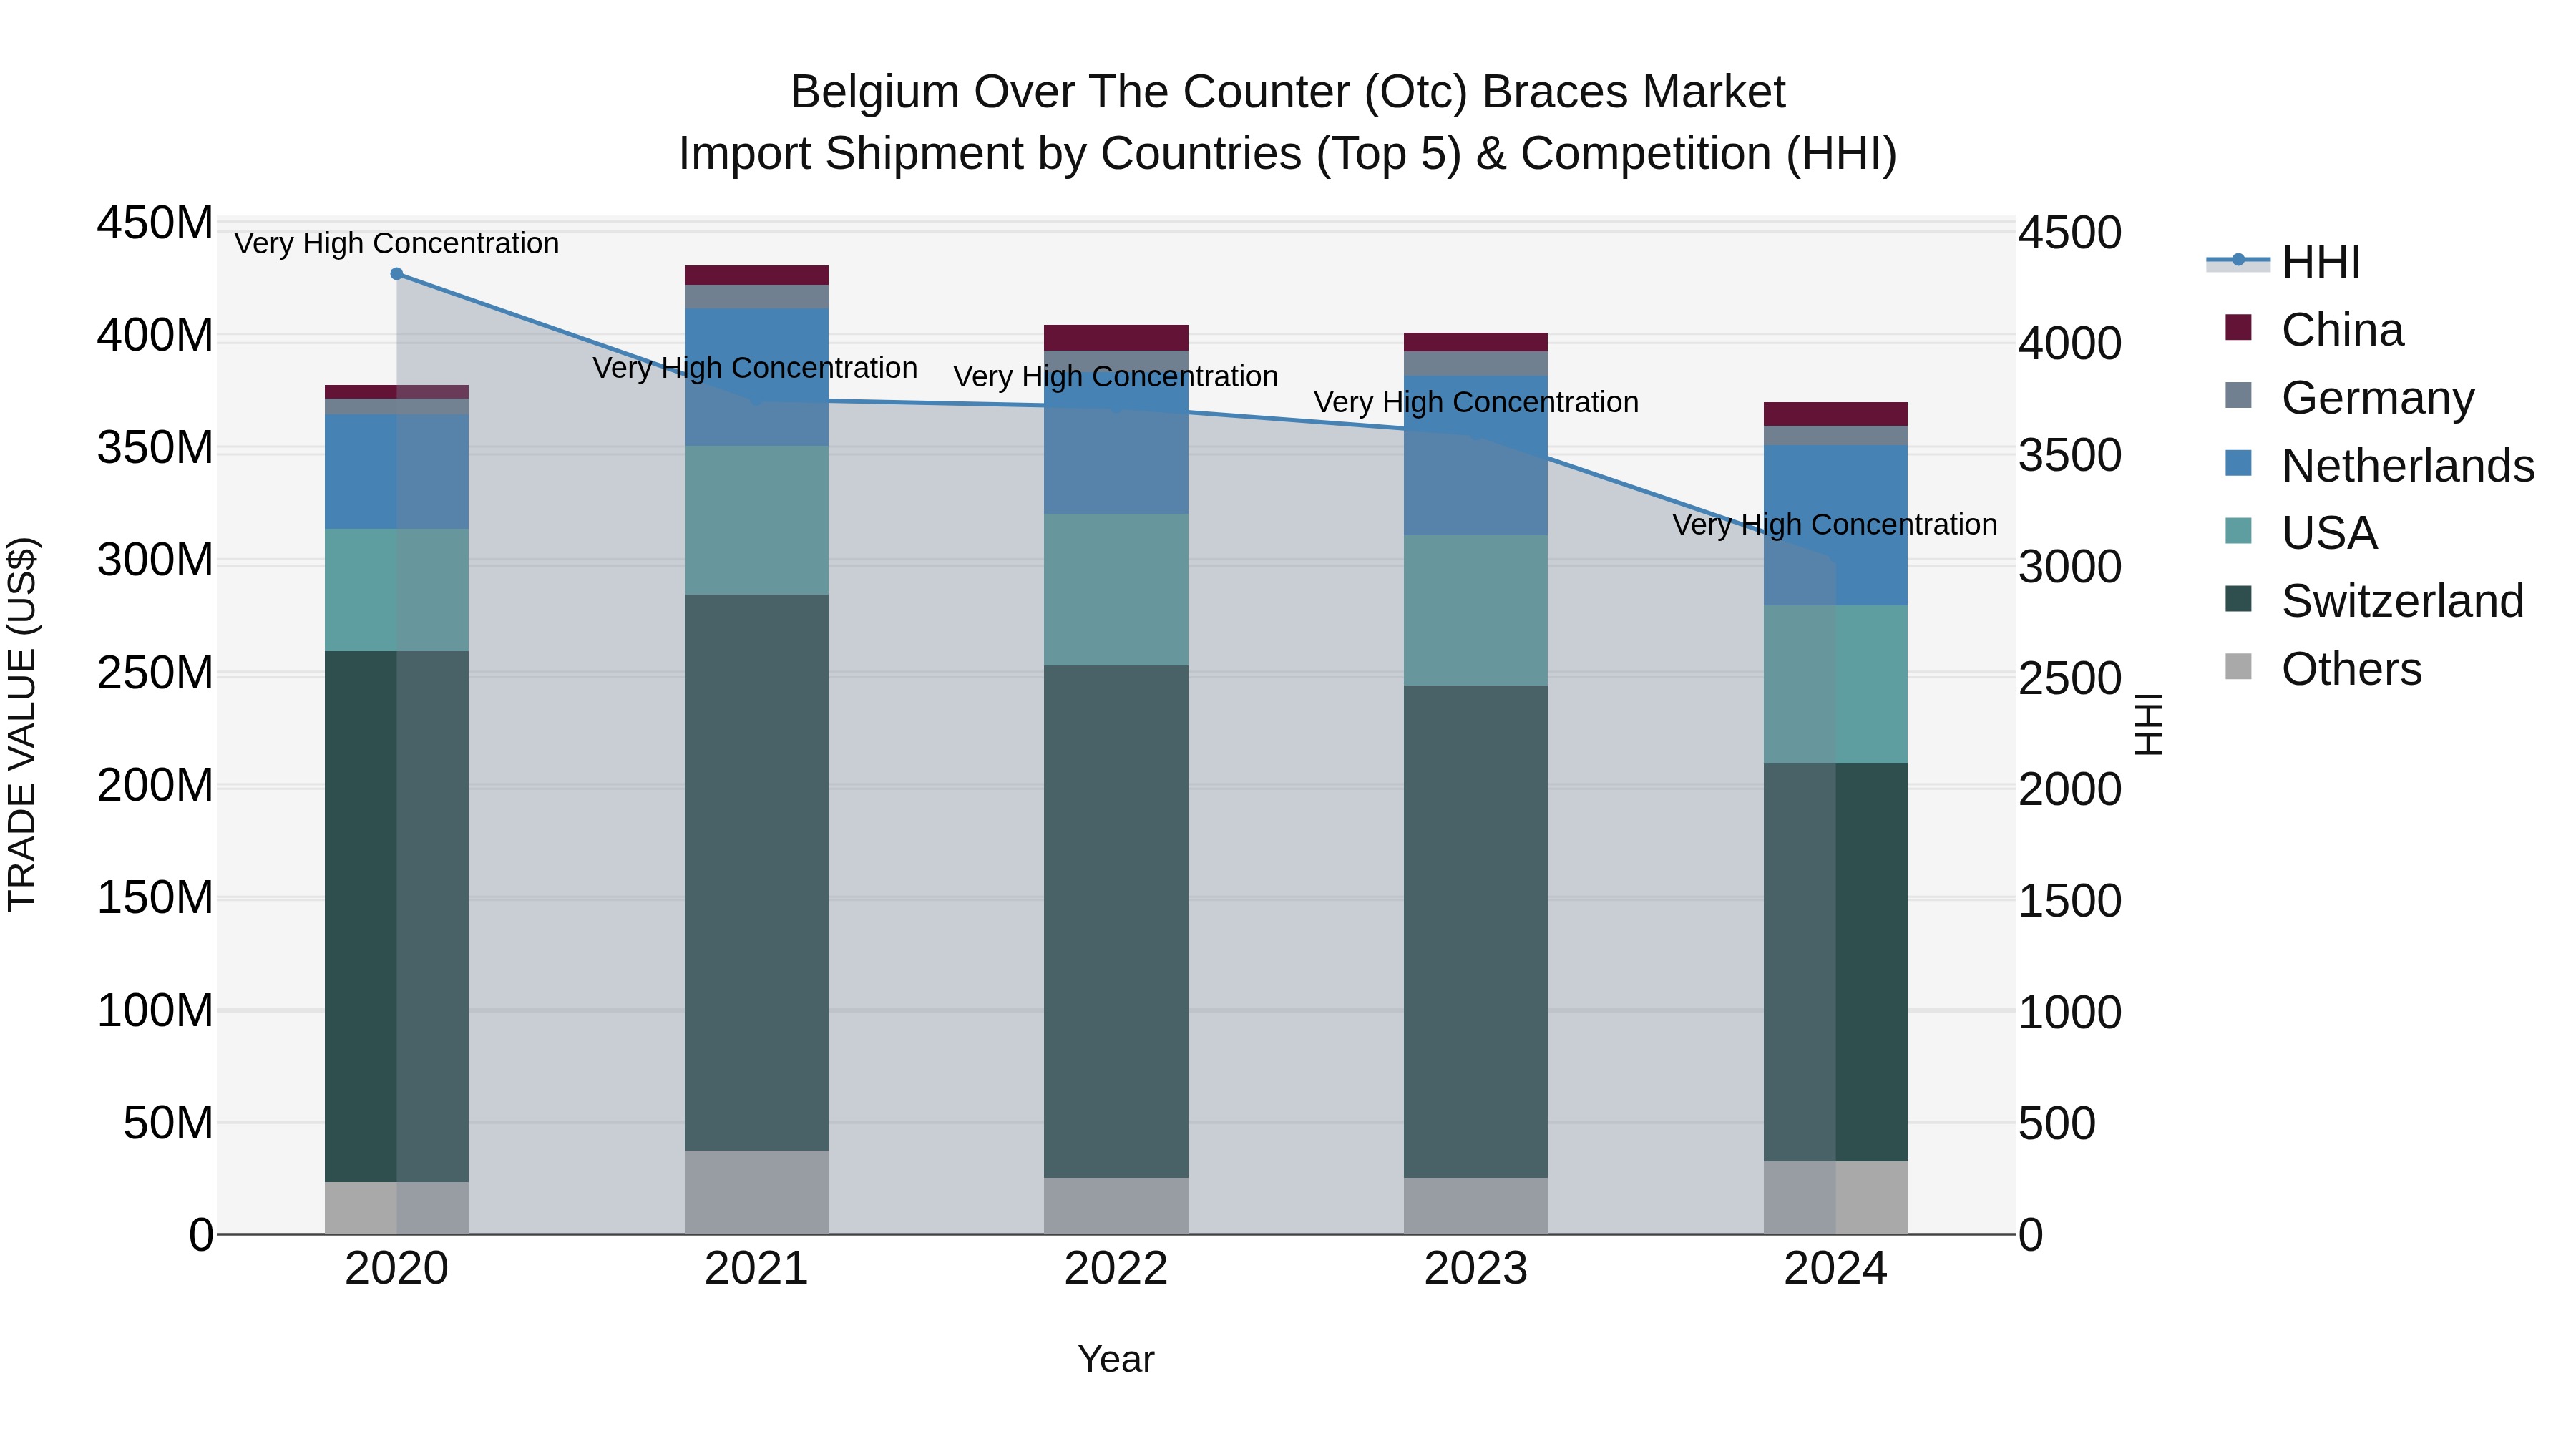
Belgium Over the Counter (Otc) Braces Market Top 5 Importing Countries and Market Competition (HHI) Analysis
Despite a decline in the growth rate from 2023 to 2024, Belgium`s import shipments of OTC braces continued to be dominated by top exporting countries including Switzerland, Netherlands, USA, Mexico, and China. The high Herfindahl-Hirschman Index (HHI) concentration in 2024 indicates a market with significant barriers to entry. The negative compound annual growth rate (CAGR) from 2020 to 2024 suggests a challenging market environment for OTC braces in Belgium. It will be interesting to monitor how these trends evolve in the coming years and whether there will be any shifts in the competitive landscape.
Key Highlights of the Report:
- Belgium Over the Counter (OTC) Braces Market Outlook
- Market Size of Belgium Over the Counter (OTC) Braces Market, 2025
- Forecast of Belgium Over the Counter (OTC) Braces Market, 2032
- Historical Data and Forecast of Belgium Over the Counter (OTC) Braces Revenues & Volume for the Period 2022 - 2032
- Belgium Over the Counter (OTC) Braces Market Trend Evolution
- Belgium Over the Counter (OTC) Braces Market Drivers and Challenges
- Belgium Over the Counter (OTC) Braces Price Trends
- Belgium Over the Counter (OTC) Braces Porter's Five Forces
- Belgium Over the Counter (OTC) Braces Industry Life Cycle
- Historical Data and Forecast of Belgium Over the Counter (OTC) Braces Market Revenues & Volume By Product for the Period 2022 - 2032
- Historical Data and Forecast of Belgium Over the Counter (OTC) Braces Market Revenues & Volume By Knee Braces for the Period 2022 - 2032
- Historical Data and Forecast of Belgium Over the Counter (OTC) Braces Market Revenues & Volume By Ankle Braces for the Period 2022 - 2032
- Historical Data and Forecast of Belgium Over the Counter (OTC) Braces Market Revenues & Volume By Foot Walkers and Orthoses for the Period 2022 - 2032
- Historical Data and Forecast of Belgium Over the Counter (OTC) Braces Market Revenues & Volume By Shoulder Braces for the Period 2022 - 2032
- Historical Data and Forecast of Belgium Over the Counter (OTC) Braces Market Revenues & Volume By Elbow Braces for the Period 2022 - 2032
- Historical Data and Forecast of Belgium Over the Counter (OTC) Braces Market Revenues & Volume By Hand and Wrist Braces for the Period 2022 - 2032
- Historical Data and Forecast of Belgium Over the Counter (OTC) Braces Market Revenues & Volume By Facial Braces for the Period 2022 - 2032
- Historical Data and Forecast of Belgium Over the Counter (OTC) Braces Market Revenues & Volume By Indication for the Period 2022 - 2032
- Historical Data and Forecast of Belgium Over the Counter (OTC) Braces Market Revenues & Volume By Osteoarthritis for the Period 2022 - 2032
- Historical Data and Forecast of Belgium Over the Counter (OTC) Braces Market Revenues & Volume By Injury for the Period 2022 - 2032
- Historical Data and Forecast of Belgium Over the Counter (OTC) Braces Market Revenues & Volume By Prophylactic for the Period 2022 - 2032
- Historical Data and Forecast of Belgium Over the Counter (OTC) Braces Market Revenues & Volume By Others for the Period 2022 - 2032
- Historical Data and Forecast of Belgium Over the Counter (OTC) Braces Market Revenues & Volume By Type for the Period 2022 - 2032
- Historical Data and Forecast of Belgium Over the Counter (OTC) Braces Market Revenues & Volume By Soft and Elastic Braces for the Period 2022 - 2032
- Historical Data and Forecast of Belgium Over the Counter (OTC) Braces Market Revenues & Volume By Hard and Rigid Braces for the Period 2022 - 2032
- Historical Data and Forecast of Belgium Over the Counter (OTC) Braces Market Revenues & Volume By Hinged Braces for the Period 2022 - 2032
- Historical Data and Forecast of Belgium Over the Counter (OTC) Braces Market Revenues & Volume By Application for the Period 2022 - 2032
- Historical Data and Forecast of Belgium Over the Counter (OTC) Braces Market Revenues & Volume By Ligament Injury Repair for the Period 2022 - 2032
- Historical Data and Forecast of Belgium Over the Counter (OTC) Braces Market Revenues & Volume By Preventive Care for the Period 2022 - 2032
- Historical Data and Forecast of Belgium Over the Counter (OTC) Braces Market Revenues & Volume By Post-Operative Rehabilitation for the Period 2022 - 2032
- Historical Data and Forecast of Belgium Over the Counter (OTC) Braces Market Revenues & Volume By Osteoarthritis for the Period 2022 - 2032
- Historical Data and Forecast of Belgium Over the Counter (OTC) Braces Market Revenues & Volume By Compression Therapy for the Period 2022 - 2032
- Historical Data and Forecast of Belgium Over the Counter (OTC) Braces Market Revenues & Volume By Others for the Period 2022 - 2032
- Historical Data and Forecast of Belgium Over the Counter (OTC) Braces Market Revenues & Volume By Distribution Channel for the Period 2022 - 2032
- Historical Data and Forecast of Belgium Over the Counter (OTC) Braces Market Revenues & Volume By Pharmacies and Retailers for the Period 2022 - 2032
- Historical Data and Forecast of Belgium Over the Counter (OTC) Braces Market Revenues & Volume By E-Commerce for the Period 2022 - 2032
- Historical Data and Forecast of Belgium Over the Counter (OTC) Braces Market Revenues & Volume By Orthopedic Clinics for the Period 2022 - 2032
- Historical Data and Forecast of Belgium Over the Counter (OTC) Braces Market Revenues & Volume By End User for the Period 2022 - 2032
- Historical Data and Forecast of Belgium Over the Counter (OTC) Braces Market Revenues & Volume By Hospitals for the Period 2022 - 2032
- Historical Data and Forecast of Belgium Over the Counter (OTC) Braces Market Revenues & Volume By Home Healthcare for the Period 2022 - 2032
- Historical Data and Forecast of Belgium Over the Counter (OTC) Braces Market Revenues & Volume By Others for the Period 2022 - 2032
- Belgium Over the Counter (OTC) Braces Import Export Trade Statistics
- Market Opportunity Assessment By Product
- Market Opportunity Assessment By Indication
- Market Opportunity Assessment By Type
- Market Opportunity Assessment By Application
- Market Opportunity Assessment By Distribution Channel
- Market Opportunity Assessment By End User
- Belgium Over the Counter (OTC) Braces Top Companies Market Share
- Belgium Over the Counter (OTC) Braces Competitive Benchmarking By Technical and Operational Parameters
- Belgium Over the Counter (OTC) Braces Company Profiles
- Belgium Over the Counter (OTC) Braces Key Strategic Recommendations
Frequently Asked Questions About the Market Study (FAQs):
6Wresearch actively monitors the Belgium Over the Counter (OTC) Braces Market and publishes its comprehensive annual report, highlighting emerging trends, growth drivers, revenue analysis, and forecast outlook. Our insights help businesses to make data-backed strategic decisions with ongoing market dynamics. Our analysts track relevent industries related to the Belgium Over the Counter (OTC) Braces Market, allowing our clients with actionable intelligence and reliable forecasts tailored to emerging regional needs.
Yes, we provide customisation as per your requirements. To learn more, feel free to contact us on sales@6wresearch.com
1 Executive Summary |
2 Introduction |
2.1 Key Highlights of the Report |
2.2 Report Description |
2.3 Market Scope & Segmentation |
2.4 Research Methodology |
2.5 Assumptions |
3 Belgium Over the Counter (OTC) Braces Market Overview |
3.1 Belgium Country Macro Economic Indicators |
3.2 Belgium Over the Counter (OTC) Braces Market Revenues & Volume, 2022 & 2032F |
3.3 Belgium Over the Counter (OTC) Braces Market - Industry Life Cycle |
3.4 Belgium Over the Counter (OTC) Braces Market - Porter's Five Forces |
3.5 Belgium Over the Counter (OTC) Braces Market Revenues & Volume Share, By Product, 2022 & 2032F |
3.6 Belgium Over the Counter (OTC) Braces Market Revenues & Volume Share, By Indication, 2022 & 2032F |
3.7 Belgium Over the Counter (OTC) Braces Market Revenues & Volume Share, By Type, 2022 & 2032F |
3.8 Belgium Over the Counter (OTC) Braces Market Revenues & Volume Share, By Application, 2022 & 2032F |
3.9 Belgium Over the Counter (OTC) Braces Market Revenues & Volume Share, By Distribution Channel, 2022 & 2032F |
3.10 Belgium Over the Counter (OTC) Braces Market Revenues & Volume Share, By End User, 2022 & 2032F |
4 Belgium Over the Counter (OTC) Braces Market Dynamics |
4.1 Impact Analysis |
4.2 Market Drivers |
4.2.1 Increasing awareness about the benefits of using braces for orthopedic support. |
4.2.2 Growing prevalence of sports-related injuries leading to the demand for OTC braces. |
4.2.3 Technological advancements leading to the development of more comfortable and effective OTC braces. |
4.3 Market Restraints |
4.3.1 High cost associated with some advanced OTC braces limiting affordability for certain consumer segments. |
4.3.2 Limited reimbursement policies for OTC braces affecting market penetration. |
4.3.3 Competition from alternative therapies and products such as pain relief medications and physical therapy. |
5 Belgium Over the Counter (OTC) Braces Market Trends |
6 Belgium Over the Counter (OTC) Braces Market, By Types |
6.1 Belgium Over the Counter (OTC) Braces Market, By Product |
6.1.1 Overview and Analysis |
6.1.2 Belgium Over the Counter (OTC) Braces Market Revenues & Volume, By Product, 2022 - 2032F |
6.1.3 Belgium Over the Counter (OTC) Braces Market Revenues & Volume, By Knee Braces, 2022 - 2032F |
6.1.4 Belgium Over the Counter (OTC) Braces Market Revenues & Volume, By Ankle Braces, 2022 - 2032F |
6.1.5 Belgium Over the Counter (OTC) Braces Market Revenues & Volume, By Foot Walkers and Orthoses, 2022 - 2032F |
6.1.6 Belgium Over the Counter (OTC) Braces Market Revenues & Volume, By Shoulder Braces, 2022 - 2032F |
6.1.7 Belgium Over the Counter (OTC) Braces Market Revenues & Volume, By Elbow Braces, 2022 - 2032F |
6.1.8 Belgium Over the Counter (OTC) Braces Market Revenues & Volume, By Hand and Wrist Braces, 2022 - 2032F |
6.2 Belgium Over the Counter (OTC) Braces Market, By Indication |
6.2.1 Overview and Analysis |
6.2.2 Belgium Over the Counter (OTC) Braces Market Revenues & Volume, By Osteoarthritis, 2022 - 2032F |
6.2.3 Belgium Over the Counter (OTC) Braces Market Revenues & Volume, By Injury, 2022 - 2032F |
6.2.4 Belgium Over the Counter (OTC) Braces Market Revenues & Volume, By Prophylactic, 2022 - 2032F |
6.2.5 Belgium Over the Counter (OTC) Braces Market Revenues & Volume, By Others, 2022 - 2032F |
6.3 Belgium Over the Counter (OTC) Braces Market, By Type |
6.3.1 Overview and Analysis |
6.3.2 Belgium Over the Counter (OTC) Braces Market Revenues & Volume, By Soft and Elastic Braces, 2022 - 2032F |
6.3.3 Belgium Over the Counter (OTC) Braces Market Revenues & Volume, By Hard and Rigid Braces, 2022 - 2032F |
6.3.4 Belgium Over the Counter (OTC) Braces Market Revenues & Volume, By Hinged Braces, 2022 - 2032F |
6.4 Belgium Over the Counter (OTC) Braces Market, By Application |
6.4.1 Overview and Analysis |
6.4.2 Belgium Over the Counter (OTC) Braces Market Revenues & Volume, By Ligament Injury Repair, 2022 - 2032F |
6.4.3 Belgium Over the Counter (OTC) Braces Market Revenues & Volume, By Preventive Care, 2022 - 2032F |
6.4.4 Belgium Over the Counter (OTC) Braces Market Revenues & Volume, By Post-Operative Rehabilitation, 2022 - 2032F |
6.4.5 Belgium Over the Counter (OTC) Braces Market Revenues & Volume, By Osteoarthritis, 2022 - 2032F |
6.4.6 Belgium Over the Counter (OTC) Braces Market Revenues & Volume, By Compression Therapy, 2022 - 2032F |
6.4.7 Belgium Over the Counter (OTC) Braces Market Revenues & Volume, By Others, 2022 - 2032F |
6.5 Belgium Over the Counter (OTC) Braces Market, By Distribution Channel |
6.5.1 Overview and Analysis |
6.5.2 Belgium Over the Counter (OTC) Braces Market Revenues & Volume, By Pharmacies and Retailers, 2022 - 2032F |
6.5.3 Belgium Over the Counter (OTC) Braces Market Revenues & Volume, By E-Commerce, 2022 - 2032F |
6.5.4 Belgium Over the Counter (OTC) Braces Market Revenues & Volume, By Orthopedic Clinics, 2022 - 2032F |
6.6 Belgium Over the Counter (OTC) Braces Market, By End User |
6.6.1 Overview and Analysis |
6.6.2 Belgium Over the Counter (OTC) Braces Market Revenues & Volume, By Hospitals, 2022 - 2032F |
6.6.3 Belgium Over the Counter (OTC) Braces Market Revenues & Volume, By Home Healthcare, 2022 - 2032F |
6.6.4 Belgium Over the Counter (OTC) Braces Market Revenues & Volume, By Others, 2022 - 2032F |
7 Belgium Over the Counter (OTC) Braces Market Import-Export Trade Statistics |
7.1 Belgium Over the Counter (OTC) Braces Market Export to Major Countries |
7.2 Belgium Over the Counter (OTC) Braces Market Imports from Major Countries |
8 Belgium Over the Counter (OTC) Braces Market Key Performance Indicators |
8.1 Customer satisfaction levels with OTC braces. |
8.2 Number of new product launches or innovations in the OTC braces market. |
8.3 Rate of adoption of OTC braces among different age groups. |
8.4 Consumer feedback on the effectiveness and comfort of OTC braces. |
8.5 Percentage of return customers purchasing OTC braces. |
9 Belgium Over the Counter (OTC) Braces Market - Opportunity Assessment |
9.1 Belgium Over the Counter (OTC) Braces Market Opportunity Assessment, By Product, 2022 & 2032F |
9.2 Belgium Over the Counter (OTC) Braces Market Opportunity Assessment, By Indication, 2022 & 2032F |
9.3 Belgium Over the Counter (OTC) Braces Market Opportunity Assessment, By Type, 2022 & 2032F |
9.4 Belgium Over the Counter (OTC) Braces Market Opportunity Assessment, By Application, 2022 & 2032F |
9.5 Belgium Over the Counter (OTC) Braces Market Opportunity Assessment, By Distribution Channel, 2022 & 2032F |
9.6 Belgium Over the Counter (OTC) Braces Market Opportunity Assessment, By End User, 2022 & 2032F |
10 Belgium Over the Counter (OTC) Braces Market - Competitive Landscape |
10.1 Belgium Over the Counter (OTC) Braces Market Revenue Share, By Companies, 2025 |
10.2 Belgium Over the Counter (OTC) Braces Market Competitive Benchmarking, By Operating and Technical Parameters |
11 Company Profiles |
12 Recommendations |
13 Disclaimer |
Global Go To Market Strategy - 2030
Export potential enables firms to identify high-growth global markets with greater confidence by combining advanced trade intelligence with a structured quantitative methodology. The framework analyzes emerging demand trends and country-level import patterns while integrating macroeconomic and trade datasets such as GDP and population forecasts, bilateral import–export flows, tariff structures, elasticity differentials between developed and developing economies, geographic distance, and import demand projections. Using weighted trade values from 2020–2024 as the base period to project country-to-country export potential for 2030, these inputs are operationalized through calculated drivers such as gravity model parameters, tariff impact factors, and projected GDP per-capita growth. Through an analysis of hidden potentials, demand hotspots, and market conditions that are most favorable to success, this method enables firms to focus on target countries, maximize returns, and global expansion with data, backed by accuracy.
By factoring in the projected importer demand gap that is currently unmet and could be potential opportunity, it identifies the potential for the Exporter (Country) among 190 countries, against the general trade analysis, which identifies the biggest importer or exporter.
To discover high-growth global markets and optimize your business strategy:
Click Here
Pricing
- Single User License$ 1,995
- Department License$ 2,400
- Site License$ 3,120
- Global License$ 3,795

Leadership Perspectives from Industry Events
Search
Thought Leadership and Analyst Meet


Our Clients
6WResearch In News
- India Export Attractiveness Tracker 2026
- India Air Conditioner Market Set for Strong Rebound in 2026 After Weather-Led Correction and GST-Driven Recovery: 6Wresearch
- ADAS in India: How Automatic Emergency Braking, Blind Spot Detection & Driver Monitoring are Transforming Road Safety
- Doha a strategic location for EV manufacturing hub: IPA Qatar
- Demand for luxury TVs surging in the GCC, says Samsung
- Empowering Growth: The Thriving Journey of Bangladesh’s Cable Industry
Latest Reports
- Nicaragua RPG Gaming Market (2026-2032)
- New Zealand RPG Gaming Market (2026-2032)
- Netherlands RPG Gaming Market (2026-2032)
- Nauru RPG Gaming Market (2026-2032)
- Namibia RPG Gaming Market (2026-2032)
- Mozambique RPG Gaming Market (2026-2032)
- Montenegro RPG Gaming Market (2026-2032)
- Mongolia RPG Gaming Market (2026-2032)
- Monaco RPG Gaming Market (2026-2032)
- Micronesia RPG Gaming Market (2026-2032)
Industry Events and Analyst Meet

EV India Expo 2026

HIMTEX 2026

India Refining Summit 2026

India EV Show 2026

EV tech India Expo 2026
Whitepaper
- Middle East & Africa Commercial Security Market Click here to view more.
- Middle East & Africa Fire Safety Systems & Equipment Market Click here to view more.
- GCC Drone Market Click here to view more.
- Middle East Lighting Fixture Market Click here to view more.
- GCC Physical & Perimeter Security Market Click here to view more.