Belgium Prisms Market (2026-2032) | Revenue, Companies, Growth, Forecast, Size, Share, Trends, Value, Outlook, Analysis, Industry & Segmentation
Market Forecast By Product (Dispersion Prisms, Deviation Prisms, Rotation Prisms, Displacement Prisms), By Application (Microscope, Lens, Telescope, Others) And Competitive Landscape
| Product Code: ETC4957312 | Publication Date: Nov 2023 | Updated Date: Apr 2026 | Product Type: Market Research Report | |
| Publisher: 6Wresearch | Author: Shubham Padhi | No. of Pages: 60 | No. of Figures: 30 | No. of Tables: 5 |
Belgium Prisms Market Size (2020-2030)
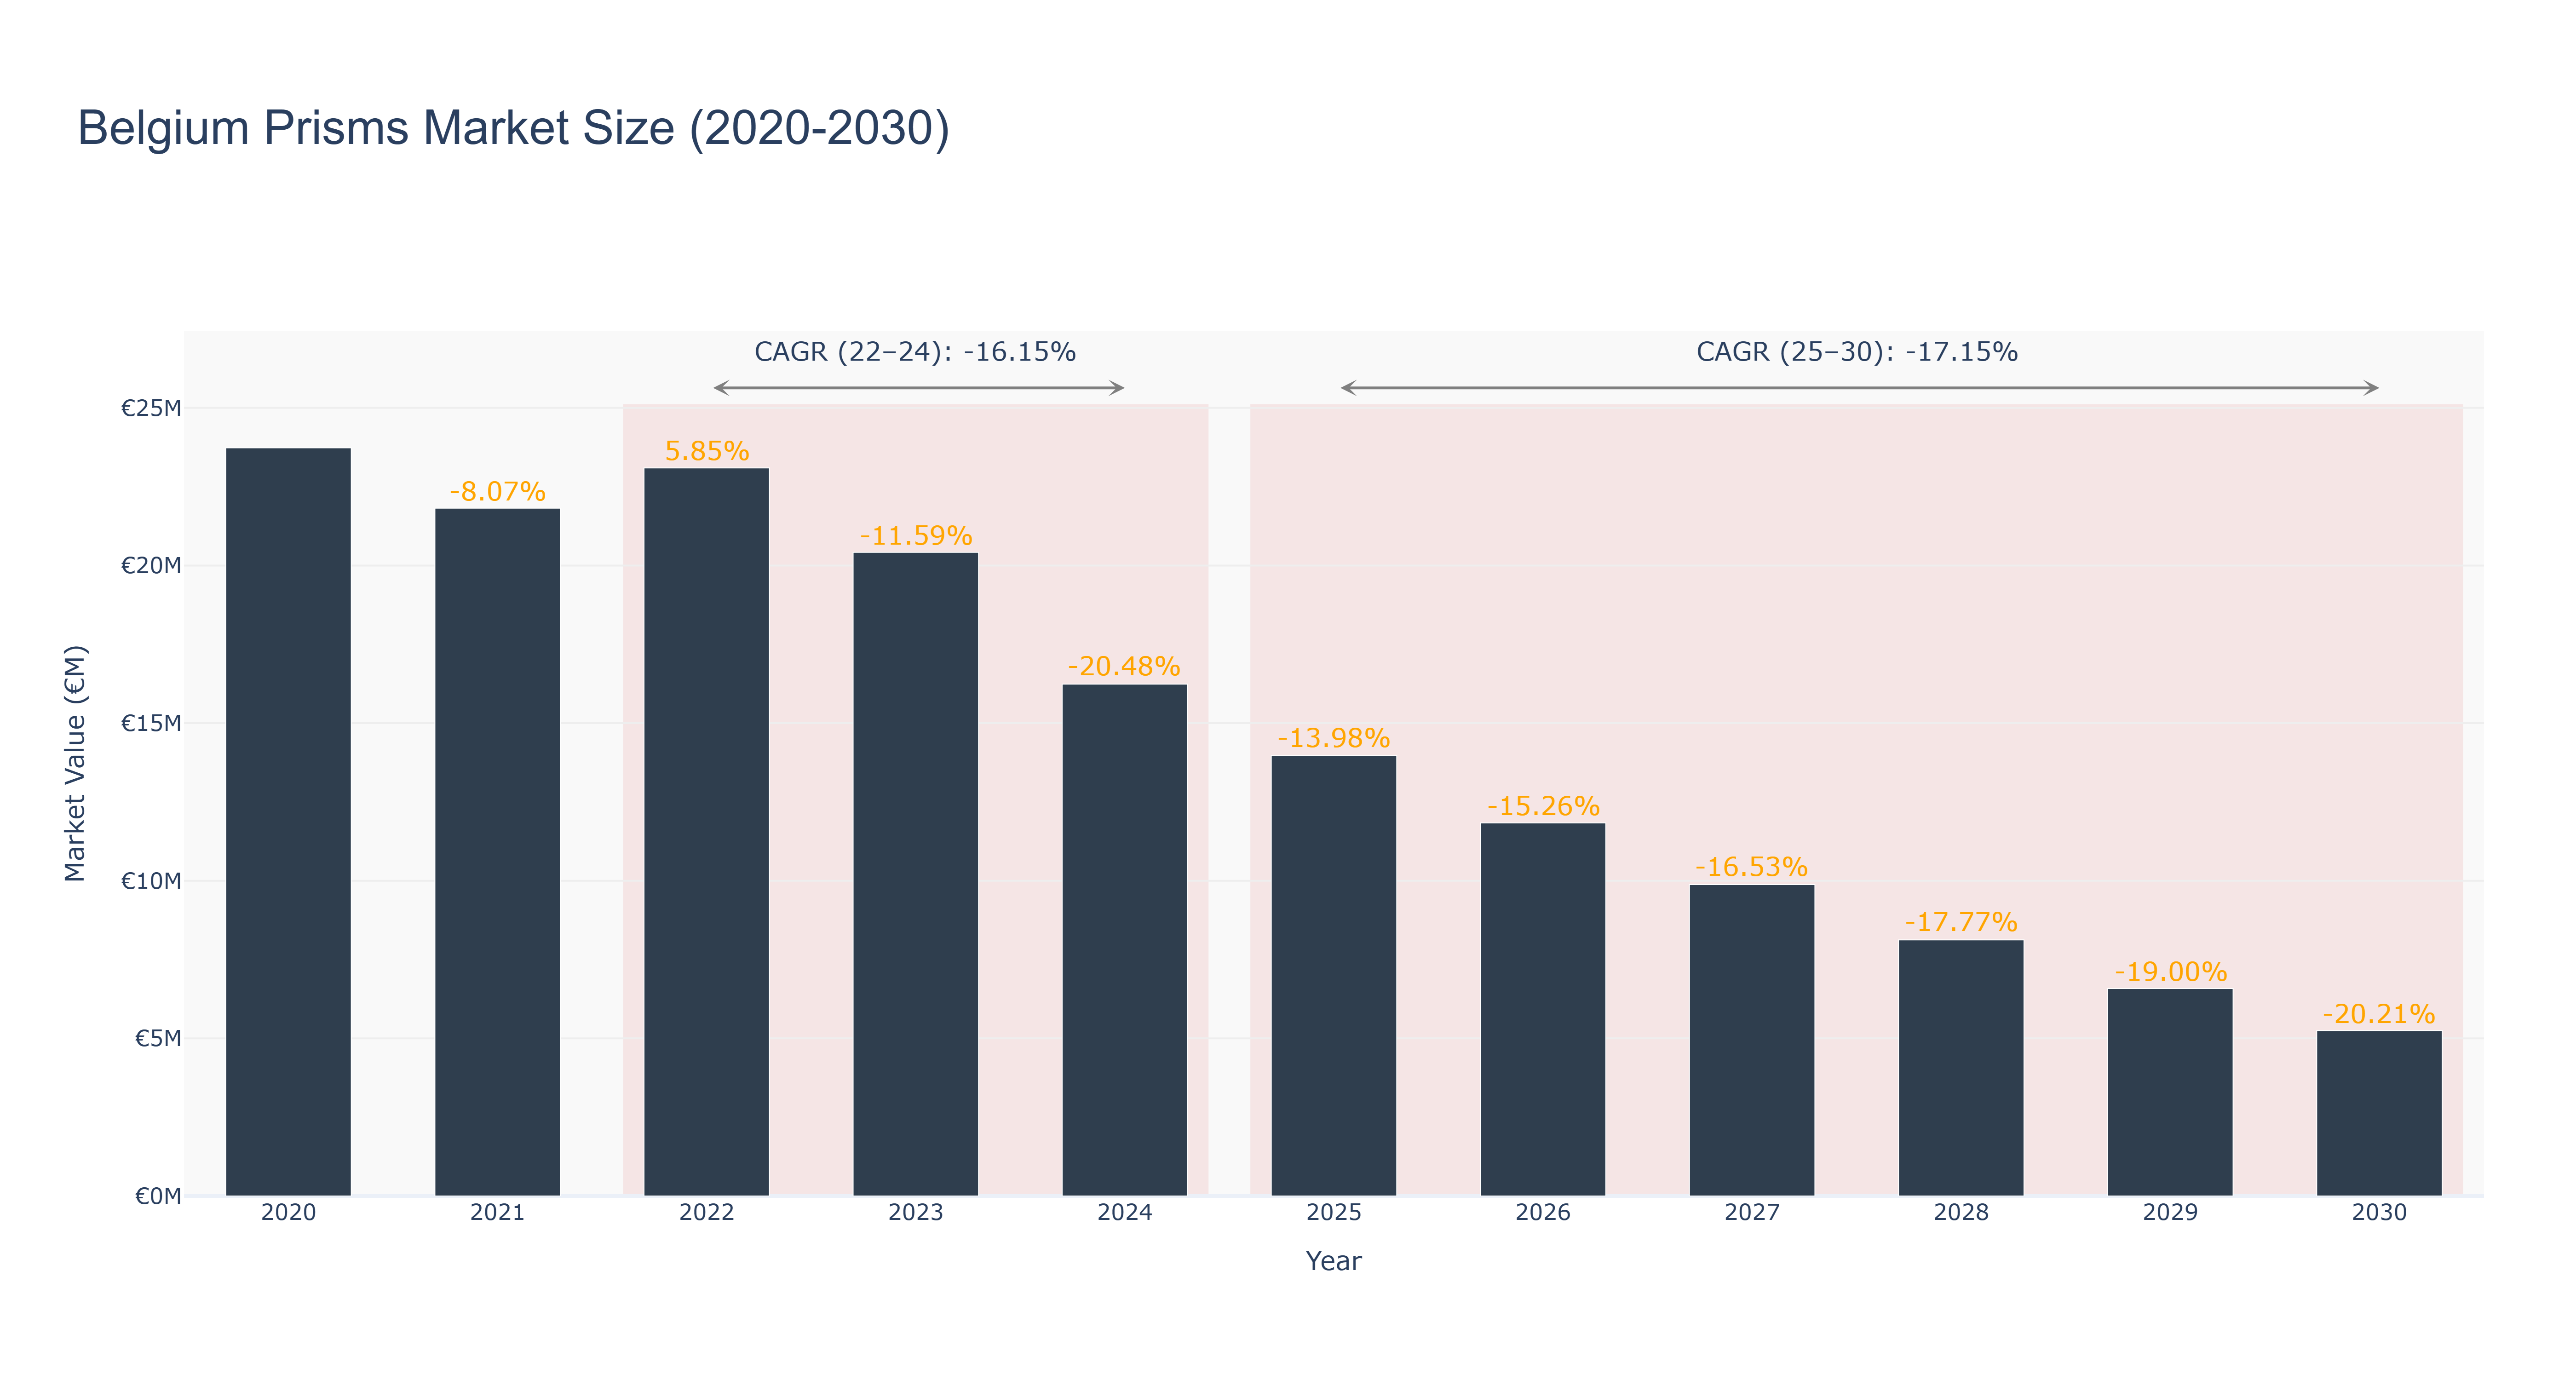
The Belgium Prisms Market experienced its peak in 2020 with a market size of €23.74 million, followed by a decline in 2021 to €21.82 million, representing a decrease of 8.07%. The market saw a brief resurgence in 2022, reaching €23.10 million with a growth of 5.85%, but fell again to €20.42 million in 2023, reflecting a significant contraction of 11.59%. The actual market size is projected to further decline to €16.24 million in 2024, resulting in a compound annual growth rate (CAGR) of -16.15% for the period from 2022 to 2024. The outlook for 2025 to 2030 is grim, with forecasted market sizes dropping to €5.25 million by 2030, indicating a CAGR of -17.15%. Factors contributing to this downturn include reduced demand for optical instruments and heightened competition. Without significant innovation or new projects to stimulate growth, the market is expected to continue its downward trajectory.
Belgium Prisms Market: Production & Trade Performance (2019-2025)
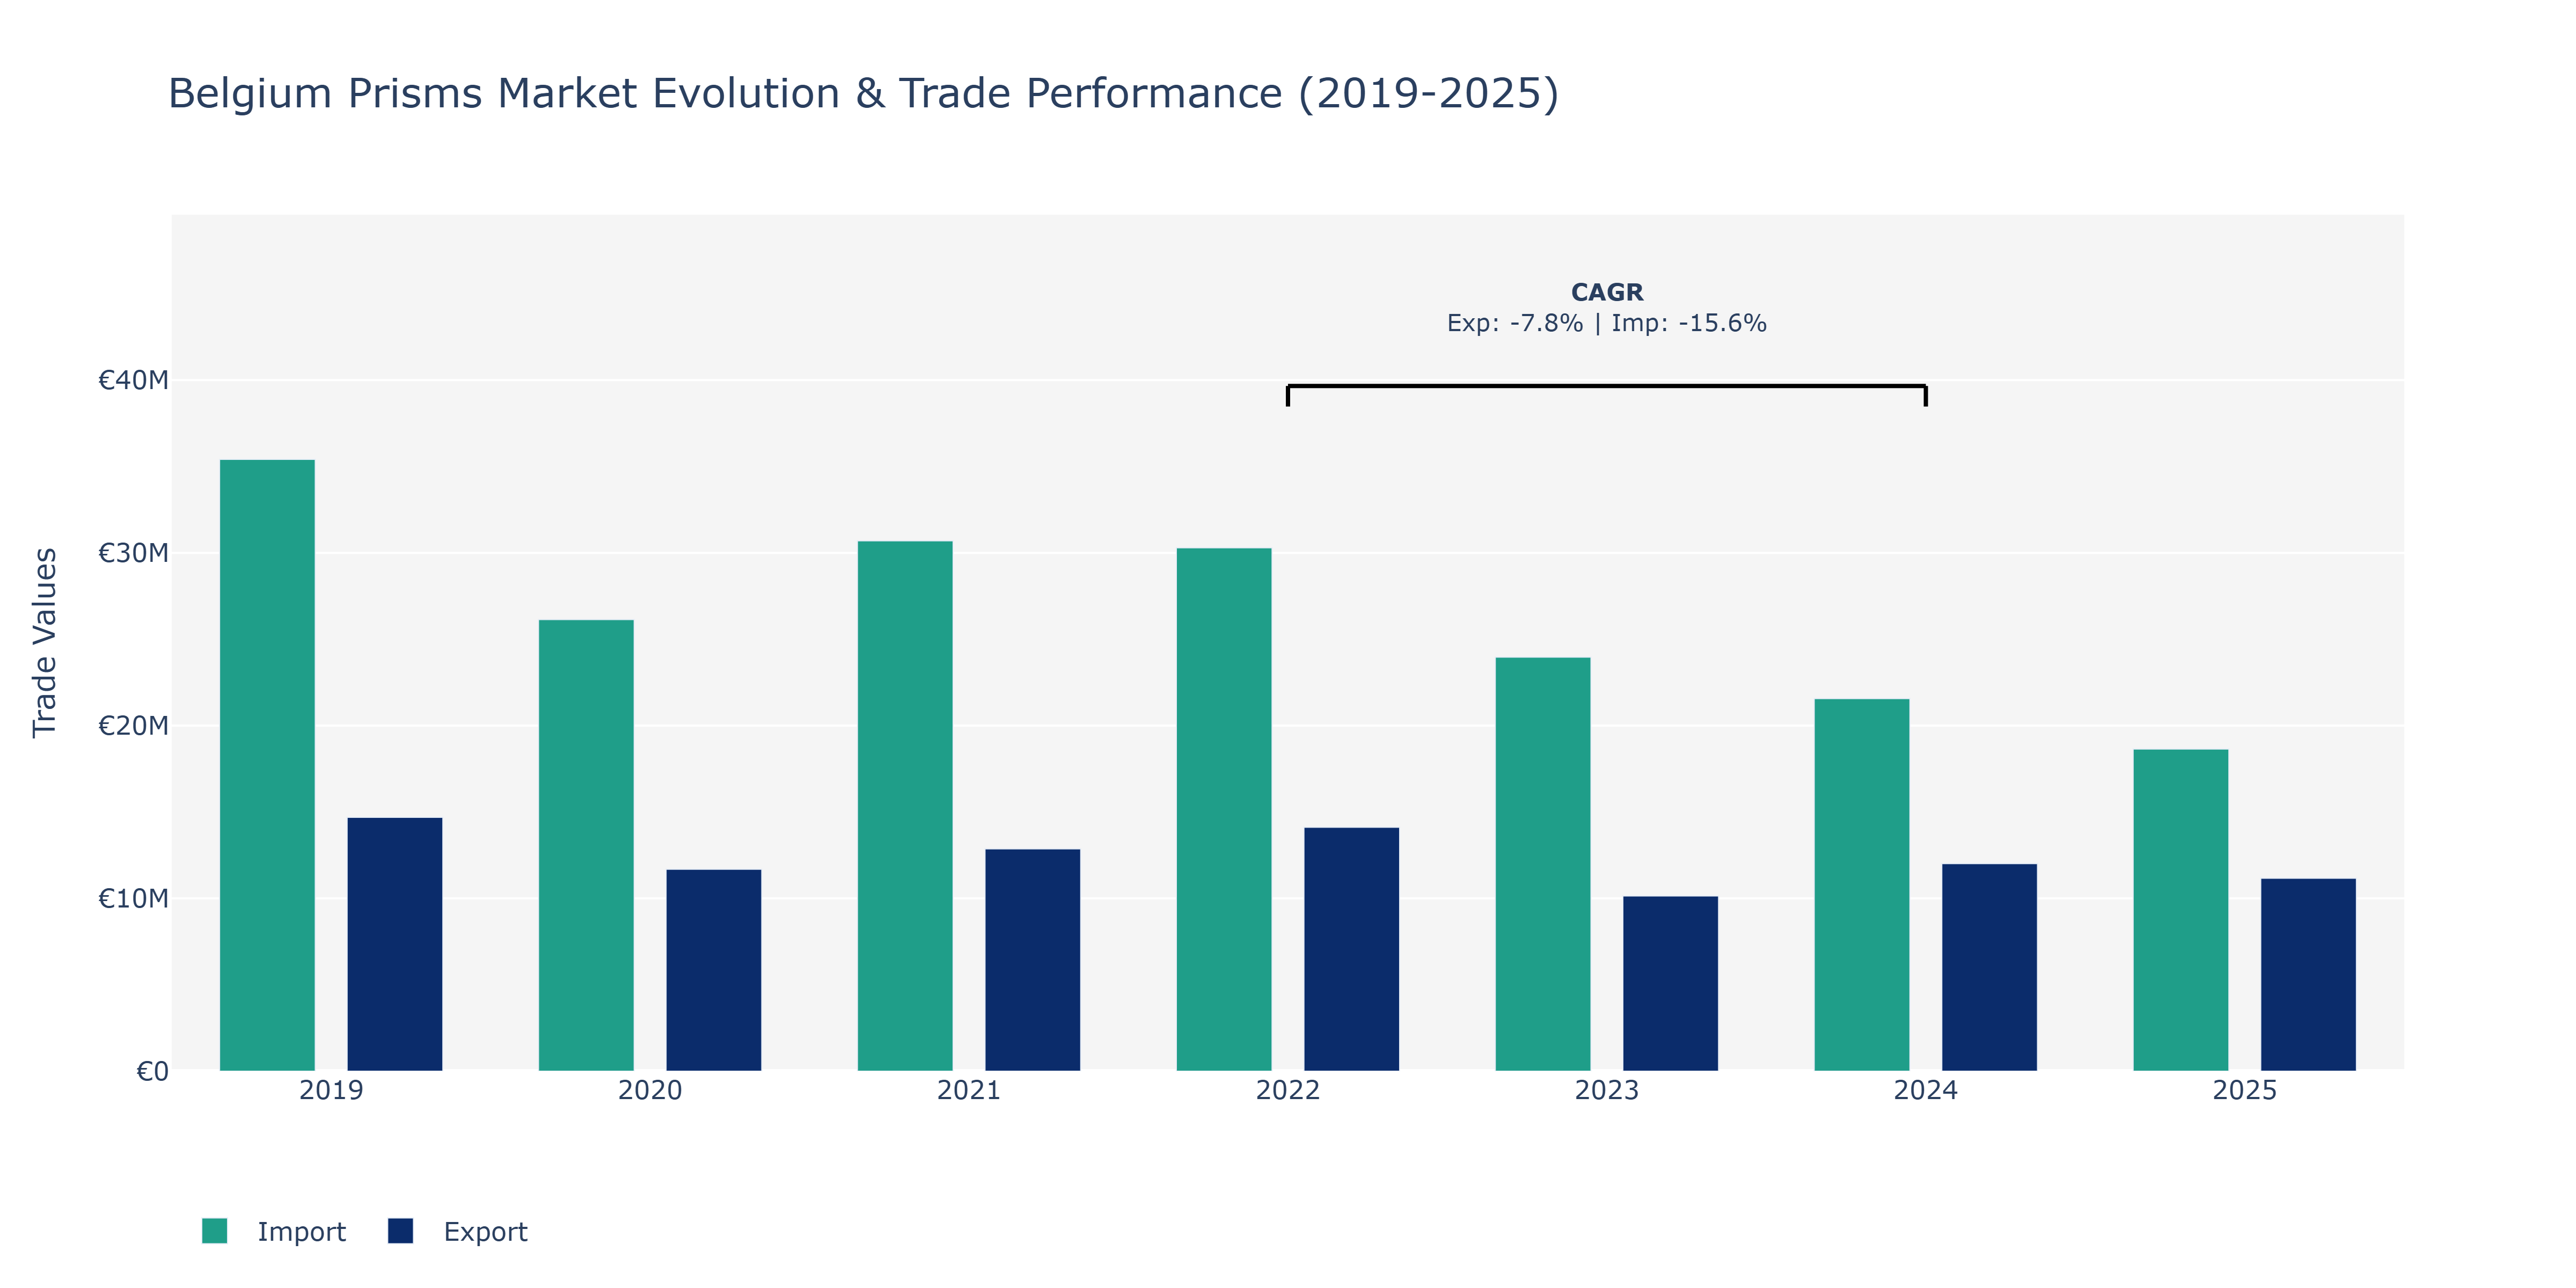
In the Belgium Prisms Market, exports exhibited a fluctuating pattern over the years, starting at €14.7 million in 2019 and decreasing to €10.14 million in 2023 before gradually recovering to €11.17 million in 2025. Imports followed a similar trend, declining from €35.41 million in 2019 to €18.65 million in 2025. The peak points for exports and imports were observed in 2019. The downturn in exports and imports in the following years can be attributed to global economic uncertainties, trade conflicts impacting demand, and supply chain disruptions. The recovery post-2023 may be linked to stabilization in the global economic landscape and efforts to strengthen trade relations. The negative CAGR for both exports and imports during 2022–2024 further underscores the challenging market conditions requiring resilient strategies and diversification in the Belgium Prisms Market.
Key Highlights of the Report:
- Belgium Prisms Market Outlook
- Market Size of Belgium Prisms Market, 2025
- Forecast of Belgium Prisms Market, 2032
- Historical Data and Forecast of Belgium Prisms Revenues & Volume for the Period 2022 - 2032F
- Belgium Prisms Market Trend Evolution
- Belgium Prisms Market Drivers and Challenges
- Belgium Prisms Price Trends
- Belgium Prisms Porter`s Five Forces
- Belgium Prisms Industry Life Cycle
- Historical Data and Forecast of Belgium Prisms Market Revenues & Volume By Product for the Period 2022 - 2032F
- Historical Data and Forecast of Belgium Prisms Market Revenues & Volume By Dispersion Prisms for the Period 2022 - 2032F
- Historical Data and Forecast of Belgium Prisms Market Revenues & Volume By Deviation Prisms for the Period 2022 - 2032F
- Historical Data and Forecast of Belgium Prisms Market Revenues & Volume By Rotation Prisms for the Period 2022 - 2032F
- Historical Data and Forecast of Belgium Prisms Market Revenues & Volume By Displacement Prisms for the Period 2022 - 2032F
- Historical Data and Forecast of Belgium Prisms Market Revenues & Volume By Application for the Period 2022 - 2032F
- Historical Data and Forecast of Belgium Prisms Market Revenues & Volume By Microscope for the Period 2022 - 2032F
- Historical Data and Forecast of Belgium Prisms Market Revenues & Volume By Lens for the Period 2022 - 2032F
- Historical Data and Forecast of Belgium Prisms Market Revenues & Volume By Telescope for the Period 2022 - 2032F
- Historical Data and Forecast of Belgium Prisms Market Revenues & Volume By Others for the Period 2022 - 2032F
- Belgium Prisms Import Export Trade Statistics
- Market Opportunity Assessment By Product
- Market Opportunity Assessment By Application
- Belgium Prisms Top Companies Market Share
- Belgium Prisms Competitive Benchmarking By Technical and Operational Parameters
- Belgium Prisms Company Profiles
- Belgium Prisms Key Strategic Recommendations
Frequently Asked Questions About the Market Study (FAQs):
6Wresearch actively monitors the Belgium Prisms Market and publishes its comprehensive annual report, highlighting emerging trends, growth drivers, revenue analysis, and forecast outlook. Our insights help businesses to make data-backed strategic decisions with ongoing market dynamics. Our analysts track relevent industries related to the Belgium Prisms Market, allowing our clients with actionable intelligence and reliable forecasts tailored to emerging regional needs.
Yes, we provide customisation as per your requirements. To learn more, feel free to contact us on sales@6wresearch.com
1 Executive Summary |
2 Introduction |
2.1 Key Highlights of the Report |
2.2 Report Description |
2.3 Market Scope & Segmentation |
2.4 Research Methodology |
2.5 Assumptions |
3 Belgium Prisms Market Overview |
3.1 Belgium Country Macro Economic Indicators |
3.2 Belgium Prisms Market Revenues & Volume, 2022 & 2032F |
3.3 Belgium Prisms Market - Industry Life Cycle |
3.4 Belgium Prisms Market - Porter's Five Forces |
3.5 Belgium Prisms Market Revenues & Volume Share, By Product, 2022 & 2032F |
3.6 Belgium Prisms Market Revenues & Volume Share, By Application, 2022 & 2032F |
4 Belgium Prisms Market Dynamics |
4.1 Impact Analysis |
4.2 Market Drivers |
4.2.1 Increasing demand for high-quality optics in industries such as healthcare, defense, and automotive |
4.2.2 Technological advancements leading to the development of more efficient and precise prism manufacturing processes |
4.2.3 Growing adoption of prisms in various applications such as imaging, spectroscopy, and surveying |
4.3 Market Restraints |
4.3.1 Fluctuating raw material prices impacting production costs |
4.3.2 Intense competition among prism manufacturers leading to price wars and margin pressures |
4.3.3 Regulatory challenges related to environmental standards and export/import regulations |
5 Belgium Prisms Market Trends |
6 Belgium Prisms Market Segmentations |
6.1 Belgium Prisms Market, By Product |
6.1.1 Overview and Analysis |
6.1.2 Belgium Prisms Market Revenues & Volume, By Dispersion Prisms, 2022 - 2032F |
6.1.3 Belgium Prisms Market Revenues & Volume, By Deviation Prisms, 2022 - 2032F |
6.1.4 Belgium Prisms Market Revenues & Volume, By Rotation Prisms, 2022 - 2032F |
6.1.5 Belgium Prisms Market Revenues & Volume, By Displacement Prisms, 2022 - 2032F |
6.2 Belgium Prisms Market, By Application |
6.2.1 Overview and Analysis |
6.2.2 Belgium Prisms Market Revenues & Volume, By Microscope, 2022 - 2032F |
6.2.3 Belgium Prisms Market Revenues & Volume, By Lens, 2022 - 2032F |
6.2.4 Belgium Prisms Market Revenues & Volume, By Telescope, 2022 - 2032F |
6.2.5 Belgium Prisms Market Revenues & Volume, By Others, 2022 - 2032F |
7 Belgium Prisms Market Import-Export Trade Statistics |
7.1 Belgium Prisms Market Export to Major Countries |
7.2 Belgium Prisms Market Imports from Major Countries |
8 Belgium Prisms Market Key Performance Indicators |
8.1 Average order value per customer |
8.2 Percentage of repeat business from existing customers |
8.3 Number of new product innovations introduced |
8.4 Percentage of market segments penetrated |
8.5 Customer satisfaction ratings on product quality and service |
9 Belgium Prisms Market - Opportunity Assessment |
9.1 Belgium Prisms Market Opportunity Assessment, By Product, 2022 & 2032F |
9.2 Belgium Prisms Market Opportunity Assessment, By Application, 2022 & 2032F |
10 Belgium Prisms Market - Competitive Landscape |
10.1 Belgium Prisms Market Revenue Share, By Companies, 2025 |
10.2 Belgium Prisms Market Competitive Benchmarking, By Operating and Technical Parameters |
11 Company Profiles |
12 Recommendations | 13 Disclaimer |
Global Go To Market Strategy - 2030
Export potential enables firms to identify high-growth global markets with greater confidence by combining advanced trade intelligence with a structured quantitative methodology. The framework analyzes emerging demand trends and country-level import patterns while integrating macroeconomic and trade datasets such as GDP and population forecasts, bilateral import–export flows, tariff structures, elasticity differentials between developed and developing economies, geographic distance, and import demand projections. Using weighted trade values from 2020–2024 as the base period to project country-to-country export potential for 2030, these inputs are operationalized through calculated drivers such as gravity model parameters, tariff impact factors, and projected GDP per-capita growth. Through an analysis of hidden potentials, demand hotspots, and market conditions that are most favorable to success, this method enables firms to focus on target countries, maximize returns, and global expansion with data, backed by accuracy.
By factoring in the projected importer demand gap that is currently unmet and could be potential opportunity, it identifies the potential for the Exporter (Country) among 190 countries, against the general trade analysis, which identifies the biggest importer or exporter.
To discover high-growth global markets and optimize your business strategy:
Click Here
Pricing
- Single User License$ 1,995
- Department License$ 2,400
- Site License$ 3,120
- Global License$ 3,795

Leadership Perspectives from Industry Events
Search
Thought Leadership and Analyst Meet


Our Clients
6WResearch In News
- India Export Attractiveness Tracker 2026
- India Air Conditioner Market Set for Strong Rebound in 2026 After Weather-Led Correction and GST-Driven Recovery: 6Wresearch
- ADAS in India: How Automatic Emergency Braking, Blind Spot Detection & Driver Monitoring are Transforming Road Safety
- Doha a strategic location for EV manufacturing hub: IPA Qatar
- Demand for luxury TVs surging in the GCC, says Samsung
- Empowering Growth: The Thriving Journey of Bangladesh’s Cable Industry
Latest Reports
- Nicaragua RPG Gaming Market (2026-2032)
- New Zealand RPG Gaming Market (2026-2032)
- Netherlands RPG Gaming Market (2026-2032)
- Nauru RPG Gaming Market (2026-2032)
- Namibia RPG Gaming Market (2026-2032)
- Mozambique RPG Gaming Market (2026-2032)
- Montenegro RPG Gaming Market (2026-2032)
- Mongolia RPG Gaming Market (2026-2032)
- Monaco RPG Gaming Market (2026-2032)
- Micronesia RPG Gaming Market (2026-2032)
Industry Events and Analyst Meet

EV India Expo 2026

HIMTEX 2026

India Refining Summit 2026

India EV Show 2026

EV tech India Expo 2026
Whitepaper
- Middle East & Africa Commercial Security Market Click here to view more.
- Middle East & Africa Fire Safety Systems & Equipment Market Click here to view more.
- GCC Drone Market Click here to view more.
- Middle East Lighting Fixture Market Click here to view more.
- GCC Physical & Perimeter Security Market Click here to view more.