Belgium Water Meter Market (2026-2032) | Strategic Insights, Strategy, Trends, Revenue, Share, Consumer Insights, Competitive, Investment Trends, Challenges, Segmentation, Companies, Growth, Size, Industry, Forecast, Opportunities, Segments, Outlook, Value, Drivers, Pricing Analysis, Analysis, Restraints, Supply, Competition, Demand
Market Forecast By Type (Mechanical Water Meters, Smart Water Meters, Ultrasonic Water Meters, Electromagnetic Water Meters, Digital Water Meters), By Technology Used (Turbine, IoT & Wireless, Ultrasonic Sensing, Magnetic Induction, Sensor-based Analytics), By End User (Municipalities, Residential Buildings, Industrial Plants, Commercial Establishments, Agricultural Irrigation), By Application (Billing & Consumption Tracking, Leak Detection, Process Water Monitoring, Water Flow Control, Water Resource Management), By End Use (Professional Tattooing, Tattoo Studios) And Competitive Landscape
| Product Code: ETC11302402 | Publication Date: Apr 2025 | Updated Date: Apr 2026 | Product Type: Market Research Report | |
| Publisher: 6Wresearch | Author: Bhawna Singh | No. of Pages: 65 | No. of Figures: 34 | No. of Tables: 19 |
Belgium Water Meter Market Size (2020-2030)
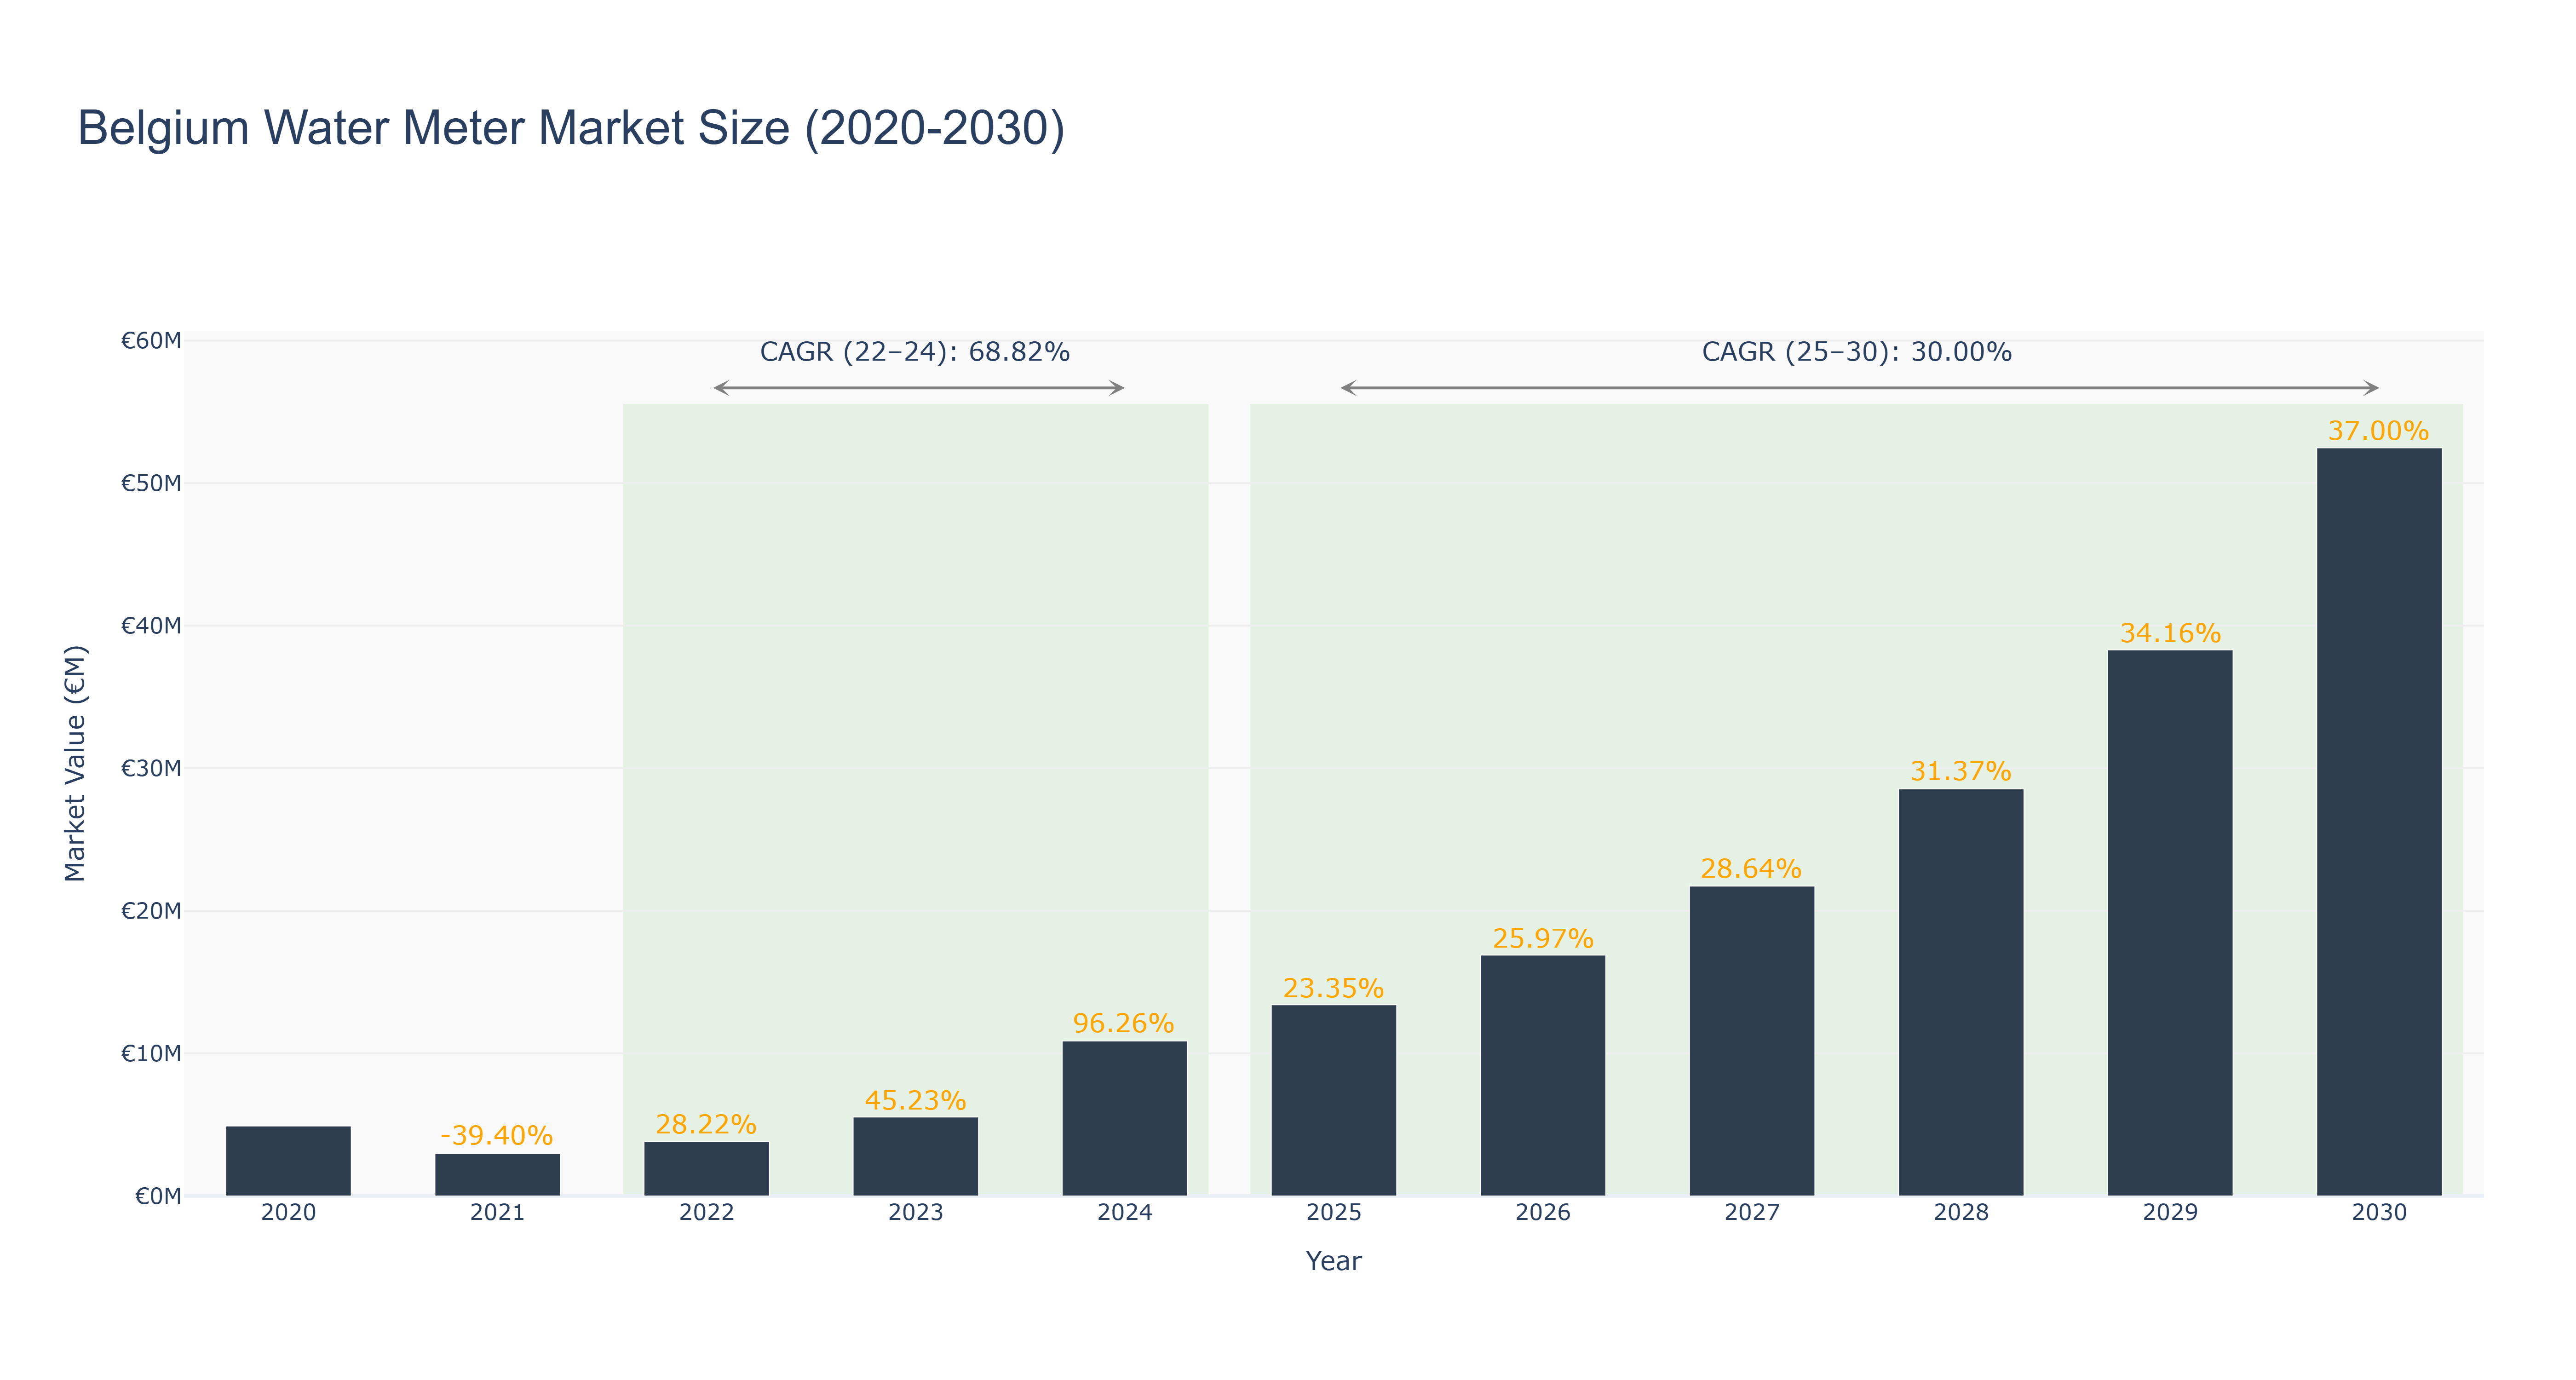
Belgium Water Meter Market has shown remarkable growth trends over the years. The market size peaked at €52.48 million in 2030, with a CAGR of 68.82% from 2022 to 2024. From 2025 to 2030, the forecasted CAGR stands at 30.0%. The actual market size saw significant increases from €4.91 million in 2020 to €10.87 million in 2024, driven by increased infrastructure investments and regulatory mandates for water conservation. The growth slowed down slightly in 2021 but picked up again in the following years, showcasing resilience and market potential. Looking ahead, Belgium is set to introduce smart water metering projects to enhance efficiency and sustainability in water management, aligning with the market's growth trajectory and environmental initiatives.
Belgium Water Meter Market: Production & Trade Performance (2019-2025)
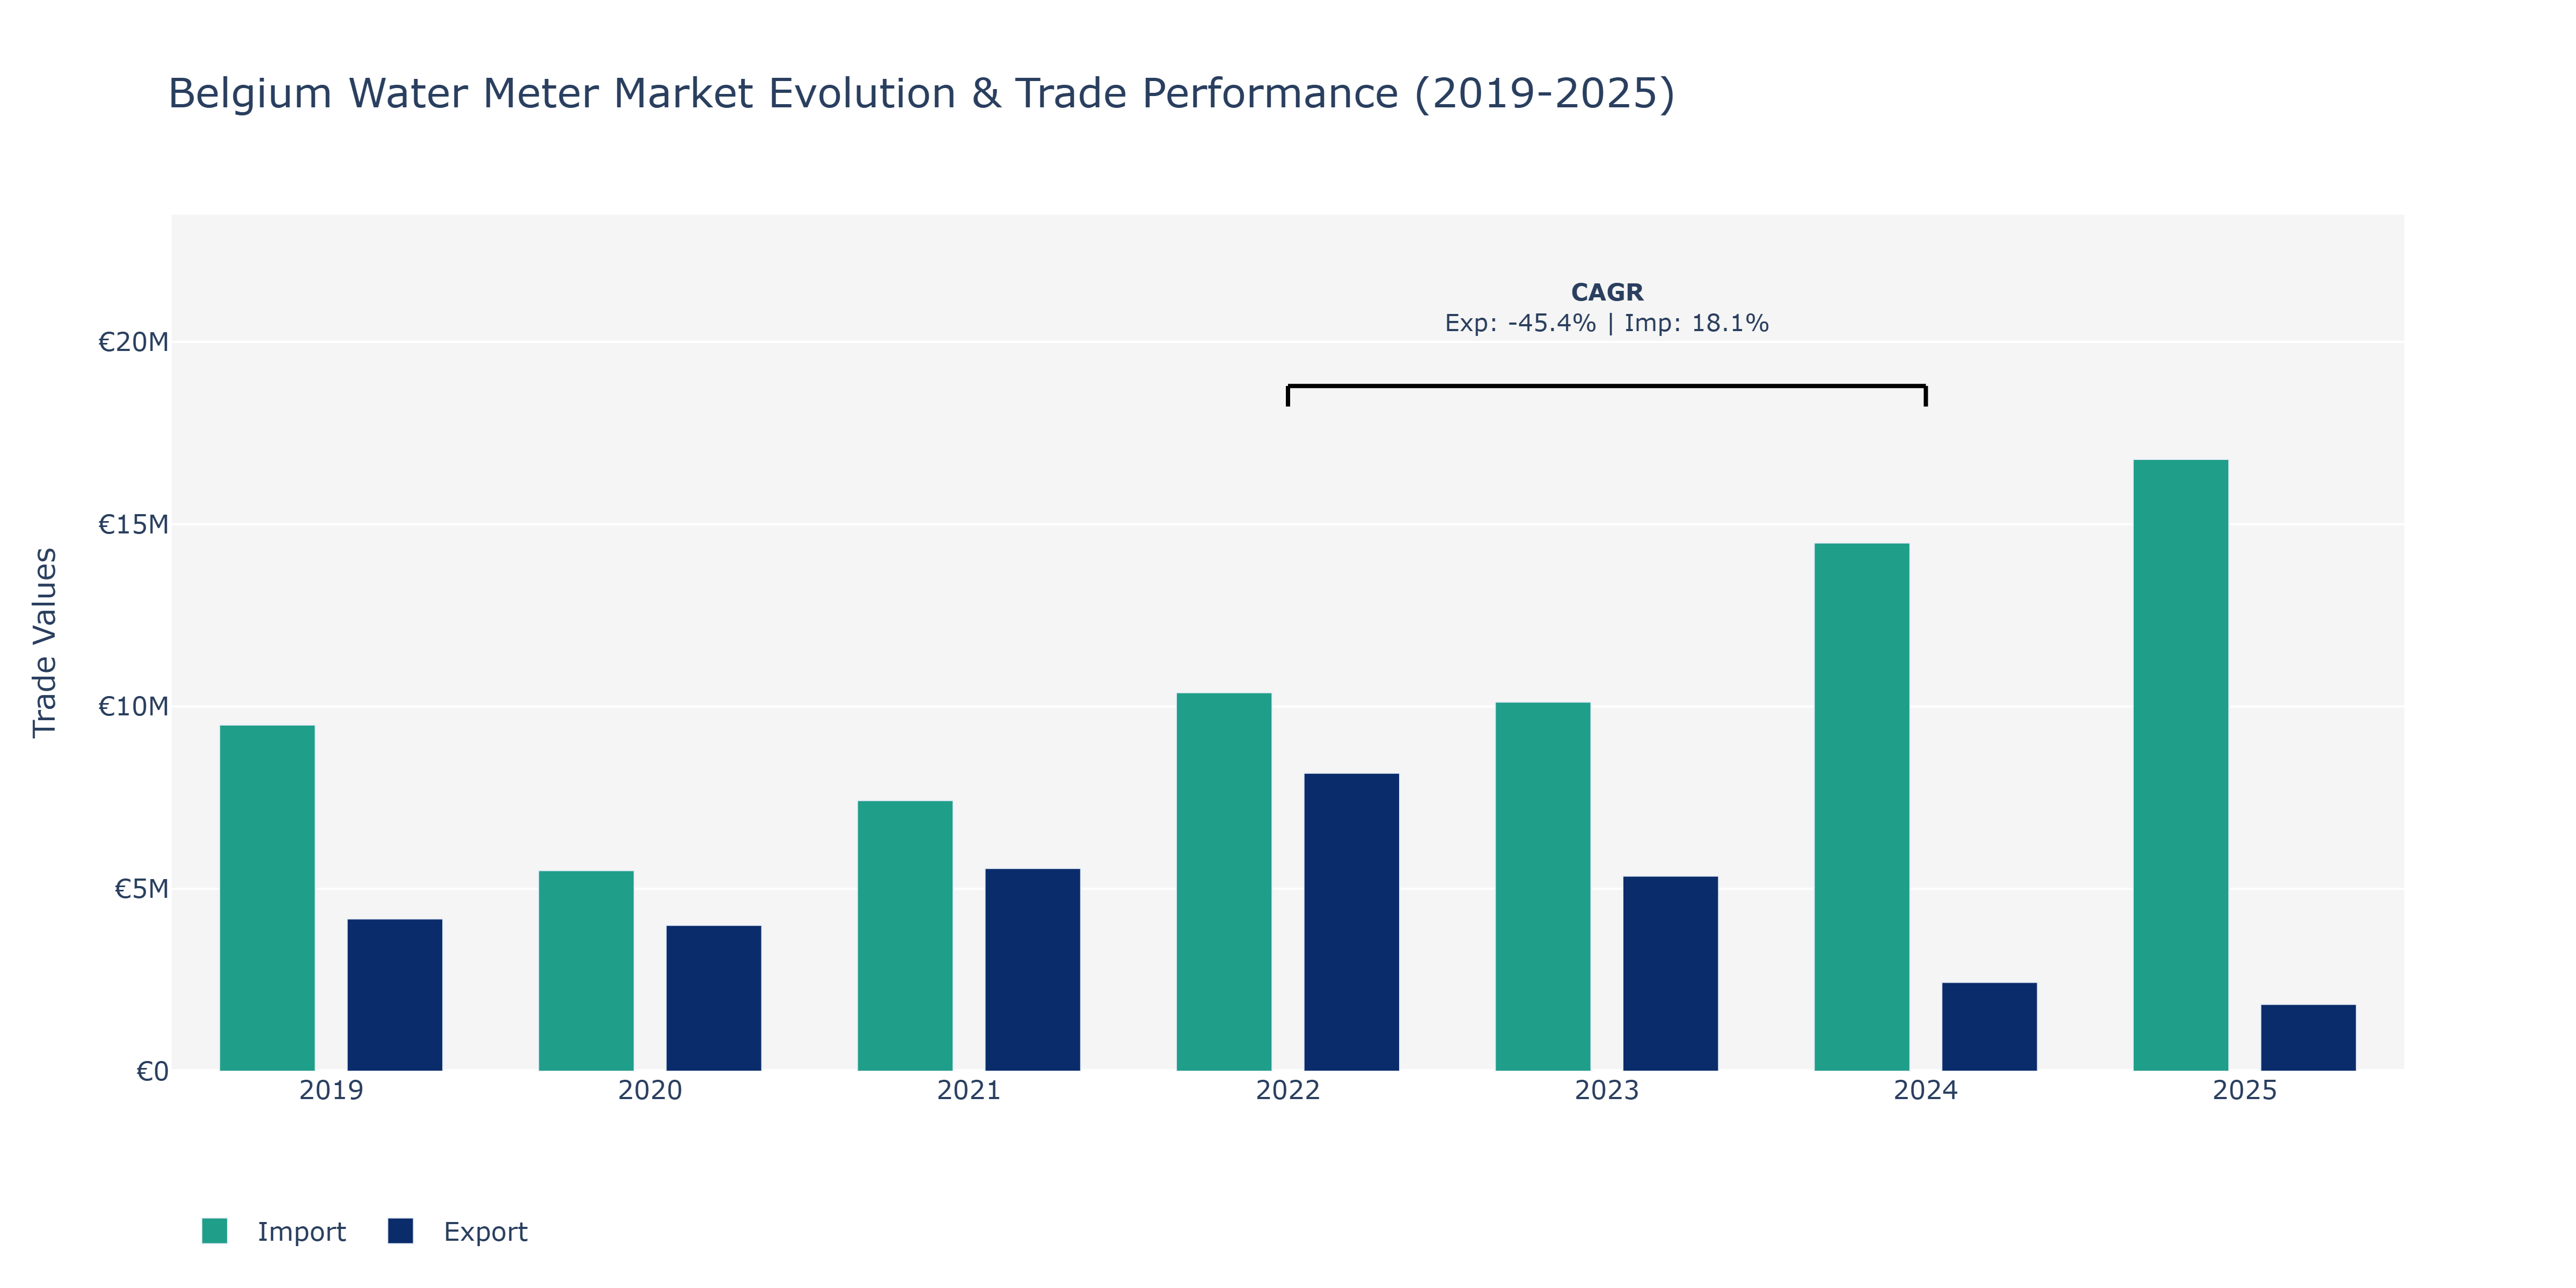
In the Belgium Water Meter Market, exports experienced fluctuations over the years, starting at €4.18 million in 2019, declining to €1.83 million in 2025. The peak point for exports was observed in 2022, reaching €8.17 million. On the other hand, imports followed a different trend, increasing consistently from €9.49 million in 2019 to peak at €16.78 million in 2025. The sharp increase in imports can be attributed to technological advancements driving demand for water meters in Belgium. The decline in exports post-2022 may reflect shifts in global market dynamics or changes in domestic consumption patterns impacting export volumes. The contrasting trends between exports and imports may indicate a shift in trade balances or changes in production capacities within the water meter industry.
Key Highlights of the Report:
- Belgium Water Meter Market Outlook
- Market Size of Belgium Water Meter Market, 2025
- Forecast of Belgium Water Meter Market, 2032
- Historical Data and Forecast of Belgium Water Meter Revenues & Volume for the Period 2022 - 2032F
- Belgium Water Meter Market Trend Evolution
- Belgium Water Meter Market Drivers and Challenges
- Belgium Water Meter Price Trends
- Belgium Water Meter Porter's Five Forces
- Belgium Water Meter Industry Life Cycle
- Historical Data and Forecast of Belgium Water Meter Market Revenues & Volume By Type for the Period 2022 - 2032F
- Historical Data and Forecast of Belgium Water Meter Market Revenues & Volume By Mechanical Water Meters for the Period 2022 - 2032F
- Historical Data and Forecast of Belgium Water Meter Market Revenues & Volume By Smart Water Meters for the Period 2022 - 2032F
- Historical Data and Forecast of Belgium Water Meter Market Revenues & Volume By Ultrasonic Water Meters for the Period 2022 - 2032F
- Historical Data and Forecast of Belgium Water Meter Market Revenues & Volume By Electromagnetic Water Meters for the Period 2022 - 2032F
- Historical Data and Forecast of Belgium Water Meter Market Revenues & Volume By Digital Water Meters for the Period 2022 - 2032F
- Historical Data and Forecast of Belgium Water Meter Market Revenues & Volume By Technology Used for the Period 2022 - 2032F
- Historical Data and Forecast of Belgium Water Meter Market Revenues & Volume By Turbine for the Period 2022 - 2032F
- Historical Data and Forecast of Belgium Water Meter Market Revenues & Volume By IoT & Wireless for the Period 2022 - 2032F
- Historical Data and Forecast of Belgium Water Meter Market Revenues & Volume By Ultrasonic Sensing for the Period 2022 - 2032F
- Historical Data and Forecast of Belgium Water Meter Market Revenues & Volume By Magnetic Induction for the Period 2022 - 2032F
- Historical Data and Forecast of Belgium Water Meter Market Revenues & Volume By Sensor-based Analytics for the Period 2022 - 2032F
- Historical Data and Forecast of Belgium Water Meter Market Revenues & Volume By End User for the Period 2022 - 2032F
- Historical Data and Forecast of Belgium Water Meter Market Revenues & Volume By Municipalities for the Period 2022 - 2032F
- Historical Data and Forecast of Belgium Water Meter Market Revenues & Volume By Residential Buildings for the Period 2022 - 2032F
- Historical Data and Forecast of Belgium Water Meter Market Revenues & Volume By Industrial Plants for the Period 2022 - 2032F
- Historical Data and Forecast of Belgium Water Meter Market Revenues & Volume By Commercial Establishments for the Period 2022 - 2032F
- Historical Data and Forecast of Belgium Water Meter Market Revenues & Volume By Agricultural Irrigation for the Period 2022 - 2032F
- Historical Data and Forecast of Belgium Water Meter Market Revenues & Volume By Application for the Period 2022 - 2032F
- Historical Data and Forecast of Belgium Water Meter Market Revenues & Volume By Billing & Consumption Tracking for the Period 2022 - 2032F
- Historical Data and Forecast of Belgium Water Meter Market Revenues & Volume By Leak Detection for the Period 2022 - 2032F
- Historical Data and Forecast of Belgium Water Meter Market Revenues & Volume By Process Water Monitoring for the Period 2022 - 2032F
- Historical Data and Forecast of Belgium Water Meter Market Revenues & Volume By Water Flow Control for the Period 2022 - 2032F
- Historical Data and Forecast of Belgium Water Meter Market Revenues & Volume By Water Resource Management for the Period 2022 - 2032F
- Historical Data and Forecast of Belgium Water Meter Market Revenues & Volume By End Use for the Period 2022 - 2032F
- Historical Data and Forecast of Belgium Water Meter Market Revenues & Volume By Professional Tattooing for the Period 2022 - 2032F
- Historical Data and Forecast of Belgium Water Meter Market Revenues & Volume By Tattoo Studios for the Period 2022 - 2032F
- Belgium Water Meter Import Export Trade Statistics
- Market Opportunity Assessment By Type
- Market Opportunity Assessment By Technology Used
- Market Opportunity Assessment By End User
- Market Opportunity Assessment By Application
- Market Opportunity Assessment By End Use
- Belgium Water Meter Top Companies Market Share
- Belgium Water Meter Competitive Benchmarking By Technical and Operational Parameters
- Belgium Water Meter Company Profiles
- Belgium Water Meter Key Strategic Recommendations
Frequently Asked Questions About the Market Study (FAQs):
6Wresearch actively monitors the Belgium Water Meter Market and publishes its comprehensive annual report, highlighting emerging trends, growth drivers, revenue analysis, and forecast outlook. Our insights help businesses to make data-backed strategic decisions with ongoing market dynamics. Our analysts track relevent industries related to the Belgium Water Meter Market, allowing our clients with actionable intelligence and reliable forecasts tailored to emerging regional needs.
Yes, we provide customisation as per your requirements. To learn more, feel free to contact us on sales@6wresearch.com
1 Executive Summary |
2 Introduction |
2.1 Key Highlights of the Report |
2.2 Report Description |
2.3 Market Scope & Segmentation |
2.4 Research Methodology |
2.5 Assumptions |
3 Belgium Water Meter Market Overview |
3.1 Belgium Country Macro Economic Indicators |
3.2 Belgium Water Meter Market Revenues & Volume, 2022 & 2032F |
3.3 Belgium Water Meter Market - Industry Life Cycle |
3.4 Belgium Water Meter Market - Porter's Five Forces |
3.5 Belgium Water Meter Market Revenues & Volume Share, By Type, 2022 & 2032F |
3.6 Belgium Water Meter Market Revenues & Volume Share, By Technology Used, 2022 & 2032F |
3.7 Belgium Water Meter Market Revenues & Volume Share, By End User, 2022 & 2032F |
3.8 Belgium Water Meter Market Revenues & Volume Share, By Application, 2022 & 2032F |
4 Belgium Water Meter Market Dynamics |
4.1 Impact Analysis |
4.2 Market Drivers |
4.2.1 Increasing focus on water conservation and sustainable water management practices in Belgium |
4.2.2 Growing government initiatives and regulations promoting water meter installation and usage |
4.2.3 Technological advancements leading to the development of smart water meters with enhanced functionalities |
4.3 Market Restraints |
4.3.1 High initial installation costs of water meters leading to slow adoption rates |
4.3.2 Lack of awareness among consumers regarding the benefits of using water meters |
4.3.3 Challenges related to data privacy and security concerns with the implementation of smart water meters |
5 Belgium Water Meter Market Trends |
6 Belgium Water Meter Market, By Types |
6.1 Belgium Water Meter Market, By Type |
6.1.1 Overview and Analysis |
6.1.2 Belgium Water Meter Market Revenues & Volume, By Type, 2022 - 2032F |
6.1.3 Belgium Water Meter Market Revenues & Volume, By Mechanical Water Meters, 2022 - 2032F |
6.1.4 Belgium Water Meter Market Revenues & Volume, By Smart Water Meters, 2022 - 2032F |
6.1.5 Belgium Water Meter Market Revenues & Volume, By Ultrasonic Water Meters, 2022 - 2032F |
6.1.6 Belgium Water Meter Market Revenues & Volume, By Electromagnetic Water Meters, 2022 - 2032F |
6.1.7 Belgium Water Meter Market Revenues & Volume, By Digital Water Meters, 2022 - 2032F |
6.2 Belgium Water Meter Market, By Technology Used |
6.2.1 Overview and Analysis |
6.2.2 Belgium Water Meter Market Revenues & Volume, By Turbine, 2022 - 2032F |
6.2.3 Belgium Water Meter Market Revenues & Volume, By IoT & Wireless, 2022 - 2032F |
6.2.4 Belgium Water Meter Market Revenues & Volume, By Ultrasonic Sensing, 2022 - 2032F |
6.2.5 Belgium Water Meter Market Revenues & Volume, By Magnetic Induction, 2022 - 2032F |
6.2.6 Belgium Water Meter Market Revenues & Volume, By Sensor-based Analytics, 2022 - 2032F |
6.3 Belgium Water Meter Market, By End User |
6.3.1 Overview and Analysis |
6.3.2 Belgium Water Meter Market Revenues & Volume, By Municipalities, 2022 - 2032F |
6.3.3 Belgium Water Meter Market Revenues & Volume, By Residential Buildings, 2022 - 2032F |
6.3.4 Belgium Water Meter Market Revenues & Volume, By Industrial Plants, 2022 - 2032F |
6.3.5 Belgium Water Meter Market Revenues & Volume, By Commercial Establishments, 2022 - 2032F |
6.3.6 Belgium Water Meter Market Revenues & Volume, By Agricultural Irrigation, 2022 - 2032F |
6.4 Belgium Water Meter Market, By Application |
6.4.1 Overview and Analysis |
6.4.2 Belgium Water Meter Market Revenues & Volume, By Billing & Consumption Tracking, 2022 - 2032F |
6.4.3 Belgium Water Meter Market Revenues & Volume, By Leak Detection, 2022 - 2032F |
6.4.4 Belgium Water Meter Market Revenues & Volume, By Process Water Monitoring, 2022 - 2032F |
6.4.5 Belgium Water Meter Market Revenues & Volume, By Water Flow Control, 2022 - 2032F |
6.4.6 Belgium Water Meter Market Revenues & Volume, By Water Resource Management, 2022 - 2032F |
7 Belgium Water Meter Market Import-Export Trade Statistics |
7.1 Belgium Water Meter Market Export to Major Countries |
7.2 Belgium Water Meter Market Imports from Major Countries |
8 Belgium Water Meter Market Key Performance Indicators |
8.1 Average daily water consumption per capita in Belgium |
8.2 Percentage of households in Belgium equipped with water meters |
8.3 Rate of adoption of smart water meters in the Belgian market |
9 Belgium Water Meter Market - Opportunity Assessment |
9.1 Belgium Water Meter Market Opportunity Assessment, By Type, 2022 & 2032F |
9.2 Belgium Water Meter Market Opportunity Assessment, By Technology Used, 2022 & 2032F |
9.3 Belgium Water Meter Market Opportunity Assessment, By End User, 2022 & 2032F |
9.4 Belgium Water Meter Market Opportunity Assessment, By Application, 2022 & 2032F |
10 Belgium Water Meter Market - Competitive Landscape |
10.1 Belgium Water Meter Market Revenue Share, By Companies, 2025 |
10.2 Belgium Water Meter Market Competitive Benchmarking, By Operating and Technical Parameters |
11 Company Profiles |
12 Recommendations |
13 Disclaimer |
Export potential assessment - trade Analytics for 2030
Export potential enables firms to identify high-growth global markets with greater confidence by combining advanced trade intelligence with a structured quantitative methodology. The framework analyzes emerging demand trends and country-level import patterns while integrating macroeconomic and trade datasets such as GDP and population forecasts, bilateral import–export flows, tariff structures, elasticity differentials between developed and developing economies, geographic distance, and import demand projections. Using weighted trade values from 2020–2024 as the base period to project country-to-country export potential for 2030, these inputs are operationalized through calculated drivers such as gravity model parameters, tariff impact factors, and projected GDP per-capita growth. Through an analysis of hidden potentials, demand hotspots, and market conditions that are most favorable to success, this method enables firms to focus on target countries, maximize returns, and global expansion with data, backed by accuracy.
By factoring in the projected importer demand gap that is currently unmet and could be potential opportunity, it identifies the potential for the Exporter (Country) among 190 countries, against the general trade analysis, which identifies the biggest importer or exporter.
To discover high-growth global markets and optimize your business strategy:
Click Here
Pricing
- Single User License$ 1,995
- Department License$ 2,400
- Site License$ 3,120
- Global License$ 3,795

Search
Thought Leadership and Analyst Meet


Our Clients
Latest Reports
- India Ultrasonic Smart Water Meter Market (2026-2032) | Outlook, Competition, Drivers, Trends, Demand, Competitive, Strategic Insights, Companies, Challenges, Strategy, Consumer Insights, Analysis, Opportunities, Growth, Size, Share, Industry, Revenue, Segments, Value, Segmentation, Supply, Forecast, Restraints,
- India Electromagnetic Bulk Flow Meter Market (2026-2032) | Analysis, Challenges, Strategic Insights, Supply, Forecast, Growth, Share, Consumer Insights, Competitive, Value, Outlook, Size & Demand,
- India Battery Powered Bulk Flow Meter Market (2026-2032) | Outlook, Analysis, Competitive Landscape, Growth, Size, Trends, Value, Revenue, Companies, Segmentation, Share & Forecast
- Bosnia and Herzegovina Fuel-Efficient Winglets Market (2026-2032) | Growth, Competition, Strategy, Restraints, Trends, Challenges, segmentation, Value, Outlook, Investment Opportunities, Analysis, Revenue, Companies, Insights, Pricing, Size, Drivers, Demand, Share, Forecast
- Canada Cloud CFD Market (2026-2032) | Size & Revenue, Industry, Growth, Competitive Landscape, Forecast, Segmentation, Value, Outlook, Trends, Share, Analysis, Companies
- Taiwan Food Delivery Platform Market (2026-2032) | Companies, Outlook, Analysis, Trends, Value, Revenue, Segmentation, Share, Forecast, Competitive Landscape, Growth, Size & Forecast
- United Kingdom (UK) Long-term Care Insurance Market (2026-2032) | Growth, Share, Consumer Insights, Drivers, Opportunities, Competition, Pricing Analysis, Segments, Restraints, Companies, Competitive, Value, Outlook, Size, Demand, Analysis, Challenges, Strategic Insights, Investment Trends, Revenue, Trends, Supply, Forecast
- United Kingdom (UK) Long Term Care Market (2026-2032) | Companies, Outlook, Analysis, Trends, Value, Revenue, Segmentation, Share, Forecast, Competitive Landscape, Growth, Size & Forecast
- Iraq Insulation and Waterproofing Market (2026-2032) | Outlook, Drivers, Growth, Size, Share, Industry, Revenue, Trends, Demand, Competitive, Strategic Insights, Opportunities, Segments, Companies, Challenges, Strategy, Consumer Insights, Analysis, Investment Trends, Value, Segmentation, Forecast, Restraints
- India Switchgear Market Outlook (2026-2032) | Size, Share, Trends, Growth, Revenue, Forecast, Analysis, Value, Outlook
Industry Events and Analyst Meet

HIMTEX 2026

India Refining Summit 2026

India EV Show 2026

EV tech India Expo 2026

Auto Tech Asia 2026
Whitepaper
- Middle East & Africa Commercial Security Market Click here to view more.
- Middle East & Africa Fire Safety Systems & Equipment Market Click here to view more.
- GCC Drone Market Click here to view more.
- Middle East Lighting Fixture Market Click here to view more.
- GCC Physical & Perimeter Security Market Click here to view more.
6WResearch In News
- Doha a strategic location for EV manufacturing hub: IPA Qatar
- Demand for luxury TVs surging in the GCC, says Samsung
- Empowering Growth: The Thriving Journey of Bangladesh’s Cable Industry
- Demand for luxury TVs surging in the GCC, says Samsung
- Video call with a traditional healer? Once unthinkable, it’s now common in South Africa
- Intelligent Buildings To Smooth GCC’s Path To Net Zero