Belgium Wet Glue Labels Market (2026-2032) | Restraints, Opportunities, Pricing Analysis, Investment Trends, Segments, Drivers, Supply, Competition, Segmentation, Outlook, Share, Demand, Growth, Analysis, Size, Strategic Insights, Revenue, Challenges, Industry, Forecast, Companies, Competitive, Consumer Insights, Trends, Strategy, Value
Market Forecast By Type (Paper Labels, Film Labels, Metallized Labels, Clear Labels, Others), By Material (Kraft Paper, Polypropylene, Aluminum Foil, PET, Custom Materials), By Adhesive Type (Starch-Based Adhesives, Resin-Based Adhesives, Protein-Based Adhesives, Gelatin-Based Adhesives, Eco-Friendly Adhesives), By End Use (Food and Beverage, Pharmaceuticals, Cosmetics, Luxury Packaging, Industrial Products), By End Use (Professional Tattooing, Tattoo Studios) And Competitive Landscape
| Product Code: ETC11268994 | Publication Date: Apr 2025 | Updated Date: Apr 2026 | Product Type: Market Research Report | |
| Publisher: 6Wresearch | Author: Bhawna Singh | No. of Pages: 65 | No. of Figures: 34 | No. of Tables: 19 |
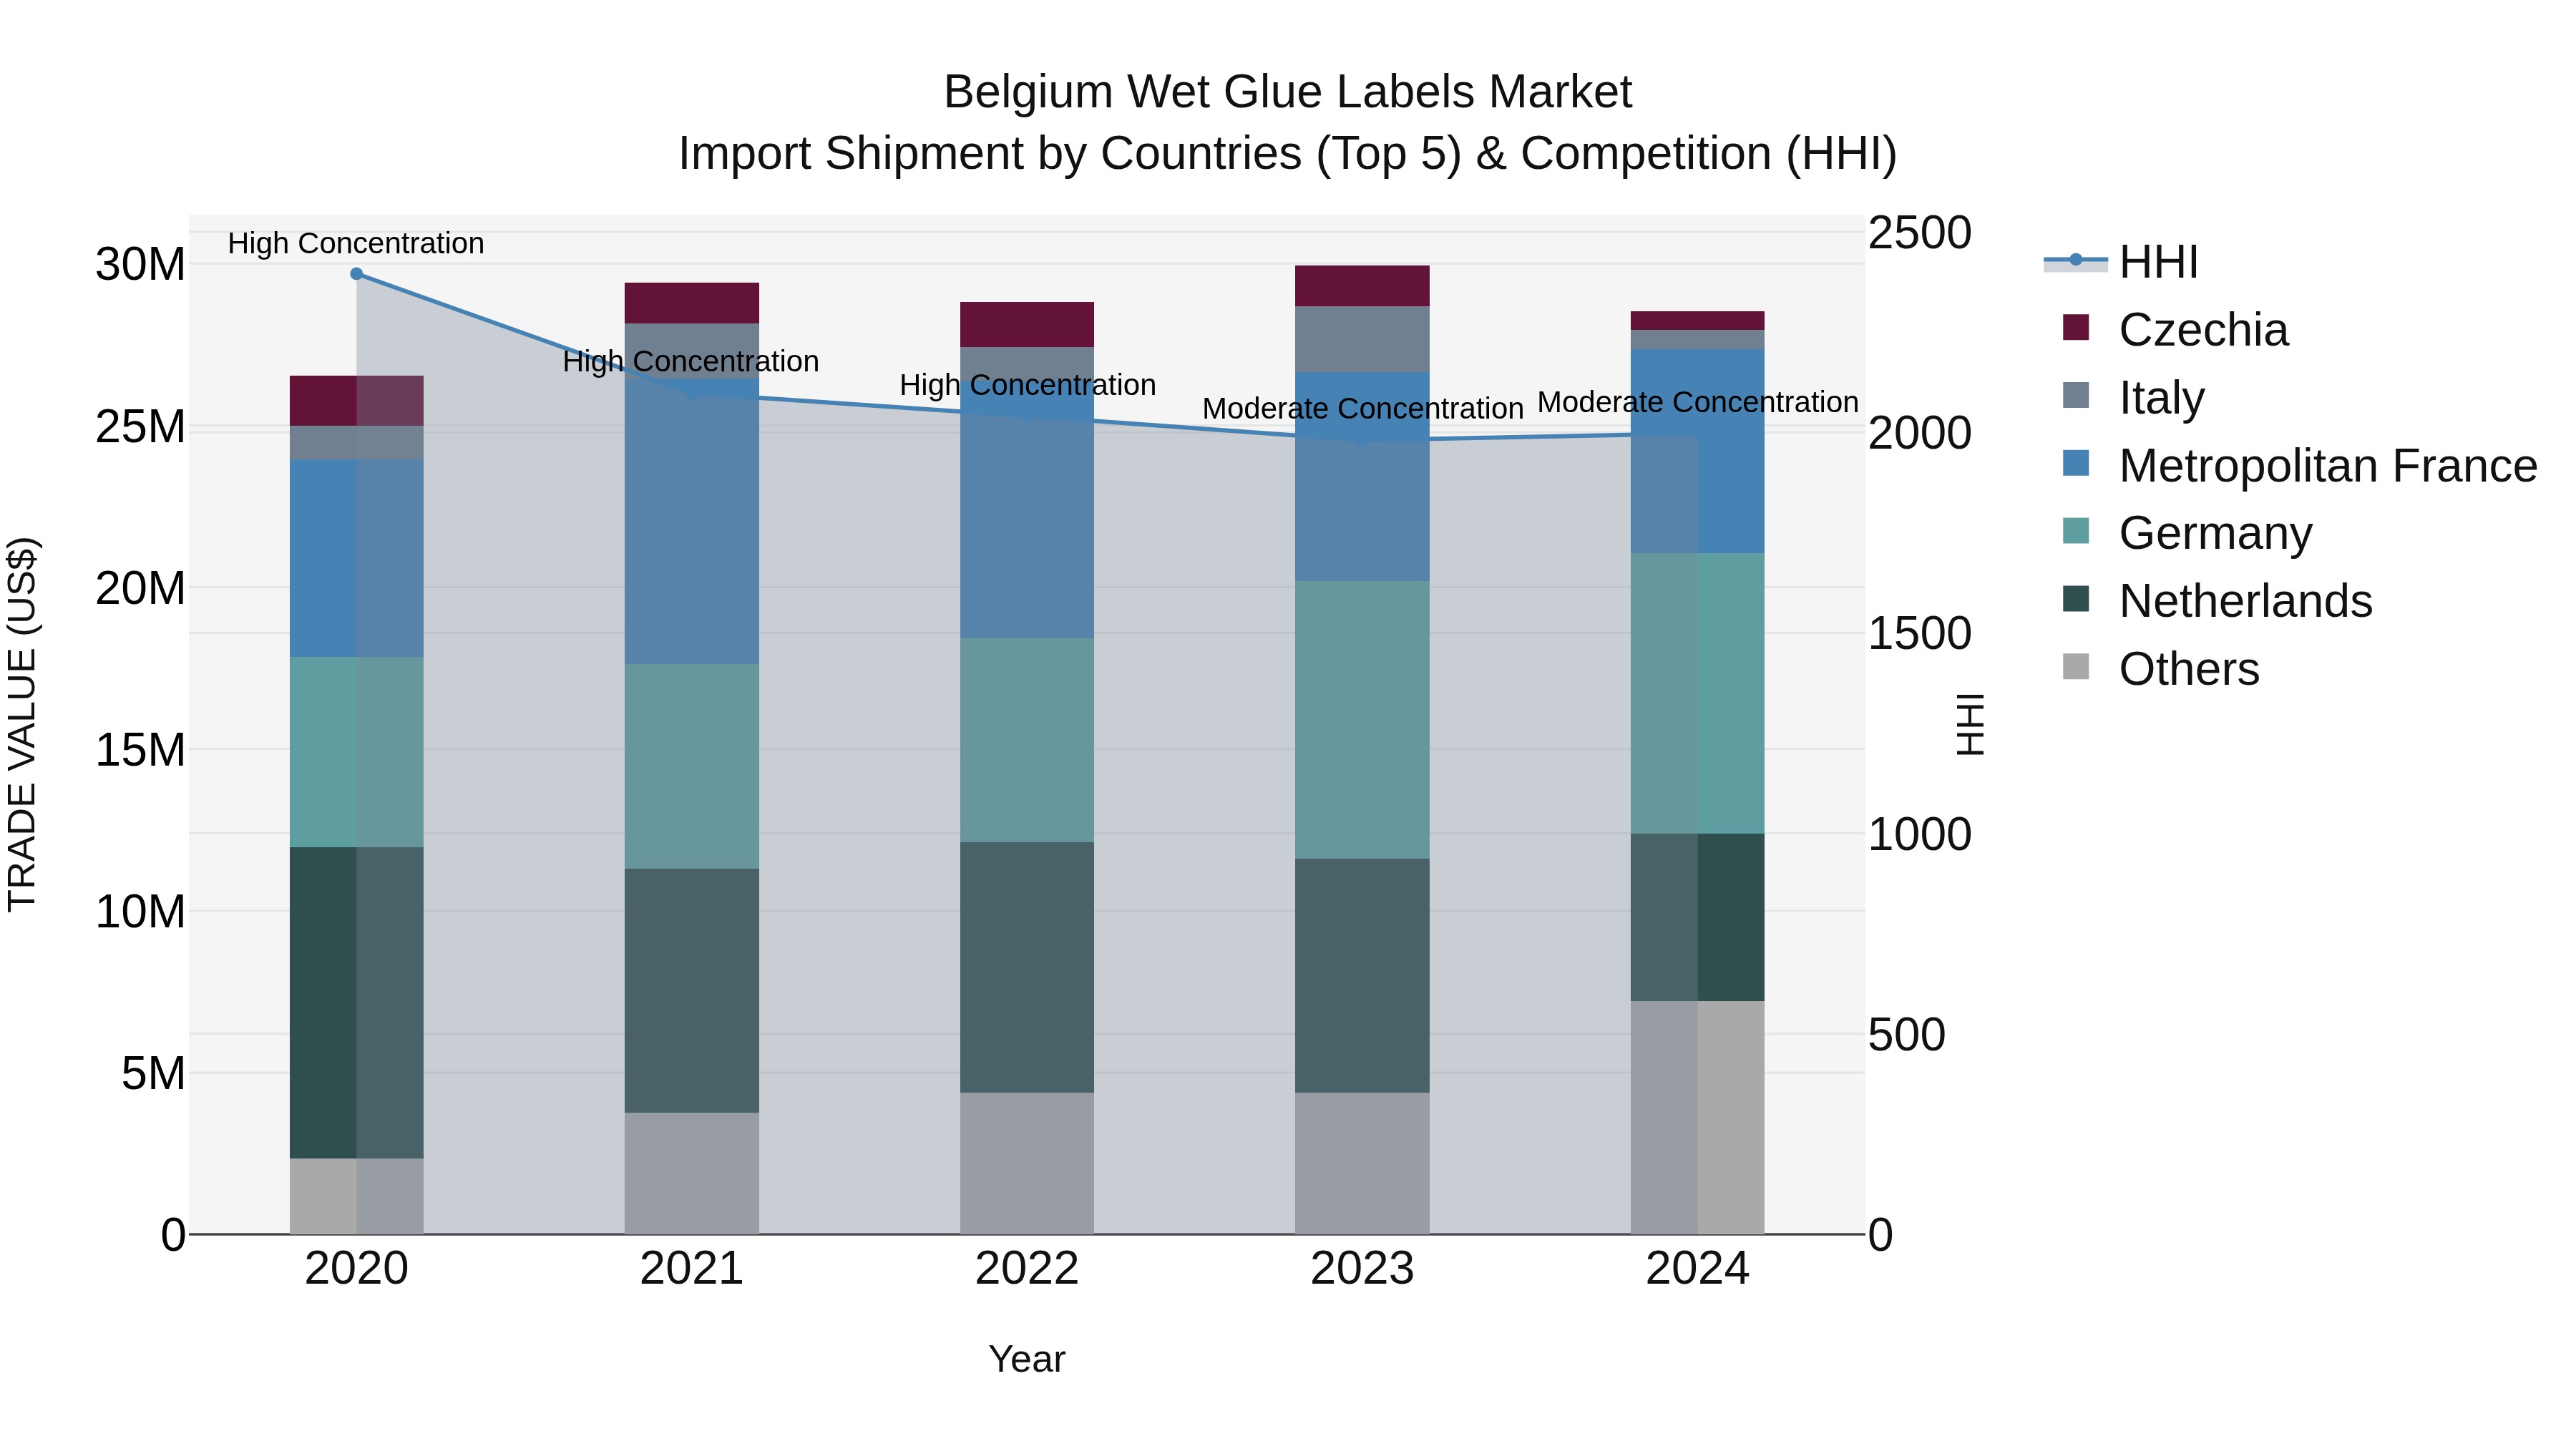
Belgium Wet Glue Labels Market Top 5 Importing Countries and Market Competition (HHI) Analysis
In 2024, Belgium continued to see steady growth in wet glue labels import shipments, with top exporters being Germany, Metropolitan France, Netherlands, Luxembourg, and China. The market maintained a moderate concentration level, indicating a competitive landscape. Despite a slight decline in growth rate from 2023 to 2024, the compound annual growth rate (CAGR) over the 2020-2024 period remained positive at 1.82%. This data suggests a stable market for wet glue labels in Belgium with key players from both within Europe and internationally contributing to the import market.
Key Highlights of the Report:
- Belgium Wet Glue Labels Market Outlook
- Market Size of Belgium Wet Glue Labels Market, 2025
- Forecast of Belgium Wet Glue Labels Market, 2032
- Historical Data and Forecast of Belgium Wet Glue Labels Revenues & Volume for the Period 2022 - 2032F
- Belgium Wet Glue Labels Market Trend Evolution
- Belgium Wet Glue Labels Market Drivers and Challenges
- Belgium Wet Glue Labels Price Trends
- Belgium Wet Glue Labels Porter's Five Forces
- Belgium Wet Glue Labels Industry Life Cycle
- Historical Data and Forecast of Belgium Wet Glue Labels Market Revenues & Volume By Type for the Period 2022 - 2032F
- Historical Data and Forecast of Belgium Wet Glue Labels Market Revenues & Volume By Paper Labels for the Period 2022 - 2032F
- Historical Data and Forecast of Belgium Wet Glue Labels Market Revenues & Volume By Film Labels for the Period 2022 - 2032F
- Historical Data and Forecast of Belgium Wet Glue Labels Market Revenues & Volume By Metallized Labels for the Period 2022 - 2032F
- Historical Data and Forecast of Belgium Wet Glue Labels Market Revenues & Volume By Clear Labels for the Period 2022 - 2032F
- Historical Data and Forecast of Belgium Wet Glue Labels Market Revenues & Volume By Others for the Period 2022 - 2032F
- Historical Data and Forecast of Belgium Wet Glue Labels Market Revenues & Volume By Material for the Period 2022 - 2032F
- Historical Data and Forecast of Belgium Wet Glue Labels Market Revenues & Volume By Kraft Paper for the Period 2022 - 2032F
- Historical Data and Forecast of Belgium Wet Glue Labels Market Revenues & Volume By Polypropylene for the Period 2022 - 2032F
- Historical Data and Forecast of Belgium Wet Glue Labels Market Revenues & Volume By Aluminum Foil for the Period 2022 - 2032F
- Historical Data and Forecast of Belgium Wet Glue Labels Market Revenues & Volume By PET for the Period 2022 - 2032F
- Historical Data and Forecast of Belgium Wet Glue Labels Market Revenues & Volume By Custom Materials for the Period 2022 - 2032F
- Historical Data and Forecast of Belgium Wet Glue Labels Market Revenues & Volume By Adhesive Type for the Period 2022 - 2032F
- Historical Data and Forecast of Belgium Wet Glue Labels Market Revenues & Volume By Starch-Based Adhesives for the Period 2022 - 2032F
- Historical Data and Forecast of Belgium Wet Glue Labels Market Revenues & Volume By Resin-Based Adhesives for the Period 2022 - 2032F
- Historical Data and Forecast of Belgium Wet Glue Labels Market Revenues & Volume By Protein-Based Adhesives for the Period 2022 - 2032F
- Historical Data and Forecast of Belgium Wet Glue Labels Market Revenues & Volume By Gelatin-Based Adhesives for the Period 2022 - 2032F
- Historical Data and Forecast of Belgium Wet Glue Labels Market Revenues & Volume By Eco-Friendly Adhesives for the Period 2022 - 2032F
- Historical Data and Forecast of Belgium Wet Glue Labels Market Revenues & Volume By End Use for the Period 2022 - 2032F
- Historical Data and Forecast of Belgium Wet Glue Labels Market Revenues & Volume By Food and Beverage for the Period 2022 - 2032F
- Historical Data and Forecast of Belgium Wet Glue Labels Market Revenues & Volume By Pharmaceuticals for the Period 2022 - 2032F
- Historical Data and Forecast of Belgium Wet Glue Labels Market Revenues & Volume By Cosmetics for the Period 2022 - 2032F
- Historical Data and Forecast of Belgium Wet Glue Labels Market Revenues & Volume By Luxury Packaging for the Period 2022 - 2032F
- Historical Data and Forecast of Belgium Wet Glue Labels Market Revenues & Volume By Industrial Products for the Period 2022 - 2032F
- Historical Data and Forecast of Belgium Wet Glue Labels Market Revenues & Volume By End Use for the Period 2022 - 2032F
- Historical Data and Forecast of Belgium Wet Glue Labels Market Revenues & Volume By Professional Tattooing for the Period 2022 - 2032F
- Historical Data and Forecast of Belgium Wet Glue Labels Market Revenues & Volume By Tattoo Studios for the Period 2022 - 2032F
- Belgium Wet Glue Labels Import Export Trade Statistics
- Market Opportunity Assessment By Type
- Market Opportunity Assessment By Material
- Market Opportunity Assessment By Adhesive Type
- Market Opportunity Assessment By End Use
- Market Opportunity Assessment By End Use
- Belgium Wet Glue Labels Top Companies Market Share
- Belgium Wet Glue Labels Competitive Benchmarking By Technical and Operational Parameters
- Belgium Wet Glue Labels Company Profiles
- Belgium Wet Glue Labels Key Strategic Recommendations
Frequently Asked Questions About the Market Study (FAQs):
6Wresearch actively monitors the Belgium Wet Glue Labels Market and publishes its comprehensive annual report, highlighting emerging trends, growth drivers, revenue analysis, and forecast outlook. Our insights help businesses to make data-backed strategic decisions with ongoing market dynamics. Our analysts track relevent industries related to the Belgium Wet Glue Labels Market, allowing our clients with actionable intelligence and reliable forecasts tailored to emerging regional needs.
Yes, we provide customisation as per your requirements. To learn more, feel free to contact us on sales@6wresearch.com
1 Executive Summary |
2 Introduction |
2.1 Key Highlights of the Report |
2.2 Report Description |
2.3 Market Scope & Segmentation |
2.4 Research Methodology |
2.5 Assumptions |
3 Belgium Wet Glue Labels Market Overview |
3.1 Belgium Country Macro Economic Indicators |
3.2 Belgium Wet Glue Labels Market Revenues & Volume, 2022 & 2032F |
3.3 Belgium Wet Glue Labels Market - Industry Life Cycle |
3.4 Belgium Wet Glue Labels Market - Porter's Five Forces |
3.5 Belgium Wet Glue Labels Market Revenues & Volume Share, By Type, 2022 & 2032F |
3.6 Belgium Wet Glue Labels Market Revenues & Volume Share, By Material, 2022 & 2032F |
3.7 Belgium Wet Glue Labels Market Revenues & Volume Share, By Adhesive Type, 2022 & 2032F |
3.8 Belgium Wet Glue Labels Market Revenues & Volume Share, By End Use, 2022 & 2032F |
4 Belgium Wet Glue Labels Market Dynamics |
4.1 Impact Analysis |
4.2 Market Drivers |
4.2.1 Increasing demand for sustainable packaging solutions |
4.2.2 Growing popularity of craft beers and premium spirits leading to higher demand for wet glue labels |
4.2.3 Technological advancements in label printing and application processes |
4.3 Market Restraints |
4.3.1 Rising raw material costs impacting profit margins |
4.3.2 Competition from alternative labeling solutions such as pressure-sensitive labels |
4.3.3 Stringent regulations related to labeling and packaging materials |
5 Belgium Wet Glue Labels Market Trends |
6 Belgium Wet Glue Labels Market, By Types |
6.1 Belgium Wet Glue Labels Market, By Type |
6.1.1 Overview and Analysis |
6.1.2 Belgium Wet Glue Labels Market Revenues & Volume, By Type, 2022 - 2032F |
6.1.3 Belgium Wet Glue Labels Market Revenues & Volume, By Paper Labels, 2022 - 2032F |
6.1.4 Belgium Wet Glue Labels Market Revenues & Volume, By Film Labels, 2022 - 2032F |
6.1.5 Belgium Wet Glue Labels Market Revenues & Volume, By Metallized Labels, 2022 - 2032F |
6.1.6 Belgium Wet Glue Labels Market Revenues & Volume, By Clear Labels, 2022 - 2032F |
6.1.7 Belgium Wet Glue Labels Market Revenues & Volume, By Others, 2022 - 2032F |
6.2 Belgium Wet Glue Labels Market, By Material |
6.2.1 Overview and Analysis |
6.2.2 Belgium Wet Glue Labels Market Revenues & Volume, By Kraft Paper, 2022 - 2032F |
6.2.3 Belgium Wet Glue Labels Market Revenues & Volume, By Polypropylene, 2022 - 2032F |
6.2.4 Belgium Wet Glue Labels Market Revenues & Volume, By Aluminum Foil, 2022 - 2032F |
6.2.5 Belgium Wet Glue Labels Market Revenues & Volume, By PET, 2022 - 2032F |
6.2.6 Belgium Wet Glue Labels Market Revenues & Volume, By Custom Materials, 2022 - 2032F |
6.3 Belgium Wet Glue Labels Market, By Adhesive Type |
6.3.1 Overview and Analysis |
6.3.2 Belgium Wet Glue Labels Market Revenues & Volume, By Starch-Based Adhesives, 2022 - 2032F |
6.3.3 Belgium Wet Glue Labels Market Revenues & Volume, By Resin-Based Adhesives, 2022 - 2032F |
6.3.4 Belgium Wet Glue Labels Market Revenues & Volume, By Protein-Based Adhesives, 2022 - 2032F |
6.3.5 Belgium Wet Glue Labels Market Revenues & Volume, By Gelatin-Based Adhesives, 2022 - 2032F |
6.3.6 Belgium Wet Glue Labels Market Revenues & Volume, By Eco-Friendly Adhesives, 2022 - 2032F |
6.4 Belgium Wet Glue Labels Market, By End Use |
6.4.1 Overview and Analysis |
6.4.2 Belgium Wet Glue Labels Market Revenues & Volume, By Food and Beverage, 2022 - 2032F |
6.4.3 Belgium Wet Glue Labels Market Revenues & Volume, By Pharmaceuticals, 2022 - 2032F |
6.4.4 Belgium Wet Glue Labels Market Revenues & Volume, By Cosmetics, 2022 - 2032F |
6.4.5 Belgium Wet Glue Labels Market Revenues & Volume, By Luxury Packaging, 2022 - 2032F |
6.4.6 Belgium Wet Glue Labels Market Revenues & Volume, By Industrial Products, 2022 - 2032F |
7 Belgium Wet Glue Labels Market Import-Export Trade Statistics |
7.1 Belgium Wet Glue Labels Market Export to Major Countries |
7.2 Belgium Wet Glue Labels Market Imports from Major Countries |
8 Belgium Wet Glue Labels Market Key Performance Indicators |
8.1 Percentage of companies adopting eco-friendly labeling solutions |
8.2 Number of new product launches in the craft beer and spirits industry |
8.3 Investment in RD for label printing technologies and automation |
9 Belgium Wet Glue Labels Market - Opportunity Assessment |
9.1 Belgium Wet Glue Labels Market Opportunity Assessment, By Type, 2022 & 2032F |
9.2 Belgium Wet Glue Labels Market Opportunity Assessment, By Material, 2022 & 2032F |
9.3 Belgium Wet Glue Labels Market Opportunity Assessment, By Adhesive Type, 2022 & 2032F |
9.4 Belgium Wet Glue Labels Market Opportunity Assessment, By End Use, 2022 & 2032F |
10 Belgium Wet Glue Labels Market - Competitive Landscape |
10.1 Belgium Wet Glue Labels Market Revenue Share, By Companies, 2025 |
10.2 Belgium Wet Glue Labels Market Competitive Benchmarking, By Operating and Technical Parameters |
11 Company Profiles |
12 Recommendations |
13 Disclaimer |
Export potential assessment - trade Analytics for 2030
Export potential enables firms to identify high-growth global markets with greater confidence by combining advanced trade intelligence with a structured quantitative methodology. The framework analyzes emerging demand trends and country-level import patterns while integrating macroeconomic and trade datasets such as GDP and population forecasts, bilateral import–export flows, tariff structures, elasticity differentials between developed and developing economies, geographic distance, and import demand projections. Using weighted trade values from 2020–2024 as the base period to project country-to-country export potential for 2030, these inputs are operationalized through calculated drivers such as gravity model parameters, tariff impact factors, and projected GDP per-capita growth. Through an analysis of hidden potentials, demand hotspots, and market conditions that are most favorable to success, this method enables firms to focus on target countries, maximize returns, and global expansion with data, backed by accuracy.
By factoring in the projected importer demand gap that is currently unmet and could be potential opportunity, it identifies the potential for the Exporter (Country) among 190 countries, against the general trade analysis, which identifies the biggest importer or exporter.
To discover high-growth global markets and optimize your business strategy:
Click Here
Pricing
- Single User License$ 1,995
- Department License$ 2,400
- Site License$ 3,120
- Global License$ 3,795

Thought Leadership
Search
Thought Leadership and Analyst Meet


Our Clients
Latest Reports
- New Zealand Aseptic Manufacturing Market (2026-2032)
- Netherlands Aseptic Manufacturing Market (2026-2032)
- Nauru Aseptic Manufacturing Market (2026-2032)
- Namibia Aseptic Manufacturing Market (2026-2032)
- Mozambique Aseptic Manufacturing Market (2026-2032)
- Montenegro Aseptic Manufacturing Market (2026-2032)
- Mongolia Aseptic Manufacturing Market (2026-2032)
- Monaco Aseptic Manufacturing Market (2026-2032)
- Micronesia Aseptic Manufacturing Market (2026-2032)
- Mauritius Aseptic Manufacturing Market (2026-2032)
Industry Events and Analyst Meet

HIMTEX 2026

India Refining Summit 2026

India EV Show 2026

EV tech India Expo 2026

Auto Tech Asia 2026
Whitepaper
- Middle East & Africa Commercial Security Market Click here to view more.
- Middle East & Africa Fire Safety Systems & Equipment Market Click here to view more.
- GCC Drone Market Click here to view more.
- Middle East Lighting Fixture Market Click here to view more.
- GCC Physical & Perimeter Security Market Click here to view more.
6WResearch In News
- Doha a strategic location for EV manufacturing hub: IPA Qatar
- Demand for luxury TVs surging in the GCC, says Samsung
- Empowering Growth: The Thriving Journey of Bangladesh’s Cable Industry
- Demand for luxury TVs surging in the GCC, says Samsung
- Video call with a traditional healer? Once unthinkable, it’s now common in South Africa
- Intelligent Buildings To Smooth GCC’s Path To Net Zero