Brazil Inorganic Pigments Market (2026-2032) Outlook | Value, Companies, Share, Forecast, Analysis, Growth, Revenue, Industry, Trends & Size
Market Forecast By Type (Titanium Dioxide, Iron Oxide, Cadmium, Carbon Blank, Lead Chromate, Chromium Oxide, Others), By Colour (Red, Yellow, Orange, Green, Blue, Black, White, Others), By Chemistry (Oxide, Silicate, Carbonate, Sulphate, Sulphide, Others), By Grade (Food Grade, Pharmaceutical Grade, Industrial Grade, Others), By Form (Powder, Liquid), By Application (Plastics, Paints & Coatings, Printing Inks, Glass & Ceramics, Cosmetics, Paper Industry, Food Industry, Others) And Competitive Landscape
| Product Code: ETC190514 | Publication Date: May 2022 | Updated Date: Jun 2026 | Product Type: Market Research Report | |
| Publisher: 6Wresearch | Author: Ravi Bhandari | No. of Pages: 60 | No. of Figures: 40 | No. of Tables: 7 |
Brazil Inorganic Pigments Market Size, Share & Growth Rate
The Brazil Inorganic Pigments Market was estimated at USD 245 Million in 2025 and is projected to reach USD 292 Million by 2032, growing at a CAGR of 2.5% from 2026 to 2032. This steady growth trajectory is primarily driven by the robust expansion of the paints and coatings industry, which is closely tied to ongoing urbanization and extensive renovation projects across Brazil. Additionally, increasing construction activities and rising automotive production are bolstering demand, as consumers seek durable and high-quality pigmentation solutions.
Brazil Inorganic Pigments Market Year-wise Growth Rate and Key Drivers
This graph highlights how the Brazil Inorganic Pigments Market has steadily grown over the years, supported by major growth factors.
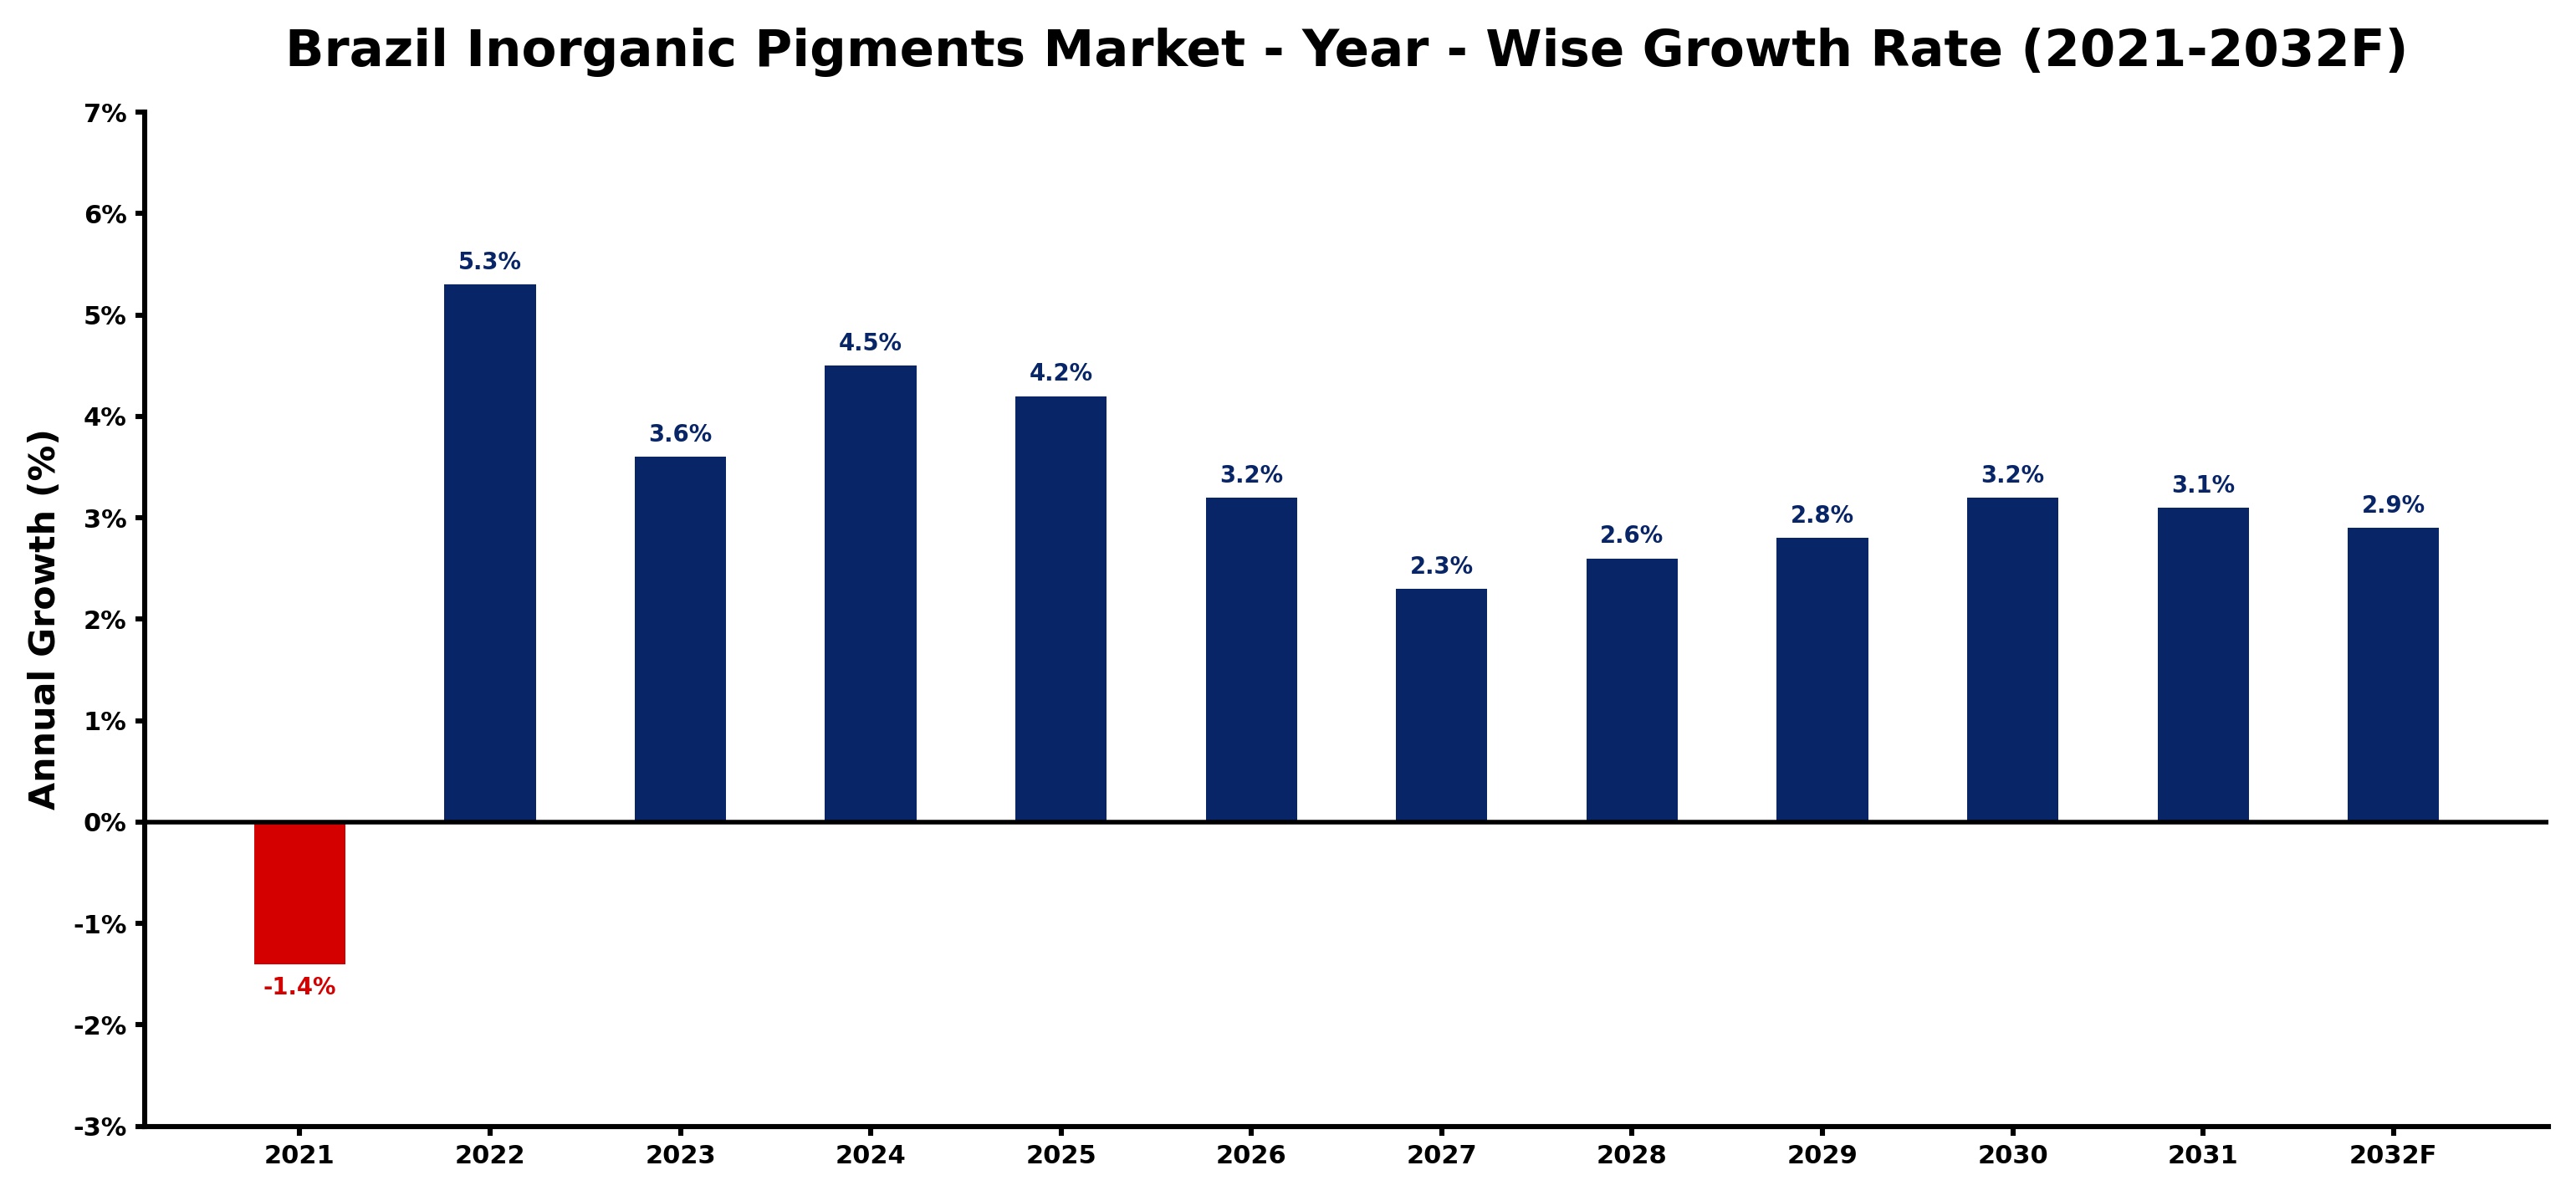
The table below presents the year‑wise growth rates along with the key drivers influencing the market
| Year | Growth Rate | Major Drivers |
| 2021 | -1.4% | Raw material prices limited production |
| 2022 | 5.3% | Construction sector recovery stimulated demand |
| 2023 | 3.6% | Automotive industry growth increased usage |
| 2024 | 4.5% | Coatings market expansion drove sales |
| 2025 | 4.2% | Infrastructure projects boosted consumption |
| 2026 | 3.2% | Sustainable product trends gained traction |
| 2027 | 2.3% | Consumer preference for quality increased |
| 2028 | 2.6% | Technological advancements enhanced efficiency |
| 2029 | 2.8% | Export opportunities expanded market reach |
| 2030 | 3.2% | Regulatory support encouraged innovation |
| 2031 | 3.1% | Artisanal products gained market share |
| 2032 | 2.9% | Collaborations with manufacturers strengthened |
Note - Market size estimations and growth projections presented in this report are based on 6Wresearch’s advanced forecasting approach, validated with industry datasets as of June 2026.
Brazil Inorganic Pigments Market Synopsis
A significant demand driver in the Brazil Inorganic Pigments Market is the increased usage of pigments in the construction sector, particularly for decorative coatings. As urban spaces evolve, there is a marked preference for vibrant and long-lasting colors in both residential and commercial properties.
Moreover, with a strong push towards sustainability, manufacturers are exploring innovative formulations that adhere to environmental regulations while still delivering performance. The combination of regulatory compliance and consumer preference for eco-friendly products is reshaping how pigments are sourced and utilized.
Brazil Inorganic Pigments Market Key Takeaways
- The market is experiencing steady growth, driven by the resurgence of construction and automotive sectors.
- Shifts in consumer preference toward sustainable and environmentally friendly pigments are notable.
- Regulatory frameworks are becoming increasingly stringent, impacting the production and sourcing of pigments.
- Domestic policies are aimed at fostering local production, thereby reducing reliance on imports.
- Innovation in pigment formulations is essential for staying competitive in an evolving market landscape.
Evaluation of Restraints in Brazil Inorganic Pigments Market
Despite the positive growth outlook, the Brazil Inorganic Pigments Market faces several significant restraints. A major concern is the dependence on imported raw materials, which exposes producers to supply chain vulnerabilities and fluctuating prices. This can lead to heightened production costs and affect overall profitability. Additionally, compliance with strict regulatory measures—particularly concerning heavy metal content—demands resources that can complicate operations. The market must also navigate the challenge of adapting to evolving consumer preferences for greener alternatives, which requires innovation and investment.
Brazil Inorganic Pigments Market Trends
The trend towards sustainability is accelerating, with manufacturers increasingly focusing on the development of eco-friendly pigments. This includes the exploration of bio-based alternatives that align with consumer values and regulatory demands. Furthermore, advancements in technology are enabling improved pigment performance, enhancing durability and color retention, which are crucial for competitive positioning. There is also an observable shift towards digital color matching technologies, making it easier for clients in various sectors to achieve precise colors.
Brazil Inorganic Pigments Market Opportunities
Opportunities for growth in the Brazil Inorganic Pigments Market lie in the expanding construction and automotive industries, which continue to evolve. As urbanization progresses, there is an increasing demand for innovative and aesthetically pleasing coatings. Moreover, tapping into renewable and sustainable pigment solutions presents an avenue for differentiation in a crowded marketplace. Investment in research and development to create advanced products that cater to specific consumer demands can also provide a competitive edge.
Government Initiatives in the Brazil Inorganic Pigments Market
The Brazilian government is actively supporting the inorganic pigments market through various initiatives aimed at enhancing local production capabilities. Policies include offering tax incentives for investments in domestic manufacturing facilities, which aims to bolster local industries and minimize reliance on imports. Additionally, there is a concerted effort to prioritize sustainability, aligning domestic production methods with international environmental standards, which is crucial for both market growth and global competitiveness.
Future Insights of the Brazil Inorganic Pigments Market
Looking ahead to the 2026-2032 period, the Brazil Inorganic Pigments Market is poised for a transformative phase. The anticipated growth of urban infrastructure and the push for greener alternatives will drive demand for innovative pigment solutions. With ongoing government support and a commitment to sustainability, manufacturers that invest in modern technologies and eco-friendly practices will likely outperform competitors. This period will also see enhanced collaboration between industry players to navigate challenges and leverage growth opportunities in a dynamic marketplace.
Brazil Inorganic Pigments Market Latest Developments (May 2025 - June 2026)
Recent developments in the Brazil Inorganic Pigments Market have focused on enhancing production efficiencies and meeting stringent environmental standards. Companies are adopting new technologies to reduce waste and improve the sustainability of their operations. Moreover, there is a growing emphasis on collaborations within the industry to promote innovation in pigment formulations, ensuring that products meet the evolving expectations of consumers and regulatory bodies alike. These efforts reflect a broader commitment to aligning market practices with sustainability goals.
Brazil Inorganic Pigments Market - Key Attractiveness of the Report
- 10 Years of Market Numbers
- Historical Data Starting from 2022 to 2025
- Base Year: 2025
- Forecast Data until 2032
- Key Performance Indicators Impacting the Market
- Major Upcoming Developments and Projects
Key Highlights of the Report:
- Brazil Inorganic Pigments Market Outlook
- Market Size of Brazil Inorganic Pigments Market, 2025
- Forecast of Brazil Inorganic Pigments Market, 2032
- Historical Data and Forecast of Brazil Inorganic Pigments Revenues & Volume for the Period 2022-2032F
- Brazil Inorganic Pigments Market Trend Evolution
- Brazil Inorganic Pigments Market Drivers and Challenges
- Brazil Inorganic Pigments Price Trends
- Brazil Inorganic Pigments Porter's Five Forces
- Brazil Inorganic Pigments Industry Life Cycle
- Historical Data and Forecast of Brazil Inorganic Pigments Market Revenues & Volume By Type for the Period 2022-2032F
- Historical Data and Forecast of Brazil Inorganic Pigments Market Revenues & Volume By Titanium Dioxide for the Period 2022-2032F
- Historical Data and Forecast of Brazil Inorganic Pigments Market Revenues & Volume By Iron Oxide, Cadmium for the Period 2022-2032F
- Historical Data and Forecast of Brazil Inorganic Pigments Market Revenues & Volume By Carbon Blank for the Period 2022-2032F
- Historical Data and Forecast of Brazil Inorganic Pigments Market Revenues & Volume By Lead Chromate for the Period 2022-2032F
- Historical Data and Forecast of Brazil Inorganic Pigments Market Revenues & Volume By Chromium Oxide for the Period 2022-2032F
- Historical Data and Forecast of Brazil Inorganic Pigments Market Revenues & Volume By Others for the Period 2022-2032F
- Historical Data and Forecast of Brazil Inorganic Pigments Market Revenues & Volume By Colour for the Period 2022-2032F
- Historical Data and Forecast of Brazil Inorganic Pigments Market Revenues & Volume By Red for the Period 2022-2032F
- Historical Data and Forecast of Brazil Inorganic Pigments Market Revenues & Volume By Yellow for the Period 2022-2032F
- Historical Data and Forecast of Brazil Inorganic Pigments Market Revenues & Volume By Orange for the Period 2022-2032F
- Historical Data and Forecast of Brazil Inorganic Pigments Market Revenues & Volume By Green for the Period 2022-2032F
- Historical Data and Forecast of Brazil Inorganic Pigments Market Revenues & Volume By Blue for the Period 2022-2032F
- Historical Data and Forecast of Brazil Inorganic Pigments Market Revenues & Volume By Black for the Period 2022-2032F
- Historical Data and Forecast of Brazil Inorganic Pigments Market Revenues & Volume By White for the Period 2022-2032F
- Historical Data and Forecast of Brazil Inorganic Pigments Market Revenues & Volume By Others for the Period 2022-2032F
- Historical Data and Forecast of Brazil Inorganic Pigments Market Revenues & Volume By Chemistry for the Period 2022-2032F
- Historical Data and Forecast of Brazil Inorganic Pigments Market Revenues & Volume By Oxide for the Period 2022-2032F
- Historical Data and Forecast of Brazil Inorganic Pigments Market Revenues & Volume By Silicate for the Period 2022-2032F
- Historical Data and Forecast of Brazil Inorganic Pigments Market Revenues & Volume By Carbonate for the Period 2022-2032F
- Historical Data and Forecast of Brazil Inorganic Pigments Market Revenues & Volume By Sulphate for the Period 2022-2032F
- Historical Data and Forecast of Brazil Inorganic Pigments Market Revenues & Volume By Sulphide for the Period 2022-2032F
- Historical Data and Forecast of Brazil Inorganic Pigments Market Revenues & Volume By Others for the Period 2022-2032F
- Historical Data and Forecast of Brazil Inorganic Pigments Market Revenues & Volume By Grade for the Period 2022-2032F
- Historical Data and Forecast of Brazil Inorganic Pigments Market Revenues & Volume By Food Grade for the Period 2022-2032F
- Historical Data and Forecast of Brazil Inorganic Pigments Market Revenues & Volume By Pharmaceutical Grade for the Period 2022-2032F
- Historical Data and Forecast of Brazil Inorganic Pigments Market Revenues & Volume By Industrial Grade for the Period 2022-2032F
- Historical Data and Forecast of Brazil Inorganic Pigments Market Revenues & Volume By Others for the Period 2022-2032F
- Historical Data and Forecast of Brazil Inorganic Pigments Market Revenues & Volume By Form for the Period 2022-2032F
- Historical Data and Forecast of Brazil Inorganic Pigments Market Revenues & Volume By Powder for the Period 2022-2032F
- Historical Data and Forecast of Brazil Inorganic Pigments Market Revenues & Volume By Liquid for the Period 2022-2032F
- Historical Data and Forecast of Brazil Inorganic Pigments Market Revenues & Volume By Application for the Period 2022-2032F
- Historical Data and Forecast of Brazil Inorganic Pigments Market Revenues & Volume By Plastics for the Period 2022-2032F
- Historical Data and Forecast of Brazil Inorganic Pigments Market Revenues & Volume By Paints & Coatings for the Period 2022-2032F
- Historical Data and Forecast of Brazil Inorganic Pigments Market Revenues & Volume By Printing Inks for the Period 2022-2032F
- Historical Data and Forecast of Brazil Inorganic Pigments Market Revenues & Volume By Glass & Ceramics for the Period 2022-2032F
- Historical Data and Forecast of Brazil Inorganic Pigments Market Revenues & Volume By Cosmetics for the Period 2022-2032F
- Historical Data and Forecast of Brazil Inorganic Pigments Market Revenues & Volume By Paper Industry for the Period 2022-2032F
- Historical Data and Forecast of Brazil Inorganic Pigments Market Revenues & Volume By Food Industry for the Period 2022-2032F
- Historical Data and Forecast of Brazil Inorganic Pigments Market Revenues & Volume By Others for the Period 2022-2032F
- Brazil Inorganic Pigments Import Export Trade Statistics
- Market Opportunity Assessment By Type
- Market Opportunity Assessment By Colour
- Market Opportunity Assessment By Chemistry
- Market Opportunity Assessment By Grade
- Market Opportunity Assessment By Form
- Market Opportunity Assessment By Application
- Brazil Inorganic Pigments Top Companies Market Share
- Brazil Inorganic Pigments Competitive Benchmarking By Technical and Operational Parameters
- Brazil Inorganic Pigments Company Profiles
- Brazil Inorganic Pigments Key Strategic Recommendations
Brazil Inorganic Pigments Market - Frequently Asked Questions
Growth is driven primarily by rising demand in the paints and coatings sector, boosted by ongoing urbanization and construction activities across Brazil.
The market was estimated at USD 245 Million in 2025 and is anticipated to reach USD 292 Million by 2032, growing at a CAGR of 2.5% from 2026 to 2032.
Manufacturers must navigate increasingly stringent regulations concerning heavy metal content and environmental impact, which can complicate sourcing and operational processes.
Inorganic pigments are extensively utilized in various applications, including paints and coatings, plastics, ceramics, and construction materials, reflecting their versatility.
Key trends include a shift towards eco-friendly pigments, advances in technology for better durability, and the integration of digital color matching technologies to meet consumer demands.
6Wresearch actively monitors the Brazil Inorganic Pigments Market and publishes its comprehensive annual report, highlighting emerging trends, growth drivers, revenue analysis, and forecast outlook. Our insights help businesses to make data-backed strategic decisions with ongoing market dynamics. Our analysts track relevent industries related to the Brazil Inorganic Pigments Market, allowing our clients with actionable intelligence and reliable forecasts tailored to emerging regional needs.
Yes, we provide customisation as per your requirements. To learn more, feel free to contact us on sales@6wresearch.com
1 Executive Summary |
2 Introduction |
2.1 Key Highlights of the Report |
2.2 Report Description |
2.3 Market Scope & Segmentation |
2.4 Research Methodology |
2.5 Assumptions |
3 Brazil Inorganic Pigments Market Overview |
3.1 Brazil Country Macro Economic Indicators |
3.2 Brazil Inorganic Pigments Market Revenues & Volume, 2022 & 2032F |
3.3 Brazil Inorganic Pigments Market - Industry Life Cycle |
3.4 Brazil Inorganic Pigments Market - Porter's Five Forces |
3.5 Brazil Inorganic Pigments Market Revenues & Volume Share, By Type, 2022 & 2032F |
3.6 Brazil Inorganic Pigments Market Revenues & Volume Share, By Colour, 2022 & 2032F |
3.7 Brazil Inorganic Pigments Market Revenues & Volume Share, By Chemistry, 2022 & 2032F |
3.8 Brazil Inorganic Pigments Market Revenues & Volume Share, By Grade, 2022 & 2032F |
3.9 Brazil Inorganic Pigments Market Revenues & Volume Share, By Form, 2022 & 2032F |
3.10 Brazil Inorganic Pigments Market Revenues & Volume Share, By Application, 2022 & 2032F |
4 Brazil Inorganic Pigments Market Dynamics |
4.1 Impact Analysis |
4.2 Market Drivers |
4.2.1 Growing demand from end-user industries such as construction, automotive, and packaging |
4.2.2 Technological advancements leading to improved product quality and performance |
4.2.3 Increasing investments in research and development for new product development |
4.3 Market Restraints |
4.3.1 Volatility in raw material prices affecting production costs |
4.3.2 Environmental regulations impacting manufacturing processes |
4.3.3 Intense market competition leading to pricing pressures |
5 Brazil Inorganic Pigments Market Trends |
6 Brazil Inorganic Pigments Market, By Types |
6.1 Brazil Inorganic Pigments Market, By Type |
6.1.1 Overview and Analysis |
6.1.2 Brazil Inorganic Pigments Market Revenues & Volume, By Type, 2022-2032F |
6.1.3 Brazil Inorganic Pigments Market Revenues & Volume, By Titanium Dioxide, 2022-2032F |
6.1.4 Brazil Inorganic Pigments Market Revenues & Volume, By Iron Oxide, Cadmium, 2022-2032F |
6.1.5 Brazil Inorganic Pigments Market Revenues & Volume, By Carbon Blank, 2022-2032F |
6.1.6 Brazil Inorganic Pigments Market Revenues & Volume, By Lead Chromate, 2022-2032F |
6.1.7 Brazil Inorganic Pigments Market Revenues & Volume, By Chromium Oxide, 2022-2032F |
6.1.8 Brazil Inorganic Pigments Market Revenues & Volume, By Others, 2022-2032F |
6.2 Brazil Inorganic Pigments Market, By Colour |
6.2.1 Overview and Analysis |
6.2.2 Brazil Inorganic Pigments Market Revenues & Volume, By Red, 2022-2032F |
6.2.3 Brazil Inorganic Pigments Market Revenues & Volume, By Yellow, 2022-2032F |
6.2.4 Brazil Inorganic Pigments Market Revenues & Volume, By Orange, 2022-2032F |
6.2.5 Brazil Inorganic Pigments Market Revenues & Volume, By Green, 2022-2032F |
6.2.6 Brazil Inorganic Pigments Market Revenues & Volume, By Blue, 2022-2032F |
6.2.7 Brazil Inorganic Pigments Market Revenues & Volume, By Black, 2022-2032F |
6.2.8 Brazil Inorganic Pigments Market Revenues & Volume, By Others, 2022-2032F |
6.2.9 Brazil Inorganic Pigments Market Revenues & Volume, By Others, 2022-2032F |
6.3 Brazil Inorganic Pigments Market, By Chemistry |
6.3.1 Overview and Analysis |
6.3.2 Brazil Inorganic Pigments Market Revenues & Volume, By Oxide, 2022-2032F |
6.3.3 Brazil Inorganic Pigments Market Revenues & Volume, By Silicate, 2022-2032F |
6.3.4 Brazil Inorganic Pigments Market Revenues & Volume, By Carbonate, 2022-2032F |
6.3.5 Brazil Inorganic Pigments Market Revenues & Volume, By Sulphate, 2022-2032F |
6.3.6 Brazil Inorganic Pigments Market Revenues & Volume, By Sulphide, 2022-2032F |
6.3.7 Brazil Inorganic Pigments Market Revenues & Volume, By Others, 2022-2032F |
6.4 Brazil Inorganic Pigments Market, By Grade |
6.4.1 Overview and Analysis |
6.4.2 Brazil Inorganic Pigments Market Revenues & Volume, By Food Grade, 2022-2032F |
6.4.3 Brazil Inorganic Pigments Market Revenues & Volume, By Pharmaceutical Grade, 2022-2032F |
6.4.4 Brazil Inorganic Pigments Market Revenues & Volume, By Industrial Grade, 2022-2032F |
6.4.5 Brazil Inorganic Pigments Market Revenues & Volume, By Others, 2022-2032F |
6.5 Brazil Inorganic Pigments Market, By Form |
6.5.1 Overview and Analysis |
6.5.2 Brazil Inorganic Pigments Market Revenues & Volume, By Powder, 2022-2032F |
6.5.3 Brazil Inorganic Pigments Market Revenues & Volume, By Liquid, 2022-2032F |
6.6 Brazil Inorganic Pigments Market, By Application |
6.6.1 Overview and Analysis |
6.6.2 Brazil Inorganic Pigments Market Revenues & Volume, By Plastics, 2022-2032F |
6.6.3 Brazil Inorganic Pigments Market Revenues & Volume, By Paints & Coatings, 2022-2032F |
6.6.4 Brazil Inorganic Pigments Market Revenues & Volume, By Printing Inks, 2022-2032F |
6.6.5 Brazil Inorganic Pigments Market Revenues & Volume, By Glass & Ceramics, 2022-2032F |
6.6.6 Brazil Inorganic Pigments Market Revenues & Volume, By Cosmetics, 2022-2032F |
6.6.7 Brazil Inorganic Pigments Market Revenues & Volume, By Paper Industry, 2022-2032F |
6.6.8 Brazil Inorganic Pigments Market Revenues & Volume, By Others, 2022-2032F |
6.6.9 Brazil Inorganic Pigments Market Revenues & Volume, By Others, 2022-2032F |
7 Brazil Inorganic Pigments Market Import-Export Trade Statistics |
7.1 Brazil Inorganic Pigments Market Export to Major Countries |
7.2 Brazil Inorganic Pigments Market Imports from Major Countries |
8 Brazil Inorganic Pigments Market Key Performance Indicators |
8.1 Percentage of revenue from new product launches |
8.2 Number of patents filed for innovative pigment technologies |
8.3 Percentage of sales from sustainable and environmentally friendly pigments |
8.4 Research and development expenditure as a percentage of total revenue |
9 Brazil Inorganic Pigments Market - Opportunity Assessment |
9.1 Brazil Inorganic Pigments Market Opportunity Assessment, By Type, 2022 & 2032F |
9.2 Brazil Inorganic Pigments Market Opportunity Assessment, By Colour, 2022 & 2032F |
9.3 Brazil Inorganic Pigments Market Opportunity Assessment, By Chemistry, 2022 & 2032F |
9.4 Brazil Inorganic Pigments Market Opportunity Assessment, By Grade, 2022 & 2032F |
9.5 Brazil Inorganic Pigments Market Opportunity Assessment, By Form, 2022 & 2032F |
9.6 Brazil Inorganic Pigments Market Opportunity Assessment, By Application, 2022 & 2032F |
10 Brazil Inorganic Pigments Market - Competitive Landscape |
10.1 Brazil Inorganic Pigments Market Revenue Share, By Companies, 2025 |
10.2 Brazil Inorganic Pigments Market Competitive Benchmarking, By Operating and Technical Parameters |
11 Company Profiles |
12 Recommendations |
13 Disclaimer |
Global Go To Market Strategy - 2030
Export potential enables firms to identify high-growth global markets with greater confidence by combining advanced trade intelligence with a structured quantitative methodology. The framework analyzes emerging demand trends and country-level import patterns while integrating macroeconomic and trade datasets such as GDP and population forecasts, bilateral import–export flows, tariff structures, elasticity differentials between developed and developing economies, geographic distance, and import demand projections. Using weighted trade values from 2020–2024 as the base period to project country-to-country export potential for 2030, these inputs are operationalized through calculated drivers such as gravity model parameters, tariff impact factors, and projected GDP per-capita growth. Through an analysis of hidden potentials, demand hotspots, and market conditions that are most favorable to success, this method enables firms to focus on target countries, maximize returns, and global expansion with data, backed by accuracy.
By factoring in the projected importer demand gap that is currently unmet and could be potential opportunity, it identifies the potential for the Exporter (Country) among 190 countries, against the general trade analysis, which identifies the biggest importer or exporter.
To discover high-growth global markets and optimize your business strategy:
Click Here
Pricing
- Single User License$ 1,995
- Department License$ 2,400
- Site License$ 3,120
- Global License$ 3,795

Leadership Perspectives from Industry Events
Search
Thought Leadership and Analyst Meet


Our Clients
6WResearch In News
- India Air Conditioner Market Set for Strong Rebound in 2026 After Weather-Led Correction and GST-Driven Recovery: 6Wresearch
- ADAS in India: How Automatic Emergency Braking, Blind Spot Detection & Driver Monitoring are Transforming Road Safety
- Doha a strategic location for EV manufacturing hub: IPA Qatar
- Demand for luxury TVs surging in the GCC, says Samsung
- Empowering Growth: The Thriving Journey of Bangladesh’s Cable Industry
- Demand for luxury TVs surging in the GCC, says Samsung
Latest Reports
- Nicaragua RPG Gaming Market (2026-2032)
- New Zealand RPG Gaming Market (2026-2032)
- Netherlands RPG Gaming Market (2026-2032)
- Nauru RPG Gaming Market (2026-2032)
- Namibia RPG Gaming Market (2026-2032)
- Mozambique RPG Gaming Market (2026-2032)
- Montenegro RPG Gaming Market (2026-2032)
- Mongolia RPG Gaming Market (2026-2032)
- Monaco RPG Gaming Market (2026-2032)
- Micronesia RPG Gaming Market (2026-2032)
Industry Events and Analyst Meet

EV India Expo 2026

HIMTEX 2026

India Refining Summit 2026

India EV Show 2026

EV tech India Expo 2026
Whitepaper
- Middle East & Africa Commercial Security Market Click here to view more.
- Middle East & Africa Fire Safety Systems & Equipment Market Click here to view more.
- GCC Drone Market Click here to view more.
- Middle East Lighting Fixture Market Click here to view more.
- GCC Physical & Perimeter Security Market Click here to view more.