Brazil Rare Earth & Products Market (2026-2032) | Analysis, Outlook, Revenue, Companies, Share, Industry, Size, Growth, Trends, COVID-19 IMPACT, Forecast & Value
Market Forecast By Product Types (Cerium, Dysprosium, Erbium, Europium, Gadolinium, Holmium, Lanthanum, Others), By Applications (Magnets, Catalysts, Metallurgy, Polishing, Glass, Phosphors, Ceramics, Others) And Competitive Landscape
| Product Code: ETC008722 | Publication Date: Jun 2023 | Updated Date: Jun 2026 | Product Type: Report | |
| Publisher: 6Wresearch | Author: Ravi Bhandari | No. of Pages: 70 | No. of Figures: 35 | No. of Tables: 5 |
Brazil Rare Earth & Products Market Summary
The brazil rare earth & products market was estimated at USD 318 Million in 2025 and is projected to reach USD 381 Million by 2032, growing at a CAGR of 3.2% from 2026 to 2032.
Brazil Rare Earth & Products Market Year-wise Growth Rate and Key Drivers
This graph highlights how the Brazil Rare Earth & Products Market has steadily grown over the years, supported by major growth factors.
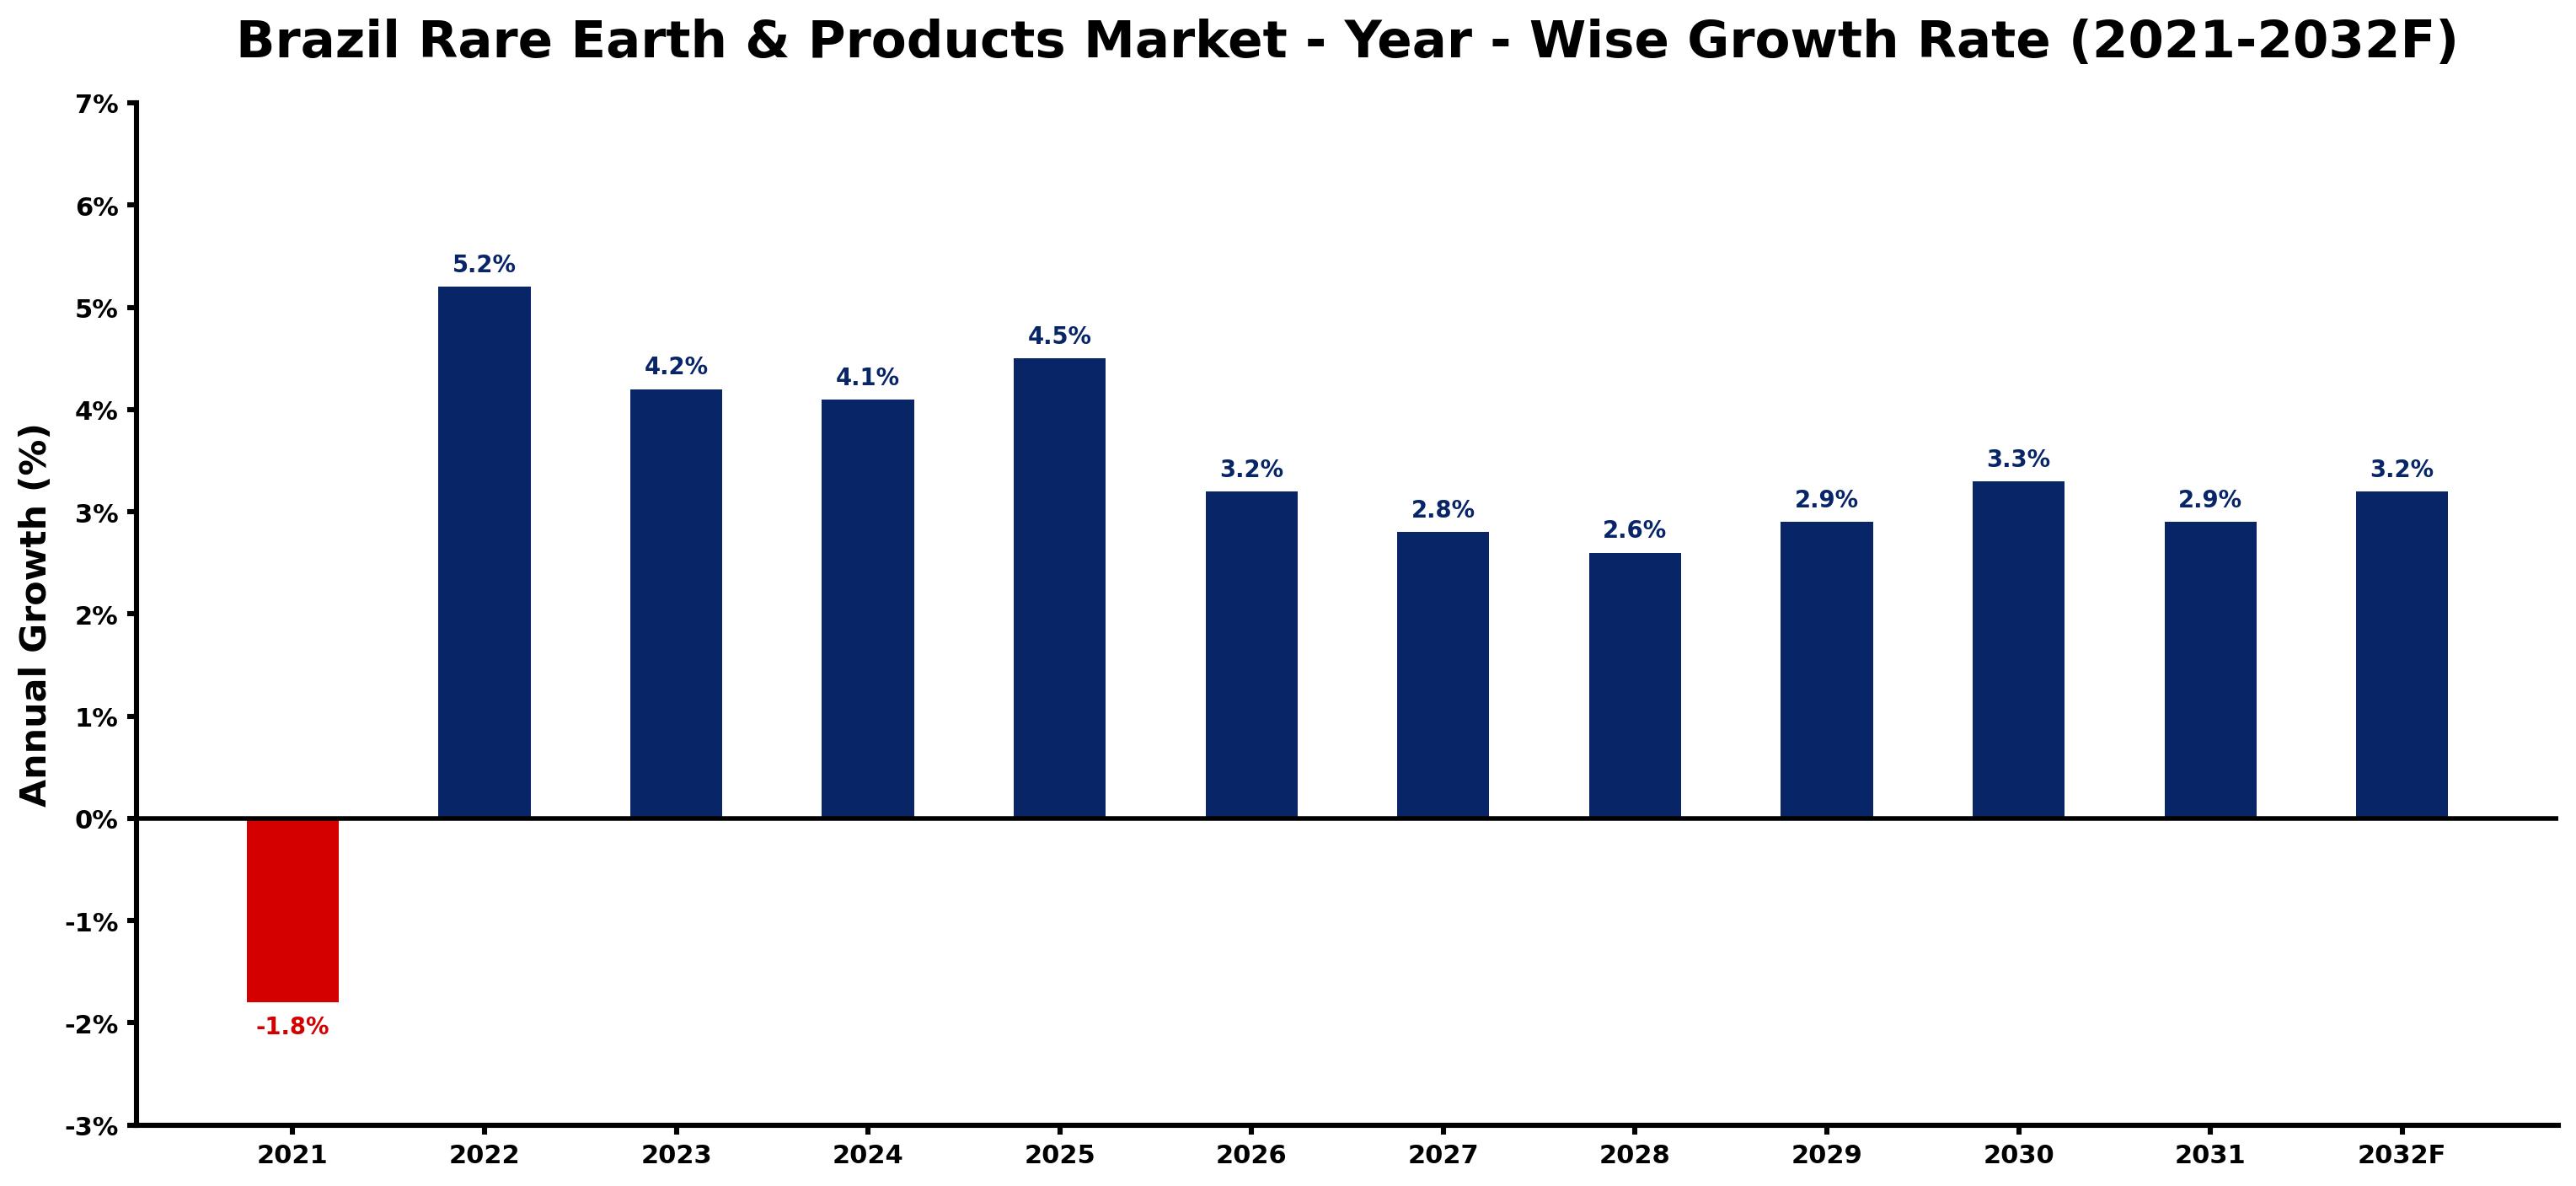
The table below presents the year wise growth rates along with the key drivers influencing the market
| Year | Growth Rate | Major Drivers |
| 2021 | -1.8% | Decreased global demand for clean energy technologies diminished the need for rare earth elements in Brazil. |
| 2022 | 5.2% | Local industries are increasingly seeking alternatives to address supply chain vulnerabilities. |
| 2023 | 4.2% | Technological innovations foster more efficient extraction methods, enhancing production capabilities. |
| 2024 | 4.1% | Growing demand from electric vehicle manufacturers boosts the need for rare earth elements. |
| 2025 | 4.5% | Brazil's government promotes initiatives to strengthen its position in the global market. |
| 2026 | 3.2% | Increased collaboration between private sectors and research institutions drives innovation. |
| 2027 | 2.8% | Emerging green technologies create new markets for rare earth applications in Brazil. |
| 2028 | 2.6% | Sustainability concerns prompt investments in eco-friendly mining practices and technologies. |
| 2029 | 2.9% | Brazilian firms expand partnerships to secure access to critical rare earth resources. |
| 2030 | 3.3% | International trade agreements enhance Brazil's ability to export rare earth products. |
| 2031 | 2.9% | Market competition encourages local companies to improve processing and refining techniques. |
| 2032 | 3.2% | Evolving consumer preferences drive demand for renewable energy technologies and rare earths. |
Note - Market size estimations and growth projections presented in this report are based on 6Wresearch's advanced forecasting approach, validated with industry datasets as of June 2026.
Brazil Rare Earth & Products Market Synopsis
The Brazil Rare Earth Products Market is projected to reach 3.2% and witness significant growth during the forecast period (2026-2032). This growth trajectory is driven by a confluence of factors including robust demand for rare earth metals across diverse industrial sectors and increasing investments in innovative research and development initiatives related to rare earth applications. Key industries such as automotive, electronics, and renewable energy are significantly contributing to the market's expansion.
Brazil Rare Earth & Products Market Growth Drivers
A variety of factors are fueling the growth of the Brazil Rare Earth & Products Market. The following elements are particularly influential:
- The escalating demand for rare earth metals from industries such as electric vehicles and consumer electronics highlights the growing requirement for lightweight components fashioned from these materials.
- Continuous advancements in technology foster demand for rare earth metals, particularly in the development of high-performance permanent magnets utilized in applications like wind turbines and MRI machines.
- There is an increasing focus on sustainable energy solutions, with rare earth metals playing a pivotal role in the manufacturing of solar panels and other renewable energy technologies.
- Investments in research and development are leading to new applications for rare earth materials, which are expected to further enhance market growth during the forecast period.
- Government emphasis on technological innovation, particularly concerning the integration of green technologies, is expected to stimulate demand for rare earth products significantly.
Brazil Rare Earth & Products Market Trends and Opportunities
Emerging trends within the Brazil Rare Earth & Products Market are set to reshape the landscape of industrial applications. Recognizing these trends can provide significant opportunities for stakeholders:
- The increasing penetration of electric vehicles is not only boosting the demand for rare earth metals but also encouraging the development of new technologies to enhance battery efficiency and performance.
- As industries continue to adopt automation and smart technologies, there is a rising necessity for rare earth-based components, further driving market prospects.
- The growing integration of renewable energy systems necessitates a robust supply chain of rare earth materials for energy storage and conversion technologies.
- Public-private partnerships focusing on sustainable resource management are anticipated to unlock further opportunities, enabling greater access to rare earth materials.
- As recycling technologies for rare earth metals advance, there is potential for reduced dependency on mining, thereby creating a more sustainable market dynamic.
Brazil Rare Earth & Products Market Challenges and Restraints
Despite the positive growth outlook, several challenges and restraints could impact the Brazil Rare Earth & Products Market:
- Volatility in the pricing of rare earth metals due to fluctuating global demand and supply dynamics can pose significant risks to market stability.
- Environmental concerns associated with mining activities may lead to stricter regulations, impacting operational capabilities and market access.
- The dominance of a few countries in rare earth metal production could create supply chain vulnerabilities for Brazil, affecting market performance.
- Technological challenges related to the efficient extraction and processing of rare earth elements must be addressed to enhance productivity.
- The market may face competition from alternative materials that can replace rare earth elements in certain applications, potentially impacting market growth.
Brazil Rare Earth & Products Market Government Investment and Initiatives
Government initiatives play a crucial role in shaping the Brazil Rare Earth & Products Market. Several notable efforts include:
- The Brazilian government has been increasingly supportive of policies that promote innovation and sustainability within the rare earth sector, encouraging investments in research and new technologies.
- Incentives for startups focusing on developing green technologies and sustainable resource management programs are being implemented to stimulate market growth.
- Public funding aimed at enhancing mining efficiency and reducing environmental impacts is a priority, fostering a more sustainable approach to resource extraction.
- Collaborative research initiatives between government entities and academic institutions are being established to explore new applications for rare earth materials.
- Strategic partnerships with international bodies are sought to bolster Brazil's position in the global rare earth supply chain, enhancing both production and export capabilities.
Brazil Rare Earth & Products Market Latest Developments (May 2025 - June 2026)
Recent developments within the Brazil Rare Earth & Products Market indicate a progressive shift towards innovation and sustainability. Key industry directions observed during the noted period include:
- Rising investments in electric vehicle infrastructure are propelling the need for rare earth components, particularly in battery production and lightweight manufacturing.
- Increased collaboration between private enterprises and public entities is facilitating advancements in recycling techniques for rare earth metals, supporting a circular economy.
- Research efforts focusing on the environmental impacts of rare earth extraction are yielding new methodologies aimed at minimizing ecological footprints.
- Technological innovations in the production of permanent magnets have emerged, enhancing their efficiency and creating new opportunities in various sectors, including renewable energy.
- The market is witnessing a surge in educational initiatives aimed at raising awareness about the importance of rare earths in future technological advancements and sustainability efforts.
Brazil Rare Earth & Products Market - Key Attractiveness of the Report
- 10 Years of Market Numbers
- Historical Data Starting from 2022 to 2025
- Base Year: 2025
- Forecast Data until 2032
- Key Performance Indicators Impacting the Market
- Major Upcoming Developments and Projects
Key Highlights of the Report:
- Brazil Rare Earth & Products Market Outlook
- Market Size of Brazil Rare Earth & Products Market, 2025
- Forecast of Brazil Rare Earth & Products Market, 2032F
- Historical Data and Forecast of Brazil Rare Earth & Products Revenues & Volume for the Period 2022-2032F
- Brazil Rare Earth & Products Market Trend Evolution
- Brazil Rare Earth & Products Market Drivers and Challenges
- Brazil Rare Earth & Products Price Trends
- Brazil Rare Earth & Products Porter's Five Forces
- Brazil Rare Earth & Products Industry Life Cycle
- Historical Data and Forecast of Brazil Rare Earth & Products Market Revenues & Volume By Product Types for the Period 2022-2032F
- Historical Data and Forecast of Brazil Rare Earth & Products Market Revenues & Volume By Cerium for the Period 2022-2032F
- Historical Data and Forecast of Brazil Rare Earth & Products Market Revenues & Volume By Dysprosium for the Period 2022-2032F
- Historical Data and Forecast of Brazil Rare Earth & Products Market Revenues & Volume By Erbium for the Period 2022-2032F
- Historical Data and Forecast of Brazil Rare Earth & Products Market Revenues & Volume By Europium for the Period 2022-2032F
- Historical Data and Forecast of Brazil Rare Earth & Products Market Revenues & Volume By Gadolinium for the Period 2022-2032F
- Historical Data and Forecast of Brazil Rare Earth & Products Market Revenues & Volume By Holmium for the Period 2022-2032F
- Historical Data and Forecast of Brazil Rare Earth & Products Market Revenues & Volume By Lanthanum for the Period 2022-2032F
- Historical Data and Forecast of Brazil Cerium Rare Earth & Products Market Revenues & Volume By Others for the Period 2022-2032F
- Historical Data and Forecast of Brazil Rare Earth & Products Market Revenues & Volume By Applications for the Period 2022-2032F
- Historical Data and Forecast of Brazil Rare Earth & Products Market Revenues & Volume By Magnets for the Period 2022-2032F
- Historical Data and Forecast of Brazil Rare Earth & Products Market Revenues & Volume By Catalysts for the Period 2022-2032F
- Historical Data and Forecast of Brazil Rare Earth & Products Market Revenues & Volume By Metallurgy for the Period 2022-2032F
- Historical Data and Forecast of Brazil Rare Earth & Products Market Revenues & Volume By Polishing for the Period 2022-2032F
- Historical Data and Forecast of Brazil Rare Earth & Products Market Revenues & Volume By Glass for the Period 2022-2032F
- Historical Data and Forecast of Brazil Rare Earth & Products Market Revenues & Volume By Phosphors for the Period 2022-2032F
- Historical Data and Forecast of Brazil Rare Earth & Products Market Revenues & Volume By Ceramics for the Period 2022-2032F
- Historical Data and Forecast of Brazil Rare Earth & Products Market Revenues & Volume By Others for the Period 2022-2032F
- Brazil Rare Earth & Products Import Export Trade Statistics
- Market Opportunity Assessment By Product Types
- Market Opportunity Assessment By Applications
- Brazil Rare Earth & Products Top Companies Market Share
- Brazil Rare Earth & Products Competitive Benchmarking By Technical and Operational Parameters
- Brazil Rare Earth & Products Company Profiles
- Brazil Rare Earth & Products Key Strategic Recommendations
Frequently Asked Questions About the Market Study (FAQs):
The growth is driven by increasing demand from various industries, especially electric vehicles and consumer electronics, along with investments in research and development.
Government initiatives often include support for innovation, sustainability, and public funding for research, which can significantly impact market growth.
Challenges include pricing volatility, environmental regulations, and competition from alternative materials.
Key trends include advancements in electric vehicles, renewable energy adoption, and innovations in recycling technologies.
6Wresearch actively monitors the Brazil Rare Earth & Products Market and publishes its comprehensive annual report, highlighting emerging trends, growth drivers, revenue analysis, and forecast outlook. Our insights help businesses to make data-backed strategic decisions with ongoing market dynamics. Our analysts track relevent industries related to the Brazil Rare Earth & Products Market, allowing our clients with actionable intelligence and reliable forecasts tailored to emerging regional needs.
Yes, we provide customisation as per your requirements. To learn more, feel free to contact us on sales@6wresearch.com
1 Executive Summary |
2 Introduction |
2.1 Key Highlights of the Report |
2.2 Report Description |
2.3 Market Scope & Segmentation |
2.4 Research Methodology |
2.5 Assumptions |
3 Brazil Rare Earth & Products Market Overview |
3.1 Brazil Country Macro Economic Indicators |
3.2 Brazil Rare Earth & Products Market Revenues & Volume, 2022 & 2032F |
3.3 Brazil Rare Earth & Products Market - Industry Life Cycle |
3.4 Brazil Rare Earth & Products Market - Porter's Five Forces |
3.5 Brazil Rare Earth & Products Market Revenues & Volume Share, By Product Types, 2022 & 2032F |
3.6 Brazil Rare Earth & Products Market Revenues & Volume Share, By Applications, 2022 & 2032F |
4 Brazil Rare Earth & Products Market Dynamics |
4.1 Impact Analysis |
4.2 Market Drivers |
4.3 Market Restraints |
5 Brazil Rare Earth & Products Market Trends |
6 Brazil Rare Earth & Products Market, By Types |
6.1 Brazil Rare Earth & Products Market, By Product Types |
6.1.1 Overview and Analysis |
6.1.2 Brazil Rare Earth & Products Market Revenues & Volume, By Product Types, 2022-2032F |
6.1.3 Brazil Rare Earth & Products Market Revenues & Volume, By Cerium, 2022-2032F |
6.1.4 Brazil Rare Earth & Products Market Revenues & Volume, By Dysprosium, 2022-2032F |
6.1.5 Brazil Rare Earth & Products Market Revenues & Volume, By Erbium, 2022-2032F |
6.1.6 Brazil Rare Earth & Products Market Revenues & Volume, By Europium, 2022-2032F |
6.1.7 Brazil Rare Earth & Products Market Revenues & Volume, By Gadolinium, 2022-2032F |
6.1.8 Brazil Rare Earth & Products Market Revenues & Volume, By Holmium, 2022-2032F |
6.1.9 Brazil Rare Earth & Products Market Revenues & Volume, By Others, 2022-2032F |
6.1.10 Brazil Rare Earth & Products Market Revenues & Volume, By Others, 2022-2032F |
6.2 Brazil Rare Earth & Products Market, By Applications |
6.2.1 Overview and Analysis |
6.2.2 Brazil Rare Earth & Products Market Revenues & Volume, By Magnets, 2022-2032F |
6.2.3 Brazil Rare Earth & Products Market Revenues & Volume, By Catalysts, 2022-2032F |
6.2.4 Brazil Rare Earth & Products Market Revenues & Volume, By Metallurgy, 2022-2032F |
6.2.5 Brazil Rare Earth & Products Market Revenues & Volume, By Polishing, 2022-2032F |
6.2.6 Brazil Rare Earth & Products Market Revenues & Volume, By Glass, 2022-2032F |
6.2.7 Brazil Rare Earth & Products Market Revenues & Volume, By Phosphors, 2022-2032F |
6.2.8 Brazil Rare Earth & Products Market Revenues & Volume, By Others, 2022-2032F |
6.2.9 Brazil Rare Earth & Products Market Revenues & Volume, By Others, 2022-2032F |
7 Brazil Rare Earth & Products Market Import-Export Trade Statistics |
7.1 Brazil Rare Earth & Products Market Export to Major Countries |
7.2 Brazil Rare Earth & Products Market Imports from Major Countries |
8 Brazil Rare Earth & Products Market Key Performance Indicators |
9 Brazil Rare Earth & Products Market - Opportunity Assessment |
9.1 Brazil Rare Earth & Products Market Opportunity Assessment, By Product Types, 2022 & 2032F |
9.2 Brazil Rare Earth & Products Market Opportunity Assessment, By Applications, 2022 & 2032F |
10 Brazil Rare Earth & Products Market - Competitive Landscape |
10.1 Brazil Rare Earth & Products Market Revenue Share, By Companies, 2025 |
10.2 Brazil Rare Earth & Products Market Competitive Benchmarking, By Operating and Technical Parameters |
11 Company Profiles |
12 Recommendations |
13 Disclaimer |
Global Go To Market Strategy - 2030
Export potential enables firms to identify high-growth global markets with greater confidence by combining advanced trade intelligence with a structured quantitative methodology. The framework analyzes emerging demand trends and country-level import patterns while integrating macroeconomic and trade datasets such as GDP and population forecasts, bilateral import–export flows, tariff structures, elasticity differentials between developed and developing economies, geographic distance, and import demand projections. Using weighted trade values from 2020–2024 as the base period to project country-to-country export potential for 2030, these inputs are operationalized through calculated drivers such as gravity model parameters, tariff impact factors, and projected GDP per-capita growth. Through an analysis of hidden potentials, demand hotspots, and market conditions that are most favorable to success, this method enables firms to focus on target countries, maximize returns, and global expansion with data, backed by accuracy.
By factoring in the projected importer demand gap that is currently unmet and could be potential opportunity, it identifies the potential for the Exporter (Country) among 190 countries, against the general trade analysis, which identifies the biggest importer or exporter.
To discover high-growth global markets and optimize your business strategy:
Click Here
Pricing
- Single User License$ 1,995
- Department License$ 2,400
- Site License$ 3,120
- Global License$ 3,795

Leadership Perspectives from Industry Events
Search
Thought Leadership and Analyst Meet


Our Clients
6WResearch In News
- India Air Conditioner Market Set for Strong Rebound in 2026 After Weather-Led Correction and GST-Driven Recovery: 6Wresearch
- ADAS in India: How Automatic Emergency Braking, Blind Spot Detection & Driver Monitoring are Transforming Road Safety
- Doha a strategic location for EV manufacturing hub: IPA Qatar
- Demand for luxury TVs surging in the GCC, says Samsung
- Empowering Growth: The Thriving Journey of Bangladesh’s Cable Industry
- Demand for luxury TVs surging in the GCC, says Samsung
Latest Reports
- Nicaragua RPG Gaming Market (2026-2032)
- New Zealand RPG Gaming Market (2026-2032)
- Netherlands RPG Gaming Market (2026-2032)
- Nauru RPG Gaming Market (2026-2032)
- Namibia RPG Gaming Market (2026-2032)
- Mozambique RPG Gaming Market (2026-2032)
- Montenegro RPG Gaming Market (2026-2032)
- Mongolia RPG Gaming Market (2026-2032)
- Monaco RPG Gaming Market (2026-2032)
- Micronesia RPG Gaming Market (2026-2032)
Industry Events and Analyst Meet

EV India Expo 2026

HIMTEX 2026

India Refining Summit 2026

India EV Show 2026

EV tech India Expo 2026
Whitepaper
- Middle East & Africa Commercial Security Market Click here to view more.
- Middle East & Africa Fire Safety Systems & Equipment Market Click here to view more.
- GCC Drone Market Click here to view more.
- Middle East Lighting Fixture Market Click here to view more.
- GCC Physical & Perimeter Security Market Click here to view more.