Bulgaria Clam Extract Market (2026-2032) | Revenue, Industry, Analysis, Value, Companies, Outlook, Share, Growth, Segmentation, Size, Trends & Forecast
Market Forecast By Form (Powder Clam Extract, Paste Clam Extract, Liquid Clam Extract), By End Use (Food And Beverage Industry, Pharmaceutical Industry, Supplement Industry, Horeca, Household), By Distribution Channel (B2B, B2C) And Competitive Landscape
| Product Code: ETC5173312 | Publication Date: Nov 2023 | Updated Date: Apr 2026 | Product Type: Market Research Report | |
| Publisher: 6Wresearch | Author: Shubham Padhi | No. of Pages: 60 | No. of Figures: 30 | No. of Tables: 5 |
Bulgaria Clam Extract Market Size (2020-2030)
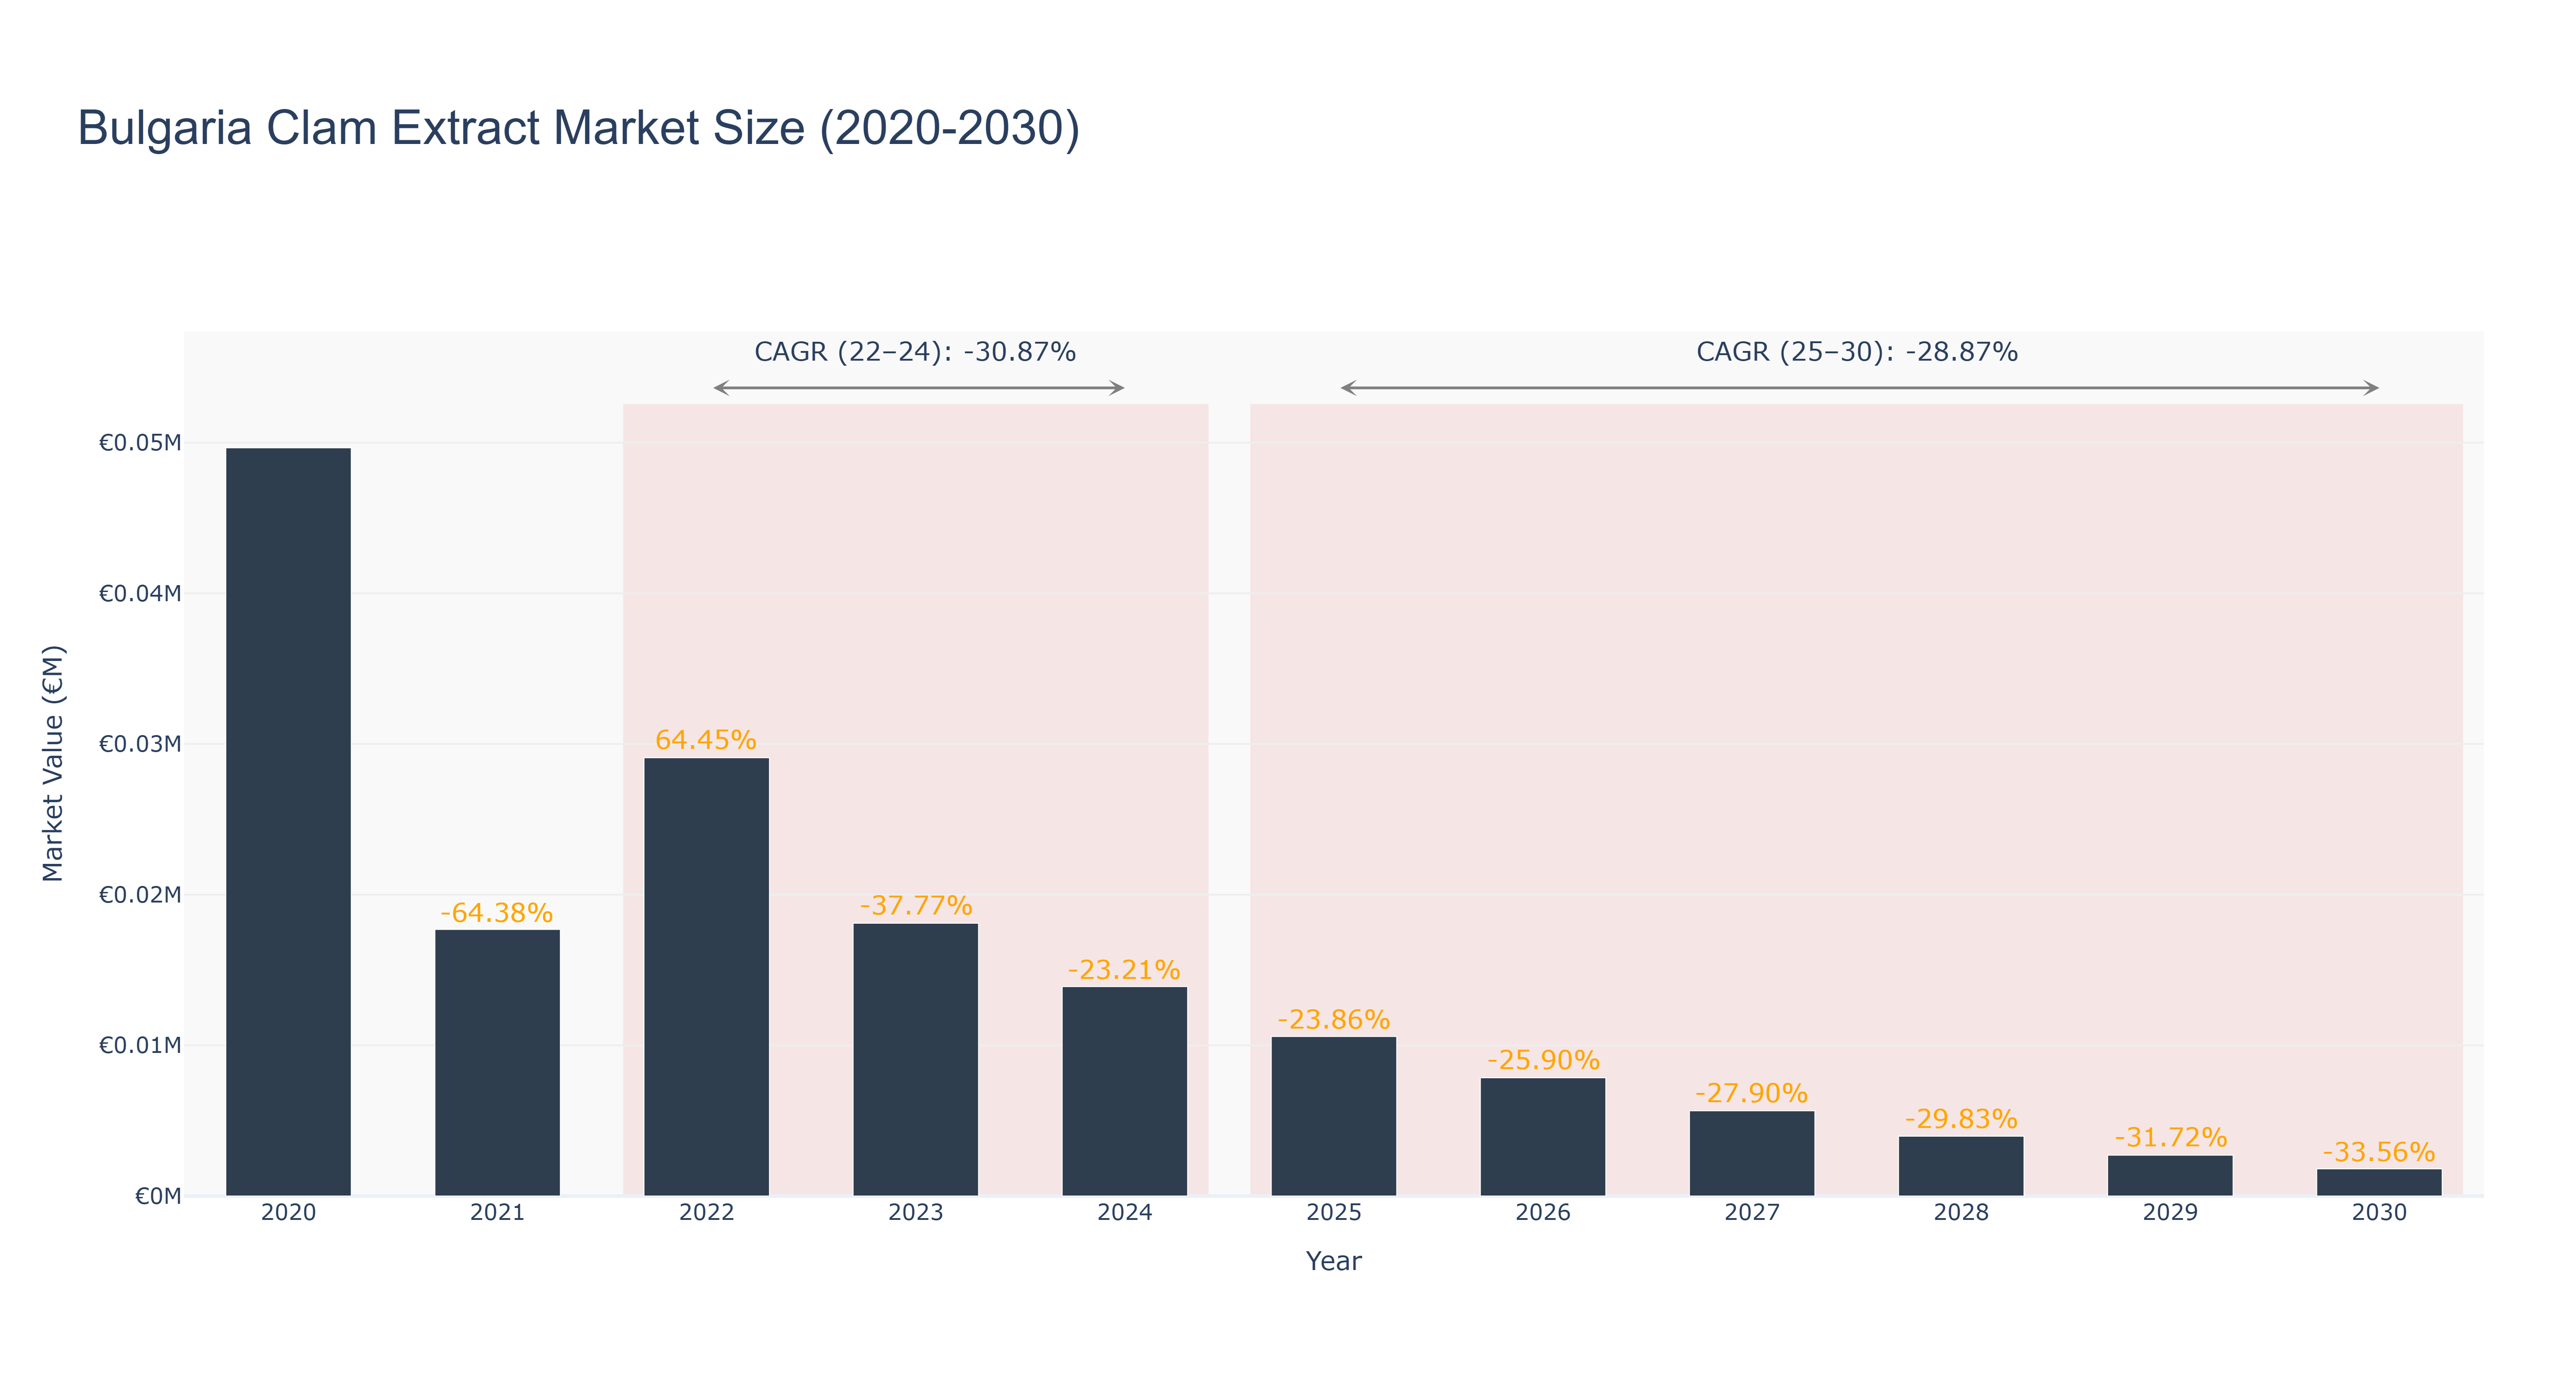
The Bulgaria Clam Extract Market has exhibited a volatile trajectory, characterized by sharp fluctuations in market size. The peak was recorded in 2020 at €49.66 thousand, followed by a significant decline to €17.69 thousand in 2021, reflecting a growth rate of -64.38%. The market rebounded in 2022 to €29.09 thousand, with a growth of 64.45%, but subsequently fell again to €18.10 thousand in 2023 and €13.90 thousand in 2024, resulting in an actual CAGR of -30.87% for the period. The forecasted outlook for 2025-2030 indicates a continued decline, with market sizes projected to decrease to €1.80 thousand by 2030, translating to a CAGR of -28.87%. This downturn can be attributed to changing consumer preferences, increased competition, and potential regulatory challenges. As the market evolves, industry stakeholders must adapt to these dynamics, focusing on innovation and sustainability to mitigate declines.
Bulgaria Clam Extract Market: Production & Trade Performance (2019-2025)
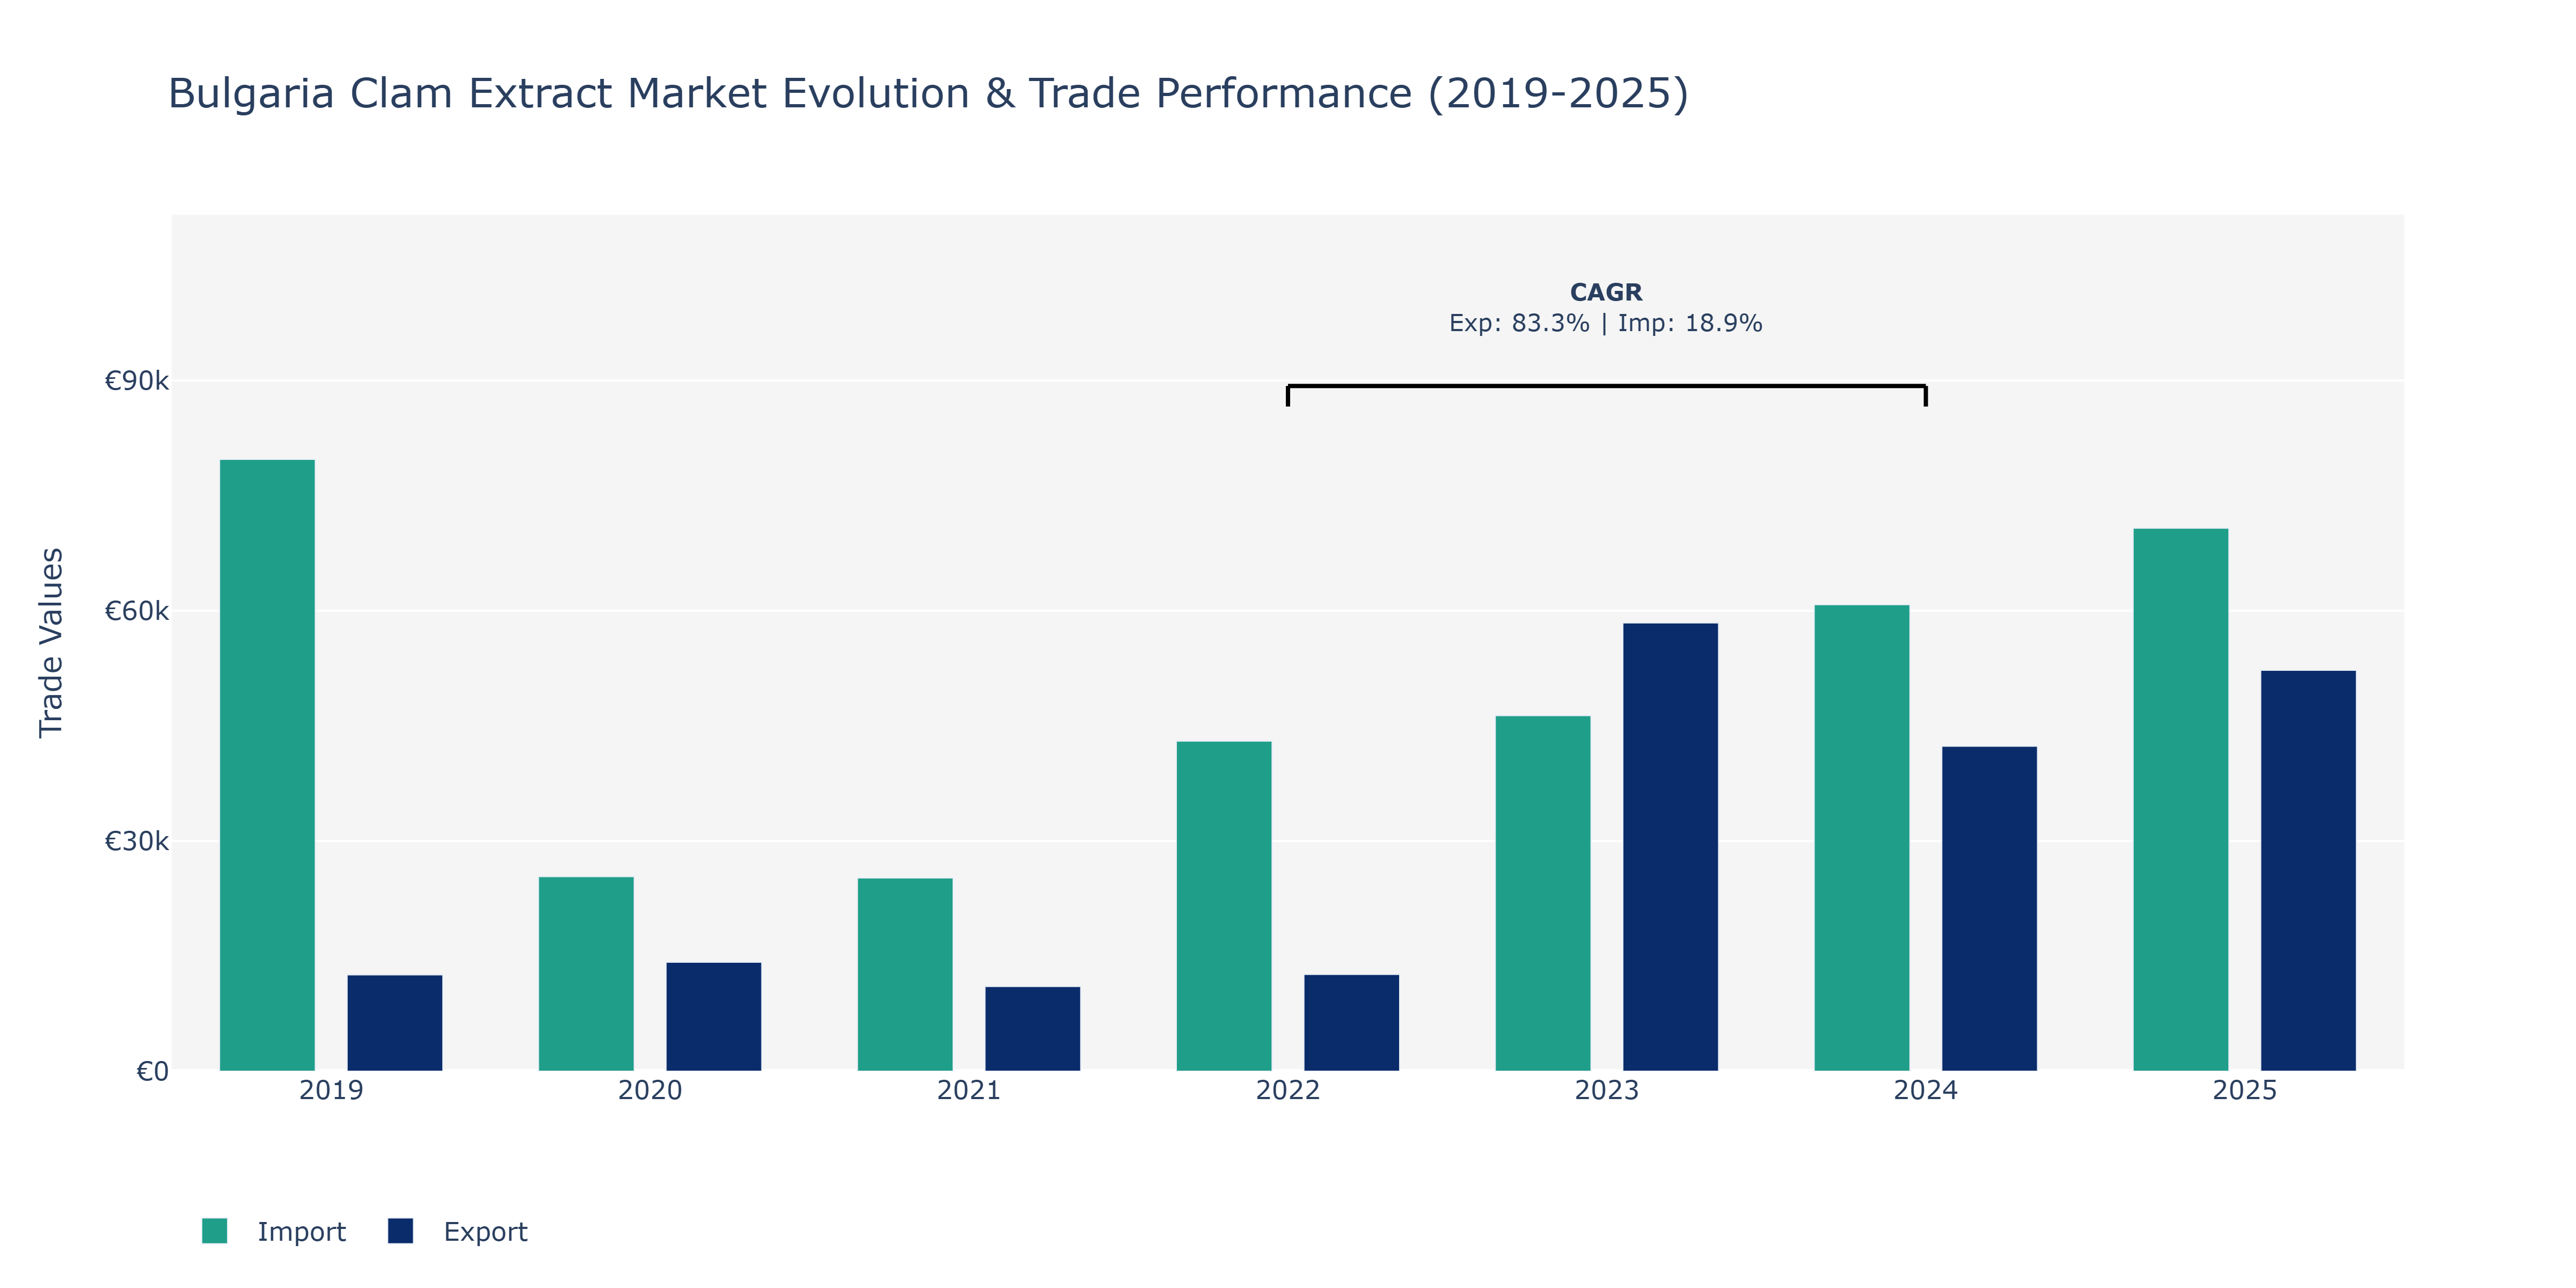
Between 2019 and 2025, Bulgaria's Clam Extract Market saw varying trends in exports and imports. Exports experienced a notable increase from €12.56 thousand in 2019 to €58.4 thousand in 2023, followed by a slight decline to €42.34 thousand in 2024, before rebounding to around €52.23 thousand in 2025. In contrast, imports fluctuated, starting at €79.72 thousand in 2019, dropping to €25.34 thousand in 2020, and gradually rising to €70.75 thousand in 2025. The market's export growth can be attributed to technological advancements in clam extract processing, increasing global demand for natural supplements, and strategic marketing efforts. The fluctuations in import value may reflect shifts in raw material prices, changes in trade policies impacting international procurement, and evolving consumer preferences towards premium-quality clam extract products. The CAGR of 83.28% for exports and 18.88% for imports between 2022 and 2024 indicates a significant expansion in outbound shipments compared to inbound purchases, potentially driven by Bulgaria's competitive pricing strategies and quality standards in the clam extract market.
Key Highlights of the Report:
- Bulgaria Clam Extract Market Outlook
- Market Size of Bulgaria Clam Extract Market, 2025
- Forecast of Bulgaria Clam Extract Market, 2032
- Historical Data and Forecast of Bulgaria Clam Extract Revenues & Volume for the Period 2022 - 2032F
- Bulgaria Clam Extract Market Trend Evolution
- Bulgaria Clam Extract Market Drivers and Challenges
- Bulgaria Clam Extract Price Trends
- Bulgaria Clam Extract Porter`s Five Forces
- Bulgaria Clam Extract Industry Life Cycle
- Historical Data and Forecast of Bulgaria Clam Extract Market Revenues & Volume By Form for the Period 2022 - 2032F
- Historical Data and Forecast of Bulgaria Clam Extract Market Revenues & Volume By Powder Clam Extract for the Period 2022 - 2032F
- Historical Data and Forecast of Bulgaria Clam Extract Market Revenues & Volume By Paste Clam Extract for the Period 2022 - 2032F
- Historical Data and Forecast of Bulgaria Clam Extract Market Revenues & Volume By Liquid Clam Extract for the Period 2022 - 2032F
- Historical Data and Forecast of Bulgaria Clam Extract Market Revenues & Volume By End Use for the Period 2022 - 2032F
- Historical Data and Forecast of Bulgaria Clam Extract Market Revenues & Volume By Food And Beverage Industry for the Period 2022 - 2032F
- Historical Data and Forecast of Bulgaria Clam Extract Market Revenues & Volume By Pharmaceutical Industry for the Period 2022 - 2032F
- Historical Data and Forecast of Bulgaria Clam Extract Market Revenues & Volume By Supplement Industry for the Period 2022 - 2032F
- Historical Data and Forecast of Bulgaria Clam Extract Market Revenues & Volume By Horeca for the Period 2022 - 2032F
- Historical Data and Forecast of Bulgaria Clam Extract Market Revenues & Volume By Household for the Period 2022 - 2032F
- Historical Data and Forecast of Bulgaria Clam Extract Market Revenues & Volume By Distribution Channel for the Period 2022 - 2032F
- Historical Data and Forecast of Bulgaria Clam Extract Market Revenues & Volume By B2B for the Period 2022 - 2032F
- Historical Data and Forecast of Bulgaria Clam Extract Market Revenues & Volume By B2C for the Period 2022 - 2032F
- Bulgaria Clam Extract Import Export Trade Statistics
- Market Opportunity Assessment By Form
- Market Opportunity Assessment By End Use
- Market Opportunity Assessment By Distribution Channel
- Bulgaria Clam Extract Top Companies Market Share
- Bulgaria Clam Extract Competitive Benchmarking By Technical and Operational Parameters
- Bulgaria Clam Extract Company Profiles
- Bulgaria Clam Extract Key Strategic Recommendations
Frequently Asked Questions About the Market Study (FAQs):
6Wresearch actively monitors the Bulgaria Clam Extract Market and publishes its comprehensive annual report, highlighting emerging trends, growth drivers, revenue analysis, and forecast outlook. Our insights help businesses to make data-backed strategic decisions with ongoing market dynamics. Our analysts track relevent industries related to the Bulgaria Clam Extract Market, allowing our clients with actionable intelligence and reliable forecasts tailored to emerging regional needs.
Yes, we provide customisation as per your requirements. To learn more, feel free to contact us on sales@6wresearch.com
1 Executive Summary |
2 Introduction |
2.1 Key Highlights of the Report |
2.2 Report Description |
2.3 Market Scope & Segmentation |
2.4 Research Methodology |
2.5 Assumptions |
3 Bulgaria Clam Extract Market Overview |
3.1 Bulgaria Country Macro Economic Indicators |
3.2 Bulgaria Clam Extract Market Revenues & Volume, 2022 & 2032F |
3.3 Bulgaria Clam Extract Market - Industry Life Cycle |
3.4 Bulgaria Clam Extract Market - Porter's Five Forces |
3.5 Bulgaria Clam Extract Market Revenues & Volume Share, By Form, 2022 & 2032F |
3.6 Bulgaria Clam Extract Market Revenues & Volume Share, By End Use, 2022 & 2032F |
3.7 Bulgaria Clam Extract Market Revenues & Volume Share, By Distribution Channel, 2022 & 2032F |
4 Bulgaria Clam Extract Market Dynamics |
4.1 Impact Analysis |
4.2 Market Drivers |
4.2.1 Increasing consumer awareness about the health benefits of clam extract |
4.2.2 Growing demand for natural and organic skincare products |
4.2.3 Rising popularity of marine-based ingredients in cosmetics and personal care products |
4.3 Market Restraints |
4.3.1 Limited availability of clams for extraction due to environmental factors |
4.3.2 Stringent regulations related to sustainable sourcing and harvesting of clams |
4.3.3 Competition from alternative ingredients in the skincare industry |
5 Bulgaria Clam Extract Market Trends |
6 Bulgaria Clam Extract Market Segmentations |
6.1 Bulgaria Clam Extract Market, By Form |
6.1.1 Overview and Analysis |
6.1.2 Bulgaria Clam Extract Market Revenues & Volume, By Powder Clam Extract, 2022 - 2032F |
6.1.3 Bulgaria Clam Extract Market Revenues & Volume, By Paste Clam Extract, 2022 - 2032F |
6.1.4 Bulgaria Clam Extract Market Revenues & Volume, By Liquid Clam Extract, 2022 - 2032F |
6.2 Bulgaria Clam Extract Market, By End Use |
6.2.1 Overview and Analysis |
6.2.2 Bulgaria Clam Extract Market Revenues & Volume, By Food And Beverage Industry, 2022 - 2032F |
6.2.3 Bulgaria Clam Extract Market Revenues & Volume, By Pharmaceutical Industry, 2022 - 2032F |
6.2.4 Bulgaria Clam Extract Market Revenues & Volume, By Supplement Industry, 2022 - 2032F |
6.2.5 Bulgaria Clam Extract Market Revenues & Volume, By Horeca, 2022 - 2032F |
6.2.6 Bulgaria Clam Extract Market Revenues & Volume, By Household, 2022 - 2032F |
6.3 Bulgaria Clam Extract Market, By Distribution Channel |
6.3.1 Overview and Analysis |
6.3.2 Bulgaria Clam Extract Market Revenues & Volume, By B2B, 2022 - 2032F |
6.3.3 Bulgaria Clam Extract Market Revenues & Volume, By B2C, 2022 - 2032F |
7 Bulgaria Clam Extract Market Import-Export Trade Statistics |
7.1 Bulgaria Clam Extract Market Export to Major Countries |
7.2 Bulgaria Clam Extract Market Imports from Major Countries |
8 Bulgaria Clam Extract Market Key Performance Indicators |
8.1 Consumer engagement with clam extract products on social media platforms |
8.2 Number of new product launches containing clam extract |
8.3 Growth in research and development investments in clam extract technology and applications |
9 Bulgaria Clam Extract Market - Opportunity Assessment |
9.1 Bulgaria Clam Extract Market Opportunity Assessment, By Form, 2022 & 2032F |
9.2 Bulgaria Clam Extract Market Opportunity Assessment, By End Use, 2022 & 2032F |
9.3 Bulgaria Clam Extract Market Opportunity Assessment, By Distribution Channel, 2022 & 2032F |
10 Bulgaria Clam Extract Market - Competitive Landscape |
10.1 Bulgaria Clam Extract Market Revenue Share, By Companies, 2025 |
10.2 Bulgaria Clam Extract Market Competitive Benchmarking, By Operating and Technical Parameters |
11 Company Profiles |
12 Recommendations | 13 Disclaimer |
Global Go To Market Strategy - 2030
Export potential enables firms to identify high-growth global markets with greater confidence by combining advanced trade intelligence with a structured quantitative methodology. The framework analyzes emerging demand trends and country-level import patterns while integrating macroeconomic and trade datasets such as GDP and population forecasts, bilateral import–export flows, tariff structures, elasticity differentials between developed and developing economies, geographic distance, and import demand projections. Using weighted trade values from 2020–2024 as the base period to project country-to-country export potential for 2030, these inputs are operationalized through calculated drivers such as gravity model parameters, tariff impact factors, and projected GDP per-capita growth. Through an analysis of hidden potentials, demand hotspots, and market conditions that are most favorable to success, this method enables firms to focus on target countries, maximize returns, and global expansion with data, backed by accuracy.
By factoring in the projected importer demand gap that is currently unmet and could be potential opportunity, it identifies the potential for the Exporter (Country) among 190 countries, against the general trade analysis, which identifies the biggest importer or exporter.
To discover high-growth global markets and optimize your business strategy:
Click Here
Pricing
- Single User License$ 1,995
- Department License$ 2,400
- Site License$ 3,120
- Global License$ 3,795

Leadership Perspectives from Industry Events
Search
Thought Leadership and Analyst Meet


Our Clients
6WResearch In News
- India Export Attractiveness Tracker 2026
- India Air Conditioner Market Set for Strong Rebound in 2026 After Weather-Led Correction and GST-Driven Recovery: 6Wresearch
- ADAS in India: How Automatic Emergency Braking, Blind Spot Detection & Driver Monitoring are Transforming Road Safety
- Doha a strategic location for EV manufacturing hub: IPA Qatar
- Demand for luxury TVs surging in the GCC, says Samsung
- Empowering Growth: The Thriving Journey of Bangladesh’s Cable Industry
Latest Reports
- Nicaragua RPG Gaming Market (2026-2032)
- New Zealand RPG Gaming Market (2026-2032)
- Netherlands RPG Gaming Market (2026-2032)
- Nauru RPG Gaming Market (2026-2032)
- Namibia RPG Gaming Market (2026-2032)
- Mozambique RPG Gaming Market (2026-2032)
- Montenegro RPG Gaming Market (2026-2032)
- Mongolia RPG Gaming Market (2026-2032)
- Monaco RPG Gaming Market (2026-2032)
- Micronesia RPG Gaming Market (2026-2032)
Industry Events and Analyst Meet

EV India Expo 2026

HIMTEX 2026

India Refining Summit 2026

India EV Show 2026

EV tech India Expo 2026
Whitepaper
- Middle East & Africa Commercial Security Market Click here to view more.
- Middle East & Africa Fire Safety Systems & Equipment Market Click here to view more.
- GCC Drone Market Click here to view more.
- Middle East Lighting Fixture Market Click here to view more.
- GCC Physical & Perimeter Security Market Click here to view more.