Burkina Faso Virtual Power Plant Market (2025-2031) | Segmentation, Analysis, Forecast, Share, Growth, Trends, Companies, Industry, Value, Outlook, Size & Revenue
Market Forecast By Enabling Technology (Dem, Response, Distributed Generation, Mixed Asset), By End Use (Commercial & Industrial, Residential) And Competitive Landscape
| Product Code: ETC5759691 | Publication Date: Nov 2023 | Updated Date: Oct 2025 | Product Type: Market Research Report | |
| Publisher: 6Wresearch | Author: Sumit Sagar | No. of Pages: 60 | No. of Figures: 30 | No. of Tables: 5 |
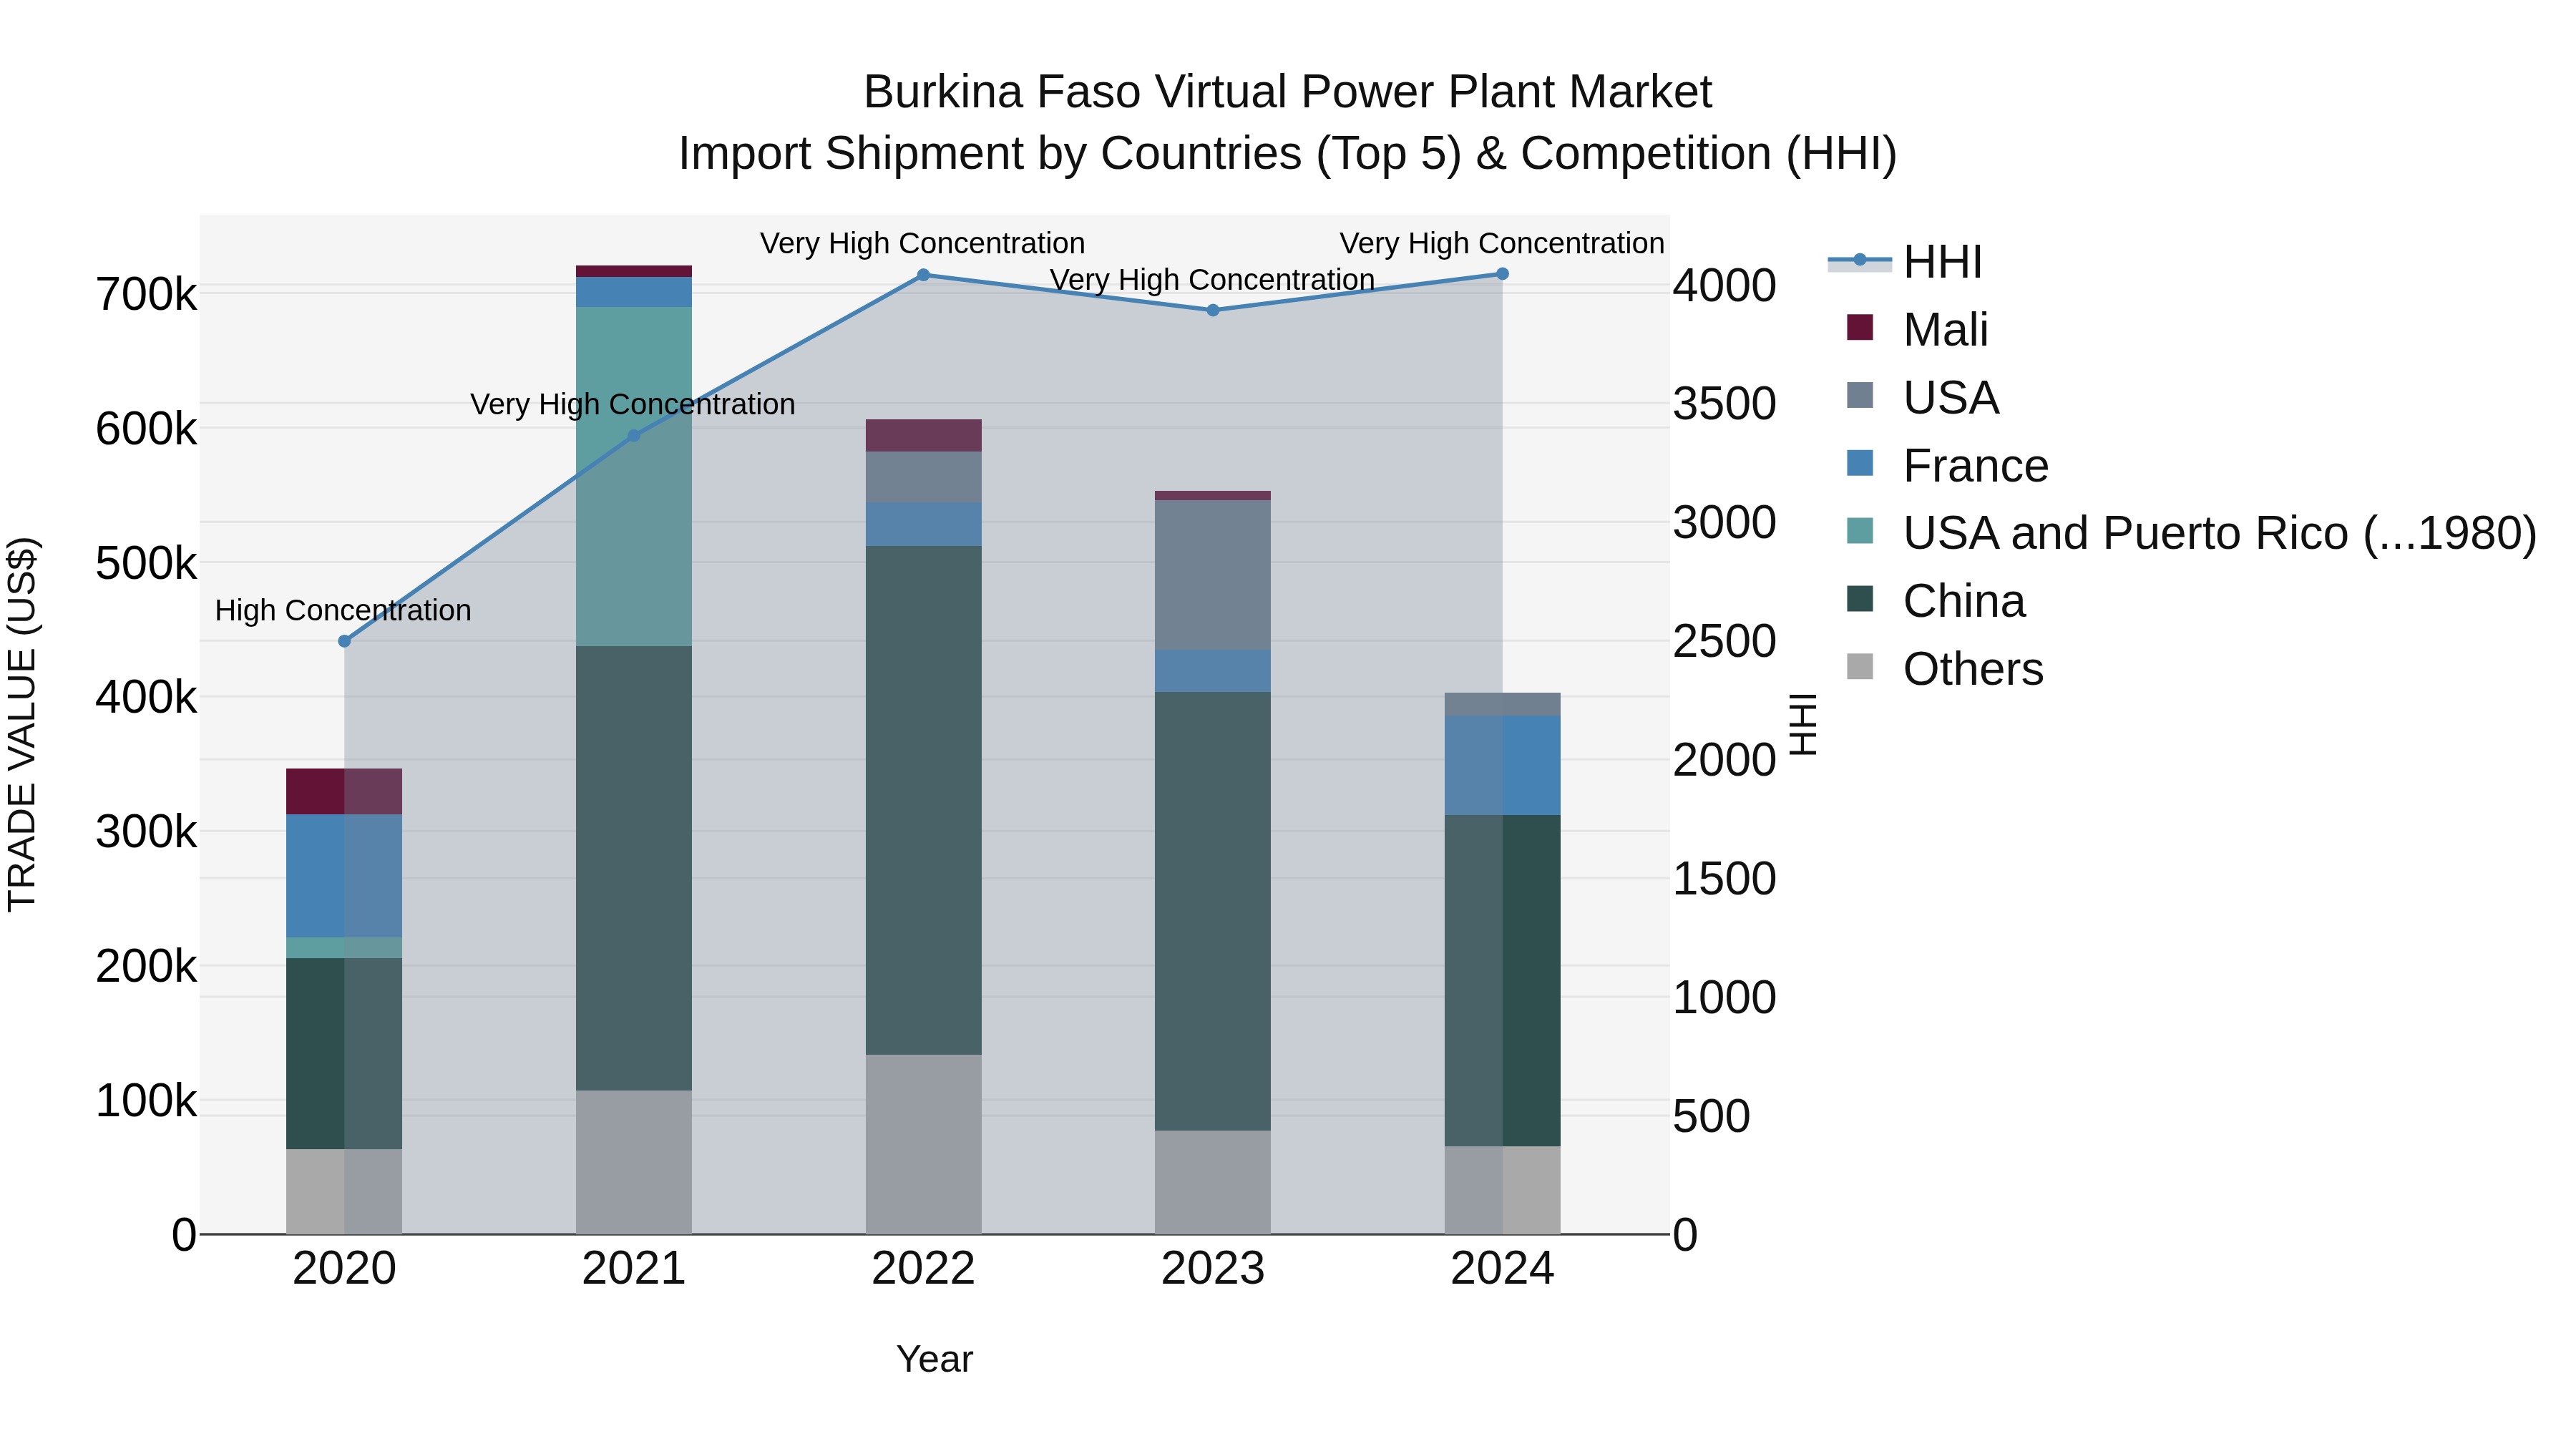
Burkina Faso Virtual Power Plant Market Top 5 Importing Countries and Market Competition (HHI) Analysis
Burkina Faso continues to rely on imports for its virtual power plant technology, with key suppliers including China, France, USA, Ghana, and the UK in 2024. Despite high concentration in the market, the industry experienced a moderate CAGR of 3.85% from 2020 to 2024. However, there was a significant decline in growth rate from 2023 to 2024 at -27.16%, indicating potential challenges or shifts in the market dynamics. It will be important to closely monitor these trends to assess the future trajectory of the virtual power plant import market in Burkina Faso.
Burkina Faso Virtual Power Plant Market Overview
The virtual power plant market in Burkina Faso is emerging as a part of the broader trend towards decentralized energy systems. Virtual power plants aggregate various distributed energy resources, such as solar panels, wind turbines, and battery storage, to operate as a single power plant. This market is driven by the need for more efficient energy management and the integration of renewable energy sources into the national grid.
Drivers of the market
The virtual power plant market in Burkina Faso is experiencing growth due to the increasing focus on renewable energy integration and grid stability. Virtual power plants enable the aggregation and optimization of distributed energy resources, enhancing the efficiency and reliability of the power grid. The government`s initiatives to promote renewable energy, along with the growing adoption of smart grid technologies, are driving the demand for virtual power plants in the country.
Challenges of the market
The Burkina Faso Virtual Power Plant Market faces challenges such as limited access to advanced technologies, high implementation costs, and a lack of regulatory support for virtual power plant solutions. Additionally, the market struggles with inadequate infrastructure and slow adoption rates.
Government Policy of the market
Government policies in Burkina Faso aimed at promoting renewable energy and smart grid technologies directly impact the virtual power plant market. Policies that support the integration of decentralized energy resources, such as solar and wind, into the national grid drive the adoption of virtual power plants. Additionally, government incentives for renewable energy projects and regulations promoting energy efficiency contribute to market growth.
Key Highlights of the Report:
- Burkina Faso Virtual Power Plant Market Outlook
- Market Size of Burkina Faso Virtual Power Plant Market, 2024
- Forecast of Burkina Faso Virtual Power Plant Market, 2031
- Historical Data and Forecast of Burkina Faso Virtual Power Plant Revenues & Volume for the Period 2021-2031
- Burkina Faso Virtual Power Plant Market Trend Evolution
- Burkina Faso Virtual Power Plant Market Drivers and Challenges
- Burkina Faso Virtual Power Plant Price Trends
- Burkina Faso Virtual Power Plant Porter`s Five Forces
- Burkina Faso Virtual Power Plant Industry Life Cycle
- Historical Data and Forecast of Burkina Faso Virtual Power Plant Market Revenues & Volume By Enabling Technology for the Period 2021-2031
- Historical Data and Forecast of Burkina Faso Virtual Power Plant Market Revenues & Volume By Dem for the Period 2021-2031
- Historical Data and Forecast of Burkina Faso Virtual Power Plant Market Revenues & Volume By Response for the Period 2021-2031
- Historical Data and Forecast of Burkina Faso Virtual Power Plant Market Revenues & Volume By Distributed Generation for the Period 2021-2031
- Historical Data and Forecast of Burkina Faso Virtual Power Plant Market Revenues & Volume By Mixed Asset for the Period 2021-2031
- Historical Data and Forecast of Burkina Faso Virtual Power Plant Market Revenues & Volume By End Use for the Period 2021-2031
- Historical Data and Forecast of Burkina Faso Virtual Power Plant Market Revenues & Volume By Commercial & Industrial for the Period 2021-2031
- Historical Data and Forecast of Burkina Faso Virtual Power Plant Market Revenues & Volume By Residential for the Period 2021-2031
- Burkina Faso Virtual Power Plant Import Export Trade Statistics
- Market Opportunity Assessment By Enabling Technology
- Market Opportunity Assessment By End Use
- Burkina Faso Virtual Power Plant Top Companies Market Share
- Burkina Faso Virtual Power Plant Competitive Benchmarking By Technical and Operational Parameters
- Burkina Faso Virtual Power Plant Company Profiles
- Burkina Faso Virtual Power Plant Key Strategic Recommendations
Frequently Asked Questions About the Market Study (FAQs):
6Wresearch actively monitors the Burkina Faso Virtual Power Plant Market and publishes its comprehensive annual report, highlighting emerging trends, growth drivers, revenue analysis, and forecast outlook. Our insights help businesses to make data-backed strategic decisions with ongoing market dynamics. Our analysts track relevent industries related to the Burkina Faso Virtual Power Plant Market, allowing our clients with actionable intelligence and reliable forecasts tailored to emerging regional needs.
Yes, we provide customisation as per your requirements. To learn more, feel free to contact us on sales@6wresearch.com
1 Executive Summary |
2 Introduction |
2.1 Key Highlights of the Report |
2.2 Report Description |
2.3 Market Scope & Segmentation |
2.4 Research Methodology |
2.5 Assumptions |
3 Burkina Faso Virtual Power Plant Market Overview |
3.1 Burkina Faso Country Macro Economic Indicators |
3.2 Burkina Faso Virtual Power Plant Market Revenues & Volume, 2021 & 2031F |
3.3 Burkina Faso Virtual Power Plant Market - Industry Life Cycle |
3.4 Burkina Faso Virtual Power Plant Market - Porter's Five Forces |
3.5 Burkina Faso Virtual Power Plant Market Revenues & Volume Share, By Enabling Technology, 2021 & 2031F |
3.6 Burkina Faso Virtual Power Plant Market Revenues & Volume Share, By End Use, 2021 & 2031F |
4 Burkina Faso Virtual Power Plant Market Dynamics |
4.1 Impact Analysis |
4.2 Market Drivers |
4.2.1 Government initiatives promoting renewable energy sources |
4.2.2 Increasing demand for reliable and sustainable power supply |
4.2.3 Growing focus on reducing carbon footprint and promoting clean energy solutions |
4.3 Market Restraints |
4.3.1 Limited infrastructure for grid connectivity |
4.3.2 High initial investment costs for setting up virtual power plants |
4.3.3 Lack of awareness and understanding about virtual power plant technology among consumers |
5 Burkina Faso Virtual Power Plant Market Trends |
6 Burkina Faso Virtual Power Plant Market Segmentations |
6.1 Burkina Faso Virtual Power Plant Market, By Enabling Technology |
6.1.1 Overview and Analysis |
6.1.2 Burkina Faso Virtual Power Plant Market Revenues & Volume, By Dem, 2021-2031F |
6.1.3 Burkina Faso Virtual Power Plant Market Revenues & Volume, By Response, 2021-2031F |
6.1.4 Burkina Faso Virtual Power Plant Market Revenues & Volume, By Distributed Generation, 2021-2031F |
6.1.5 Burkina Faso Virtual Power Plant Market Revenues & Volume, By Mixed Asset, 2021-2031F |
6.2 Burkina Faso Virtual Power Plant Market, By End Use |
6.2.1 Overview and Analysis |
6.2.2 Burkina Faso Virtual Power Plant Market Revenues & Volume, By Commercial & Industrial, 2021-2031F |
6.2.3 Burkina Faso Virtual Power Plant Market Revenues & Volume, By Residential, 2021-2031F |
7 Burkina Faso Virtual Power Plant Market Import-Export Trade Statistics |
7.1 Burkina Faso Virtual Power Plant Market Export to Major Countries |
7.2 Burkina Faso Virtual Power Plant Market Imports from Major Countries |
8 Burkina Faso Virtual Power Plant Market Key Performance Indicators |
8.1 Capacity utilization rate of virtual power plants |
8.2 Integration of renewable energy sources into the virtual power plant network |
8.3 Percentage of peak load management achieved by virtual power plants |
9 Burkina Faso Virtual Power Plant Market - Opportunity Assessment |
9.1 Burkina Faso Virtual Power Plant Market Opportunity Assessment, By Enabling Technology, 2021 & 2031F |
9.2 Burkina Faso Virtual Power Plant Market Opportunity Assessment, By End Use, 2021 & 2031F |
10 Burkina Faso Virtual Power Plant Market - Competitive Landscape |
10.1 Burkina Faso Virtual Power Plant Market Revenue Share, By Companies, 2024 |
10.2 Burkina Faso Virtual Power Plant Market Competitive Benchmarking, By Operating and Technical Parameters |
11 Company Profiles |
12 Recommendations | 13 Disclaimer |
Global Go To Market Strategy - 2030
Export potential enables firms to identify high-growth global markets with greater confidence by combining advanced trade intelligence with a structured quantitative methodology. The framework analyzes emerging demand trends and country-level import patterns while integrating macroeconomic and trade datasets such as GDP and population forecasts, bilateral import–export flows, tariff structures, elasticity differentials between developed and developing economies, geographic distance, and import demand projections. Using weighted trade values from 2020–2024 as the base period to project country-to-country export potential for 2030, these inputs are operationalized through calculated drivers such as gravity model parameters, tariff impact factors, and projected GDP per-capita growth. Through an analysis of hidden potentials, demand hotspots, and market conditions that are most favorable to success, this method enables firms to focus on target countries, maximize returns, and global expansion with data, backed by accuracy.
By factoring in the projected importer demand gap that is currently unmet and could be potential opportunity, it identifies the potential for the Exporter (Country) among 190 countries, against the general trade analysis, which identifies the biggest importer or exporter.
To discover high-growth global markets and optimize your business strategy:
Click Here
Pricing
- Single User License$ 1,995
- Department License$ 2,400
- Site License$ 3,120
- Global License$ 3,795

Leadership Perspectives from Industry Events
Search
Thought Leadership and Analyst Meet


Our Clients
6WResearch In News
- India Export Attractiveness Tracker 2026
- India Air Conditioner Market Set for Strong Rebound in 2026 After Weather-Led Correction and GST-Driven Recovery: 6Wresearch
- ADAS in India: How Automatic Emergency Braking, Blind Spot Detection & Driver Monitoring are Transforming Road Safety
- Doha a strategic location for EV manufacturing hub: IPA Qatar
- Demand for luxury TVs surging in the GCC, says Samsung
- Empowering Growth: The Thriving Journey of Bangladesh’s Cable Industry
Latest Reports
- Nicaragua RPG Gaming Market (2026-2032)
- New Zealand RPG Gaming Market (2026-2032)
- Netherlands RPG Gaming Market (2026-2032)
- Nauru RPG Gaming Market (2026-2032)
- Namibia RPG Gaming Market (2026-2032)
- Mozambique RPG Gaming Market (2026-2032)
- Montenegro RPG Gaming Market (2026-2032)
- Mongolia RPG Gaming Market (2026-2032)
- Monaco RPG Gaming Market (2026-2032)
- Micronesia RPG Gaming Market (2026-2032)
Industry Events and Analyst Meet

EV India Expo 2026

HIMTEX 2026

India Refining Summit 2026

India EV Show 2026

EV tech India Expo 2026
Whitepaper
- Middle East & Africa Commercial Security Market Click here to view more.
- Middle East & Africa Fire Safety Systems & Equipment Market Click here to view more.
- GCC Drone Market Click here to view more.
- Middle East Lighting Fixture Market Click here to view more.
- GCC Physical & Perimeter Security Market Click here to view more.