Burundi Ion exchange resins Market (2025-2031) | Industry, Revenue, Analysis, Companies, Share, Growth, Outlook, Trends, Value, Size, Segmentation & Forecast
Market Forecast By Type (Cationic Resins, Anionic Resins, Others), By Application (Water, Non-water), By End-use Industry (Power, Chemical & Petrochemical, Food & Beverage, Pharmaceutical, Electrical & Electronics, Metal & Mining, Others) And Competitive Landscape
| Product Code: ETC4721114 | Publication Date: Nov 2023 | Updated Date: Apr 2025 | Product Type: Market Research Report | |
| Publisher: 6Wresearch | Author: Shubham Deep | No. of Pages: 60 | No. of Figures: 30 | No. of Tables: 5 |
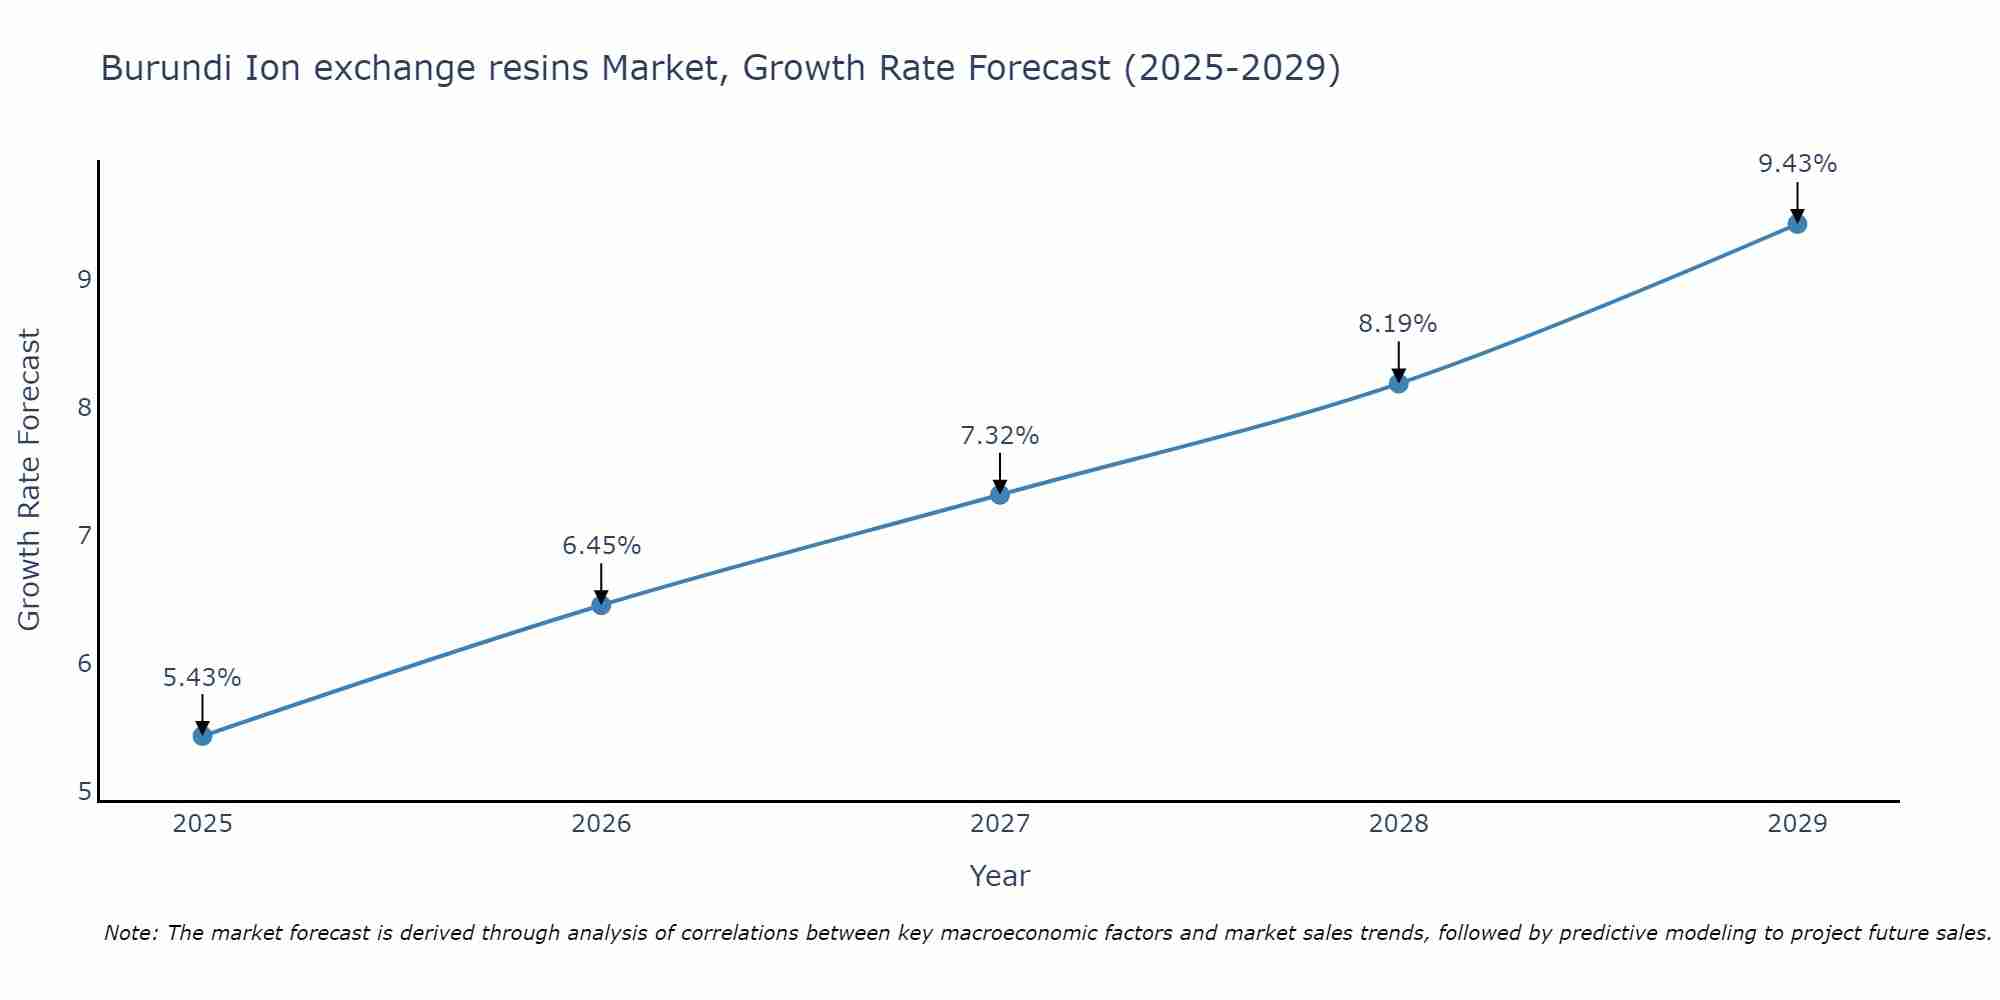
Burundi Ion exchange resins Market Size Growth Rate
The Burundi Ion exchange resins Market is poised for steady growth rate improvements from 2025 to 2029. Commencing at 5.43% in 2025, growth builds up to 9.43% by 2029.
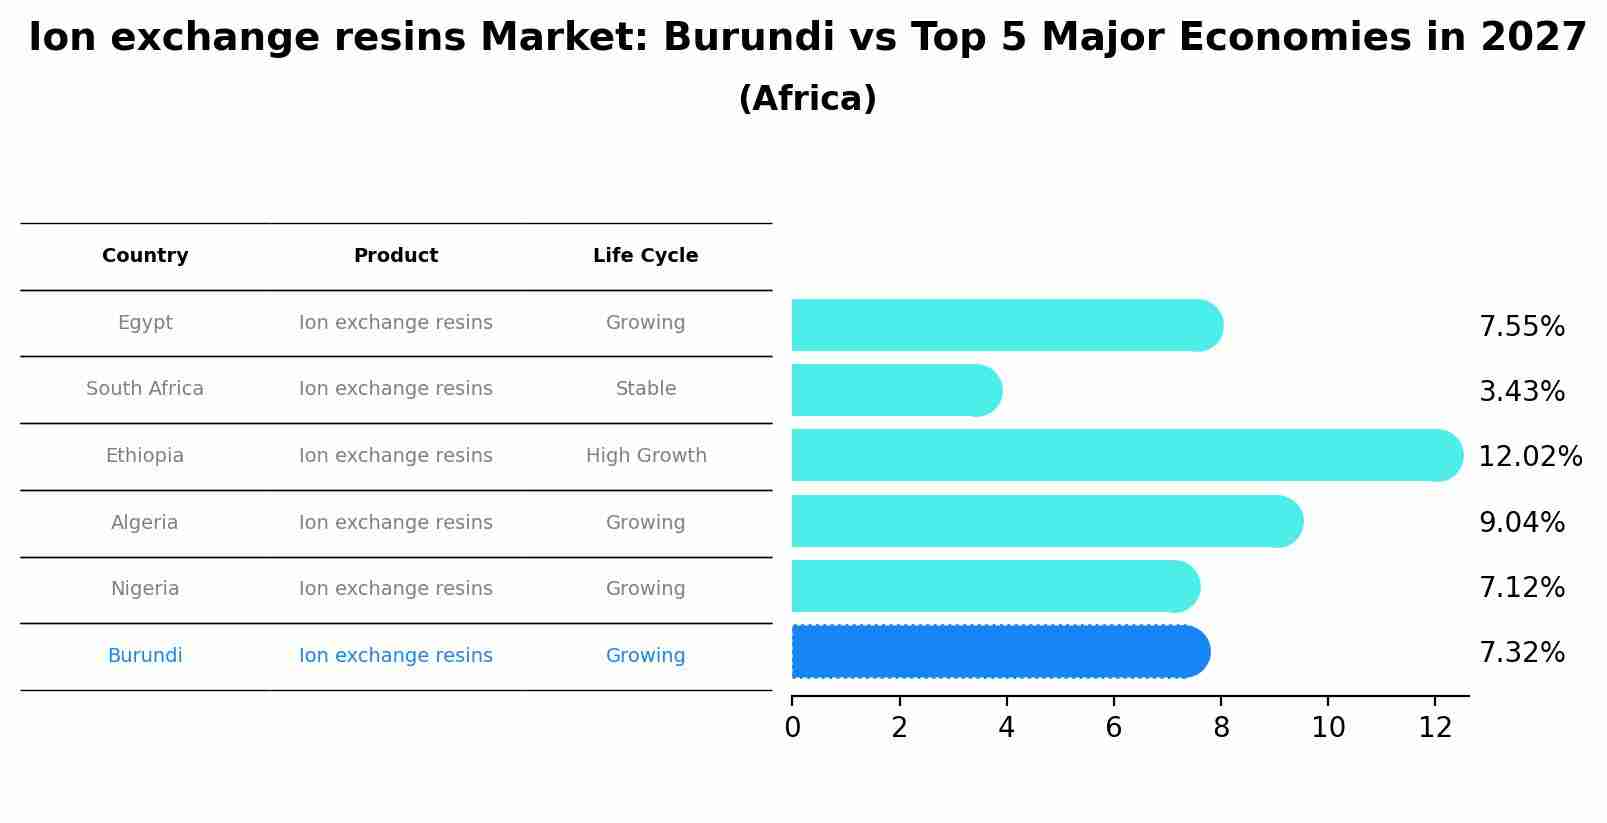
Ion exchange resins Market: Burundi vs Top 5 Major Economies in 2027 (Africa)
The Ion exchange resins market in Burundi is projected to grow at a growing growth rate of 7.32% by 2027, within the Africa region led by Egypt, along with other countries like South Africa, Ethiopia, Algeria and Nigeria, collectively shaping a dynamic and evolving market environment driven by innovation and increasing adoption of emerging technologies.
Burundi Ion exchange resins Market Overview
The ion exchange resins market in Burundi involves materials used to remove ions from solutions in water treatment, chemical processing, and other applications. These resins are essential for purifying and conditioning water, as well as for various industrial processes. The market is driven by the increasing demand for clean water and efficient chemical processing solutions.
/h3
The Burundi Ion Exchange Resins Market is influenced by the demand for resins used in water treatment, chemical processing, and industrial applications. Ion exchange resins are essential for removing contaminants and purifying liquids. The growth in water treatment infrastructure and the need for high-purity chemicals support market expansion.
/h3
The ion exchange resins market in Burundi is constrained by high import costs and limited local production capabilities. Limited awareness of the benefits and applications of ion exchange resins among businesses impacts market growth. Additionally, logistical challenges related to the import and distribution of resins, coupled with a shortage of skilled professionals and support services, further hinder market development. Inadequate infrastructure affects the efficiency of ion exchange resin utilization.
/h3
Government policies in Burundi shape the ion exchange resins market by supporting the use of resins in water treatment and industrial processes. The government promotes the adoption of ion exchange technologies through regulations that ensure effectiveness and environmental compliance. Incentives for local production and investment in water treatment technologies drive market growth as Burundi improves its infrastructure and industrial capabilities.
Key Highlights of the Report:
- Burundi Ion exchange resins Market Outlook
- Market Size of Burundi Ion exchange resins Market, 2024
- Forecast of Burundi Ion exchange resins Market, 2031
- Historical Data and Forecast of Burundi Ion exchange resins Revenues & Volume for the Period 2021-2031
- Burundi Ion exchange resins Market Trend Evolution
- Burundi Ion exchange resins Market Drivers and Challenges
- Burundi Ion exchange resins Price Trends
- Burundi Ion exchange resins Porter`s Five Forces
- Burundi Ion exchange resins Industry Life Cycle
- Historical Data and Forecast of Burundi Ion exchange resins Market Revenues & Volume By Type for the Period 2021-2031
- Historical Data and Forecast of Burundi Ion exchange resins Market Revenues & Volume By Cationic Resins for the Period 2021-2031
- Historical Data and Forecast of Burundi Ion exchange resins Market Revenues & Volume By Anionic Resins for the Period 2021-2031
- Historical Data and Forecast of Burundi Ion exchange resins Market Revenues & Volume By Others for the Period 2021-2031
- Historical Data and Forecast of Burundi Ion exchange resins Market Revenues & Volume By Application for the Period 2021-2031
- Historical Data and Forecast of Burundi Ion exchange resins Market Revenues & Volume By Water for the Period 2021-2031
- Historical Data and Forecast of Burundi Ion exchange resins Market Revenues & Volume By Non-water for the Period 2021-2031
- Historical Data and Forecast of Burundi Ion exchange resins Market Revenues & Volume By End-use Industry for the Period 2021-2031
- Historical Data and Forecast of Burundi Ion exchange resins Market Revenues & Volume By Power for the Period 2021-2031
- Historical Data and Forecast of Burundi Ion exchange resins Market Revenues & Volume By Chemical & Petrochemical for the Period 2021-2031
- Historical Data and Forecast of Burundi Ion exchange resins Market Revenues & Volume By Food & Beverage for the Period 2021-2031
- Historical Data and Forecast of Burundi Ion exchange resins Market Revenues & Volume By Pharmaceutical for the Period 2021-2031
- Historical Data and Forecast of Burundi Ion exchange resins Market Revenues & Volume By Electrical & Electronics for the Period 2021-2031
- Historical Data and Forecast of Burundi Ion exchange resins Market Revenues & Volume By Metal & Mining for the Period 2021-2031
- Historical Data and Forecast of Burundi Ion exchange resins Market Revenues & Volume By Others for the Period 2021-2031
- Burundi Ion exchange resins Import Export Trade Statistics
- Market Opportunity Assessment By Type
- Market Opportunity Assessment By Application
- Market Opportunity Assessment By End-use Industry
- Burundi Ion exchange resins Top Companies Market Share
- Burundi Ion exchange resins Competitive Benchmarking By Technical and Operational Parameters
- Burundi Ion exchange resins Company Profiles
- Burundi Ion exchange resins Key Strategic Recommendations
Frequently Asked Questions About the Market Study (FAQs):
6Wresearch actively monitors the Burundi Ion exchange resins Market and publishes its comprehensive annual report, highlighting emerging trends, growth drivers, revenue analysis, and forecast outlook. Our insights help businesses to make data-backed strategic decisions with ongoing market dynamics. Our analysts track relevent industries related to the Burundi Ion exchange resins Market, allowing our clients with actionable intelligence and reliable forecasts tailored to emerging regional needs.
Yes, we provide customisation as per your requirements. To learn more, feel free to contact us on sales@6wresearch.com
1 Executive Summary |
2 Introduction |
2.1 Key Highlights of the Report |
2.2 Report Description |
2.3 Market Scope & Segmentation |
2.4 Research Methodology |
2.5 Assumptions |
3 Burundi Ion exchange resins Market Overview |
3.1 Burundi Country Macro Economic Indicators |
3.2 Burundi Ion exchange resins Market Revenues & Volume, 2021 & 2031F |
3.3 Burundi Ion exchange resins Market - Industry Life Cycle |
3.4 Burundi Ion exchange resins Market - Porter's Five Forces |
3.5 Burundi Ion exchange resins Market Revenues & Volume Share, By Type, 2021 & 2031F |
3.6 Burundi Ion exchange resins Market Revenues & Volume Share, By Application, 2021 & 2031F |
3.7 Burundi Ion exchange resins Market Revenues & Volume Share, By End-use Industry, 2021 & 2031F |
4 Burundi Ion exchange resins Market Dynamics |
4.1 Impact Analysis |
4.2 Market Drivers |
4.3 Market Restraints |
5 Burundi Ion exchange resins Market Trends |
6 Burundi Ion exchange resins Market Segmentations |
6.1 Burundi Ion exchange resins Market, By Type |
6.1.1 Overview and Analysis |
6.1.2 Burundi Ion exchange resins Market Revenues & Volume, By Cationic Resins, 2021-2031F |
6.1.3 Burundi Ion exchange resins Market Revenues & Volume, By Anionic Resins, 2021-2031F |
6.1.4 Burundi Ion exchange resins Market Revenues & Volume, By Others, 2021-2031F |
6.2 Burundi Ion exchange resins Market, By Application |
6.2.1 Overview and Analysis |
6.2.2 Burundi Ion exchange resins Market Revenues & Volume, By Water, 2021-2031F |
6.2.3 Burundi Ion exchange resins Market Revenues & Volume, By Non-water, 2021-2031F |
6.3 Burundi Ion exchange resins Market, By End-use Industry |
6.3.1 Overview and Analysis |
6.3.2 Burundi Ion exchange resins Market Revenues & Volume, By Power, 2021-2031F |
6.3.3 Burundi Ion exchange resins Market Revenues & Volume, By Chemical & Petrochemical, 2021-2031F |
6.3.4 Burundi Ion exchange resins Market Revenues & Volume, By Food & Beverage, 2021-2031F |
6.3.5 Burundi Ion exchange resins Market Revenues & Volume, By Pharmaceutical, 2021-2031F |
6.3.6 Burundi Ion exchange resins Market Revenues & Volume, By Electrical & Electronics, 2021-2031F |
6.3.7 Burundi Ion exchange resins Market Revenues & Volume, By Metal & Mining, 2021-2031F |
7 Burundi Ion exchange resins Market Import-Export Trade Statistics |
7.1 Burundi Ion exchange resins Market Export to Major Countries |
7.2 Burundi Ion exchange resins Market Imports from Major Countries |
8 Burundi Ion exchange resins Market Key Performance Indicators |
9 Burundi Ion exchange resins Market - Opportunity Assessment |
9.1 Burundi Ion exchange resins Market Opportunity Assessment, By Type, 2021 & 2031F |
9.2 Burundi Ion exchange resins Market Opportunity Assessment, By Application, 2021 & 2031F |
9.3 Burundi Ion exchange resins Market Opportunity Assessment, By End-use Industry, 2021 & 2031F |
10 Burundi Ion exchange resins Market - Competitive Landscape |
10.1 Burundi Ion exchange resins Market Revenue Share, By Companies, 2024 |
10.2 Burundi Ion exchange resins Market Competitive Benchmarking, By Operating and Technical Parameters |
11 Company Profiles |
12 Recommendations | 13 Disclaimer |
Global Go To Market Strategy - 2030
Export potential enables firms to identify high-growth global markets with greater confidence by combining advanced trade intelligence with a structured quantitative methodology. The framework analyzes emerging demand trends and country-level import patterns while integrating macroeconomic and trade datasets such as GDP and population forecasts, bilateral import–export flows, tariff structures, elasticity differentials between developed and developing economies, geographic distance, and import demand projections. Using weighted trade values from 2020–2024 as the base period to project country-to-country export potential for 2030, these inputs are operationalized through calculated drivers such as gravity model parameters, tariff impact factors, and projected GDP per-capita growth. Through an analysis of hidden potentials, demand hotspots, and market conditions that are most favorable to success, this method enables firms to focus on target countries, maximize returns, and global expansion with data, backed by accuracy.
By factoring in the projected importer demand gap that is currently unmet and could be potential opportunity, it identifies the potential for the Exporter (Country) among 190 countries, against the general trade analysis, which identifies the biggest importer or exporter.
To discover high-growth global markets and optimize your business strategy:
Click Here
Pricing
- Single User License$ 1,995
- Department License$ 2,400
- Site License$ 3,120
- Global License$ 3,795

Leadership Perspectives from Industry Events
Search
Thought Leadership and Analyst Meet


Our Clients
6WResearch In News
- India Export Attractiveness Tracker 2026
- India Air Conditioner Market Set for Strong Rebound in 2026 After Weather-Led Correction and GST-Driven Recovery: 6Wresearch
- ADAS in India: How Automatic Emergency Braking, Blind Spot Detection & Driver Monitoring are Transforming Road Safety
- Doha a strategic location for EV manufacturing hub: IPA Qatar
- Demand for luxury TVs surging in the GCC, says Samsung
- Empowering Growth: The Thriving Journey of Bangladesh’s Cable Industry
Latest Reports
- Nicaragua RPG Gaming Market (2026-2032)
- New Zealand RPG Gaming Market (2026-2032)
- Netherlands RPG Gaming Market (2026-2032)
- Nauru RPG Gaming Market (2026-2032)
- Namibia RPG Gaming Market (2026-2032)
- Mozambique RPG Gaming Market (2026-2032)
- Montenegro RPG Gaming Market (2026-2032)
- Mongolia RPG Gaming Market (2026-2032)
- Monaco RPG Gaming Market (2026-2032)
- Micronesia RPG Gaming Market (2026-2032)
Industry Events and Analyst Meet

EV India Expo 2026

HIMTEX 2026

India Refining Summit 2026

India EV Show 2026

EV tech India Expo 2026
Whitepaper
- Middle East & Africa Commercial Security Market Click here to view more.
- Middle East & Africa Fire Safety Systems & Equipment Market Click here to view more.
- GCC Drone Market Click here to view more.
- Middle East Lighting Fixture Market Click here to view more.
- GCC Physical & Perimeter Security Market Click here to view more.