Canada Butyric Acid Market (2026-2032) | Size, Revenue, Segmentation, Forecast, Growth, Companies, Share, Industry, Outlook, Value, Analysis & Trends
Market Forecast By Type (Natural Butyric Acid, Synthetic Butyric Acid), By Derivatives (Sodium Butyrate, Calcium Butyrate, Others), By Application (Animal Feed, Chemical Intermediate, Food and Flavors, Pharmaceuticals, Perfumes, Inks, Paints & Coatings, Others) And Competitive Landscape
| Product Code: ETC4734017 | Publication Date: Nov 2023 | Updated Date: Mar 2026 | Product Type: Market Research Report | |
| Publisher: 6Wresearch | Author: Shubham Deep | No. of Pages: 60 | No. of Figures: 30 | No. of Tables: 5 |
Canada Butyric Acid Market Year-wise Growth Rate (2021-2031F)
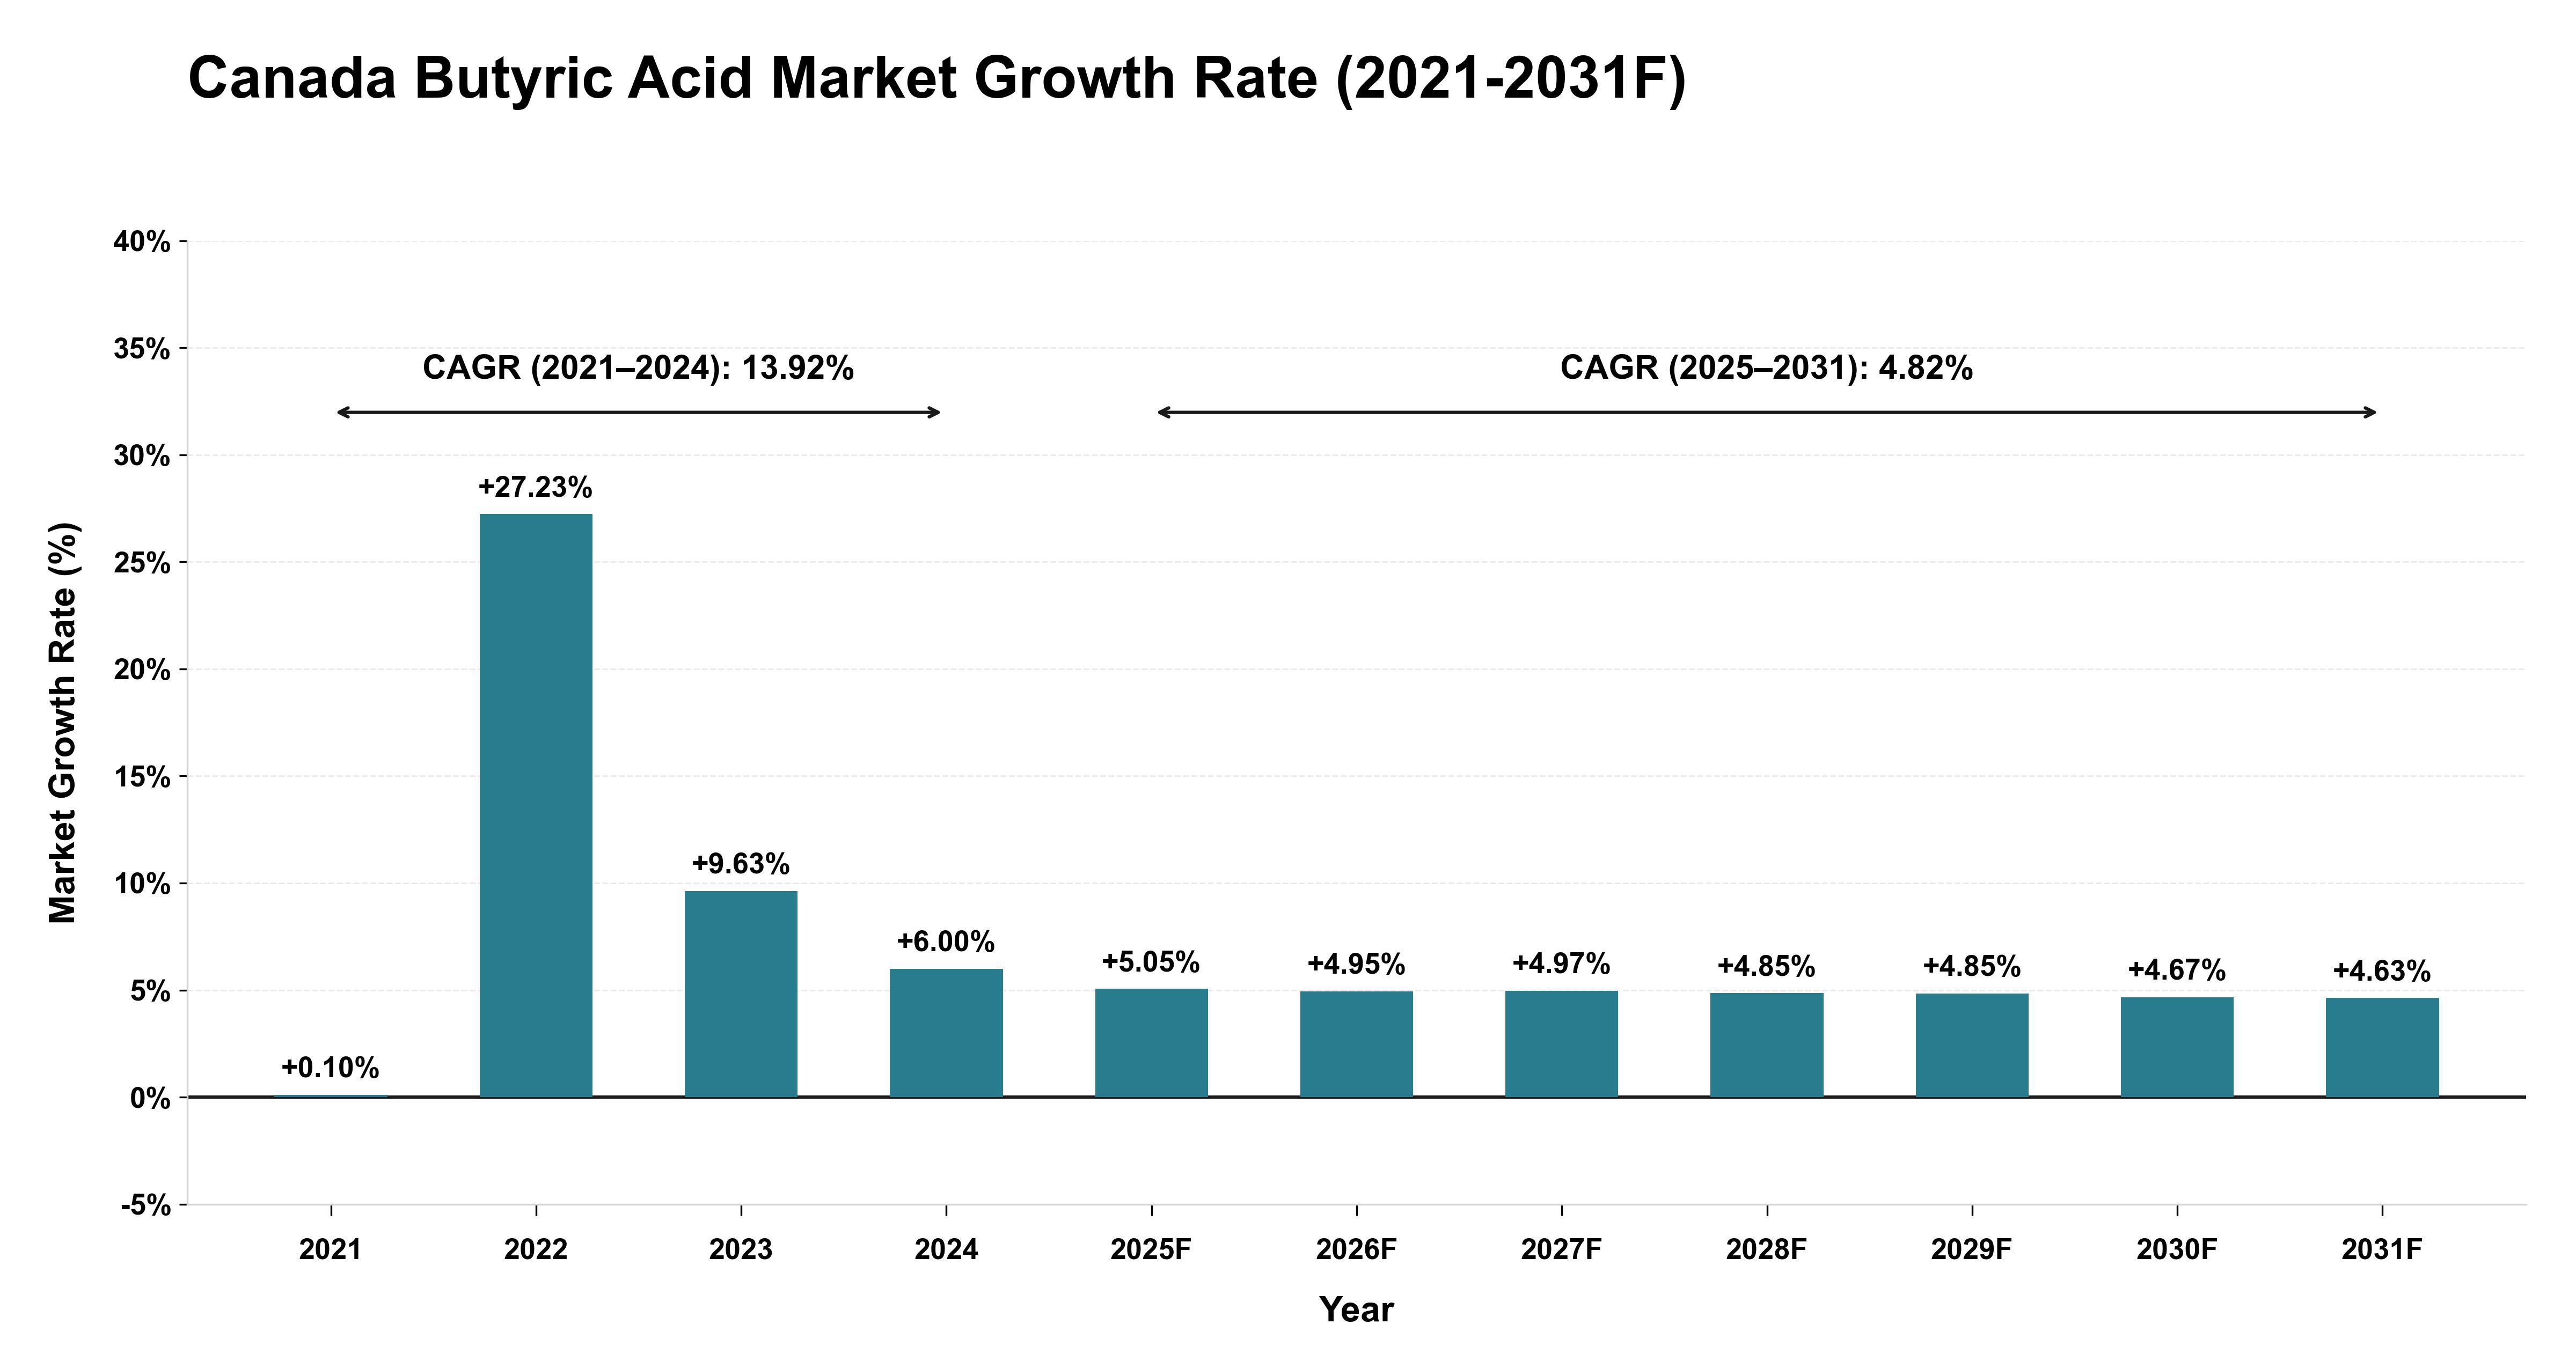
In the Canada Butyric Acid Market, from 2021 to 2024, the product witnessed fluctuating growth rates, starting with a modest increase in 2021 at 0.10%, followed by a substantial surge in 2022 at 27.23%, stabilizing somewhat in the subsequent years with growth rates of 9.63% in 2023 and 6.00% in 2024. These fluctuations could be attributed to shifts in end-use industries like food and pharmaceuticals, supply chain disruptions, and evolving regulatory frameworks impacting demand patterns. Looking ahead to the forecast period from 2025 to 2031, the market is expected to experience a more moderate growth trend with an annual rate of 4.82%. This deceleration could be influenced by market saturation in key segments, technological advancements reducing production costs, and increasing competition leading to price stabilization. The gradual growth trajectory during this period reflects a maturing market landscape requiring strategic adaptations for sustained profitability.
Canada Butyric Acid Market Overview
The Butyric Acid market in Canada is driven by its applications in food flavoring, pharmaceuticals, and industrial chemicals. Butyric acid is valued for its distinctive flavor and odor, and its role in the production of various esters and chemicals. The market is influenced by consumer preferences, regulatory standards, and the growing demand for natural and synthetic flavoring agents. As industries focus on enhancing product formulations and expanding applications, the demand for butyric acid in Canada is anticipated to grow, supported by innovations in chemical synthesis and applications.
Drivers of the market
The butyric acid market in Canada is expanding with the increasing use of butyric acid in food, pharmaceuticals, and industrial applications. Butyric acid is used as a flavoring agent, in the production of pharmaceuticals, and as a chemical intermediate. The market is driven by advancements in butyric acid production technologies, the growing demand for butyric acid in various industries, and the rising consumer preference for natural and functional ingredients. The expansion of industrial applications and the focus on product quality further contribute to market growth.
Challenges of the market
Challenges in the butyric acid market in Canada include the unpleasant odor of butyric acid, which limits its use in certain applications. Additionally, competition from synthetic alternatives in industries such as food and pharmaceuticals is impacting the market for naturally derived butyric acid.
Government Policy of the market
Canadas butyric acid market is shaped by agricultural and food safety regulations. Government policies promoting the use of natural feed additives in animal nutrition and supporting organic farming practices drive the market for butyric acid.
Key Highlights of the Report:
- Canada Butyric Acid Market Outlook
- Market Size of Canada Butyric Acid Market, 2025
- Forecast of Canada Butyric Acid Market, 2032
- Historical Data and Forecast of Canada Butyric Acid Revenues & Volume for the Period 2022-2032F
- Canada Butyric Acid Market Trend Evolution
- Canada Butyric Acid Market Drivers and Challenges
- Canada Butyric Acid Price Trends
- Canada Butyric Acid Porter`s Five Forces
- Canada Butyric Acid Industry Life Cycle
- Historical Data and Forecast of Canada Butyric Acid Market Revenues & Volume By Type for the Period 2022-2032F
- Historical Data and Forecast of Canada Butyric Acid Market Revenues & Volume By Natural Butyric Acid for the Period 2022-2032F
- Historical Data and Forecast of Canada Butyric Acid Market Revenues & Volume By Synthetic Butyric Acid for the Period 2022-2032F
- Historical Data and Forecast of Canada Butyric Acid Market Revenues & Volume By Derivatives for the Period 2022-2032F
- Historical Data and Forecast of Canada Butyric Acid Market Revenues & Volume By Sodium Butyrate for the Period 2022-2032F
- Historical Data and Forecast of Canada Butyric Acid Market Revenues & Volume By Calcium Butyrate for the Period 2022-2032F
- Historical Data and Forecast of Canada Butyric Acid Market Revenues & Volume By Others for the Period 2022-2032F
- Historical Data and Forecast of Canada Butyric Acid Market Revenues & Volume By Application for the Period 2022-2032F
- Historical Data and Forecast of Canada Butyric Acid Market Revenues & Volume By Animal Feed for the Period 2022-2032F
- Historical Data and Forecast of Canada Butyric Acid Market Revenues & Volume By Chemical Intermediate for the Period 2022-2032F
- Historical Data and Forecast of Canada Butyric Acid Market Revenues & Volume By Food and Flavors for the Period 2022-2032F
- Historical Data and Forecast of Canada Butyric Acid Market Revenues & Volume By Pharmaceuticals for the Period 2022-2032F
- Historical Data and Forecast of Canada Butyric Acid Market Revenues & Volume By Perfumes for the Period 2022-2032F
- Historical Data and Forecast of Canada Butyric Acid Market Revenues & Volume By Inks for the Period 2022-2032F
- Historical Data and Forecast of Canada Butyric Acid Market Revenues & Volume By Paints & Coatings for the Period 2022-2032F
- Historical Data and Forecast of Canada Butyric Acid Market Revenues & Volume By Others for the Period 2022-2032F
- Canada Butyric Acid Import Export Trade Statistics
- Market Opportunity Assessment By Type
- Market Opportunity Assessment By Derivatives
- Market Opportunity Assessment By Application
- Canada Butyric Acid Top Companies Market Share
- Canada Butyric Acid Competitive Benchmarking By Technical and Operational Parameters
- Canada Butyric Acid Company Profiles
- Canada Butyric Acid Key Strategic Recommendations
Canada Butyric Acid Market (2026-2032): FAQs
6Wresearch actively monitors the Canada Butyric Acid Market and publishes its comprehensive annual report, highlighting emerging trends, growth drivers, revenue analysis, and forecast outlook. Our insights help businesses to make data-backed strategic decisions with ongoing market dynamics. Our analysts track relevent industries related to the Canada Butyric Acid Market, allowing our clients with actionable intelligence and reliable forecasts tailored to emerging regional needs.
Yes, we provide customisation as per your requirements. To learn more, feel free to contact us on sales@6wresearch.com
1 Executive Summary |
2 Introduction |
2.1 Key Highlights of the Report |
2.2 Report Description |
2.3 Market Scope & Segmentation |
2.4 Research Methodology |
2.5 Assumptions |
3 Canada Butyric Acid Market Overview |
3.1 Canada Country Macro Economic Indicators |
3.2 Canada Butyric Acid Market Revenues & Volume, 2022 & 2032F |
3.3 Canada Butyric Acid Market - Industry Life Cycle |
3.4 Canada Butyric Acid Market - Porter's Five Forces |
3.5 Canada Butyric Acid Market Revenues & Volume Share, By Type, 2022 & 2032F |
3.6 Canada Butyric Acid Market Revenues & Volume Share, By Derivatives, 2022 & 2032F |
3.7 Canada Butyric Acid Market Revenues & Volume Share, By Application, 2022 & 2032F |
4 Canada Butyric Acid Market Dynamics |
4.1 Impact Analysis |
4.2 Market Drivers |
4.2.1 Increasing demand for animal feed additives |
4.2.2 Growing usage in food and beverage industry |
4.2.3 Rising awareness about the benefits of butyric acid in healthcare sector |
4.3 Market Restraints |
4.3.1 Fluctuating prices of raw materials |
4.3.2 Stringent regulations related to butyric acid production and usage |
5 Canada Butyric Acid Market Trends |
6 Canada Butyric Acid Market Segmentations |
6.1 Canada Butyric Acid Market, By Type |
6.1.1 Overview and Analysis |
6.1.2 Canada Butyric Acid Market Revenues & Volume, By Natural Butyric Acid, 2022-2032F |
6.1.3 Canada Butyric Acid Market Revenues & Volume, By Synthetic Butyric Acid, 2022-2032F |
6.2 Canada Butyric Acid Market, By Derivatives |
6.2.1 Overview and Analysis |
6.2.2 Canada Butyric Acid Market Revenues & Volume, By Sodium Butyrate, 2022-2032F |
6.2.3 Canada Butyric Acid Market Revenues & Volume, By Calcium Butyrate, 2022-2032F |
6.2.4 Canada Butyric Acid Market Revenues & Volume, By Others, 2022-2032F |
6.3 Canada Butyric Acid Market, By Application |
6.3.1 Overview and Analysis |
6.3.2 Canada Butyric Acid Market Revenues & Volume, By Animal Feed, 2022-2032F |
6.3.3 Canada Butyric Acid Market Revenues & Volume, By Chemical Intermediate, 2022-2032F |
6.3.4 Canada Butyric Acid Market Revenues & Volume, By Food and Flavors, 2022-2032F |
6.3.5 Canada Butyric Acid Market Revenues & Volume, By Pharmaceuticals, 2022-2032F |
6.3.6 Canada Butyric Acid Market Revenues & Volume, By Perfumes, 2022-2032F |
6.3.7 Canada Butyric Acid Market Revenues & Volume, By Inks, 2022-2032F |
6.3.8 Canada Butyric Acid Market Revenues & Volume, By Others, 2022-2032F |
6.3.9 Canada Butyric Acid Market Revenues & Volume, By Others, 2022-2032F |
7 Canada Butyric Acid Market Import-Export Trade Statistics |
7.1 Canada Butyric Acid Market Export to Major Countries |
7.2 Canada Butyric Acid Market Imports from Major Countries |
8 Canada Butyric Acid Market Key Performance Indicators |
8.1 Research and development investment in new applications of butyric acid |
8.2 Number of new product launches containing butyric acid |
8.3 Adoption rate of butyric acid in different industries |
9 Canada Butyric Acid Market - Opportunity Assessment |
9.1 Canada Butyric Acid Market Opportunity Assessment, By Type, 2022 & 2032F |
9.2 Canada Butyric Acid Market Opportunity Assessment, By Derivatives, 2022 & 2032F |
9.3 Canada Butyric Acid Market Opportunity Assessment, By Application, 2022 & 2032F |
10 Canada Butyric Acid Market - Competitive Landscape |
10.1 Canada Butyric Acid Market Revenue Share, By Companies, 2025 |
10.2 Canada Butyric Acid Market Competitive Benchmarking, By Operating and Technical Parameters |
11 Company Profiles |
12 Recommendations | 13 Disclaimer |
Global Go To Market Strategy - 2030
Export potential enables firms to identify high-growth global markets with greater confidence by combining advanced trade intelligence with a structured quantitative methodology. The framework analyzes emerging demand trends and country-level import patterns while integrating macroeconomic and trade datasets such as GDP and population forecasts, bilateral import–export flows, tariff structures, elasticity differentials between developed and developing economies, geographic distance, and import demand projections. Using weighted trade values from 2020–2024 as the base period to project country-to-country export potential for 2030, these inputs are operationalized through calculated drivers such as gravity model parameters, tariff impact factors, and projected GDP per-capita growth. Through an analysis of hidden potentials, demand hotspots, and market conditions that are most favorable to success, this method enables firms to focus on target countries, maximize returns, and global expansion with data, backed by accuracy.
By factoring in the projected importer demand gap that is currently unmet and could be potential opportunity, it identifies the potential for the Exporter (Country) among 190 countries, against the general trade analysis, which identifies the biggest importer or exporter.
To discover high-growth global markets and optimize your business strategy:
Click Here
Pricing
- Single User License$ 1,995
- Department License$ 2,400
- Site License$ 3,120
- Global License$ 3,795

Leadership Perspectives from Industry Events
Search
Thought Leadership and Analyst Meet


Our Clients
6WResearch In News
- India Export Attractiveness Tracker 2026
- India Air Conditioner Market Set for Strong Rebound in 2026 After Weather-Led Correction and GST-Driven Recovery: 6Wresearch
- ADAS in India: How Automatic Emergency Braking, Blind Spot Detection & Driver Monitoring are Transforming Road Safety
- Doha a strategic location for EV manufacturing hub: IPA Qatar
- Demand for luxury TVs surging in the GCC, says Samsung
- Empowering Growth: The Thriving Journey of Bangladesh’s Cable Industry
Latest Reports
- Nicaragua RPG Gaming Market (2026-2032)
- New Zealand RPG Gaming Market (2026-2032)
- Netherlands RPG Gaming Market (2026-2032)
- Nauru RPG Gaming Market (2026-2032)
- Namibia RPG Gaming Market (2026-2032)
- Mozambique RPG Gaming Market (2026-2032)
- Montenegro RPG Gaming Market (2026-2032)
- Mongolia RPG Gaming Market (2026-2032)
- Monaco RPG Gaming Market (2026-2032)
- Micronesia RPG Gaming Market (2026-2032)
Industry Events and Analyst Meet

EV India Expo 2026

HIMTEX 2026

India Refining Summit 2026

India EV Show 2026

EV tech India Expo 2026
Whitepaper
- Middle East & Africa Commercial Security Market Click here to view more.
- Middle East & Africa Fire Safety Systems & Equipment Market Click here to view more.
- GCC Drone Market Click here to view more.
- Middle East Lighting Fixture Market Click here to view more.
- GCC Physical & Perimeter Security Market Click here to view more.