Chile Paper Cone Market (2026-2032) Outlook | Analysis, Industry, Revenue, Trends, Forecast, Companies, Value, Growth, Share & Size
Market Forecast By Type (Tight Bong Paper Cone, Jumbo Paper Cone, Yarn Paper Cone, Printed Paper Cone), By Bobbins (Textile Paper Cone, Wax Paper Cone, Conical Paper Cone, Construction Cone, Plain Paper Cone, Others), By Number of Piles (Single Ply, Multiple Ply, ), By Taper of the Cone (Upto 30 Taper, 30 To 50 Taper, Above 50 Taper), By Size (1-Degree 51-Minutes Cone, 3-Degree 51-Minutes Cone, 5-Degree 57-Minutes Cone, 3-Degree 30-Minutes Cone, 6-Degree 20-Minutes Cone, 9-Degree 51-Minutes Cone, 9-Degree 36-Minutes Cone, Others), By Distribution Channel (Direct Sales/B2B, Specialist Retailers, Convenience Stores, Supermarkets/Hypermarkets, E-Commerce, Others), By End-User (Textile, Construction, Others) And Competitive Landscape
| Product Code: ETC337328 | Publication Date: Aug 2022 | Updated Date: Mar 2026 | Product Type: Market Research Report | |
| Publisher: 6Wresearch | Author: Ravi Bhandari | No. of Pages: 75 | No. of Figures: 35 | No. of Tables: 20 |
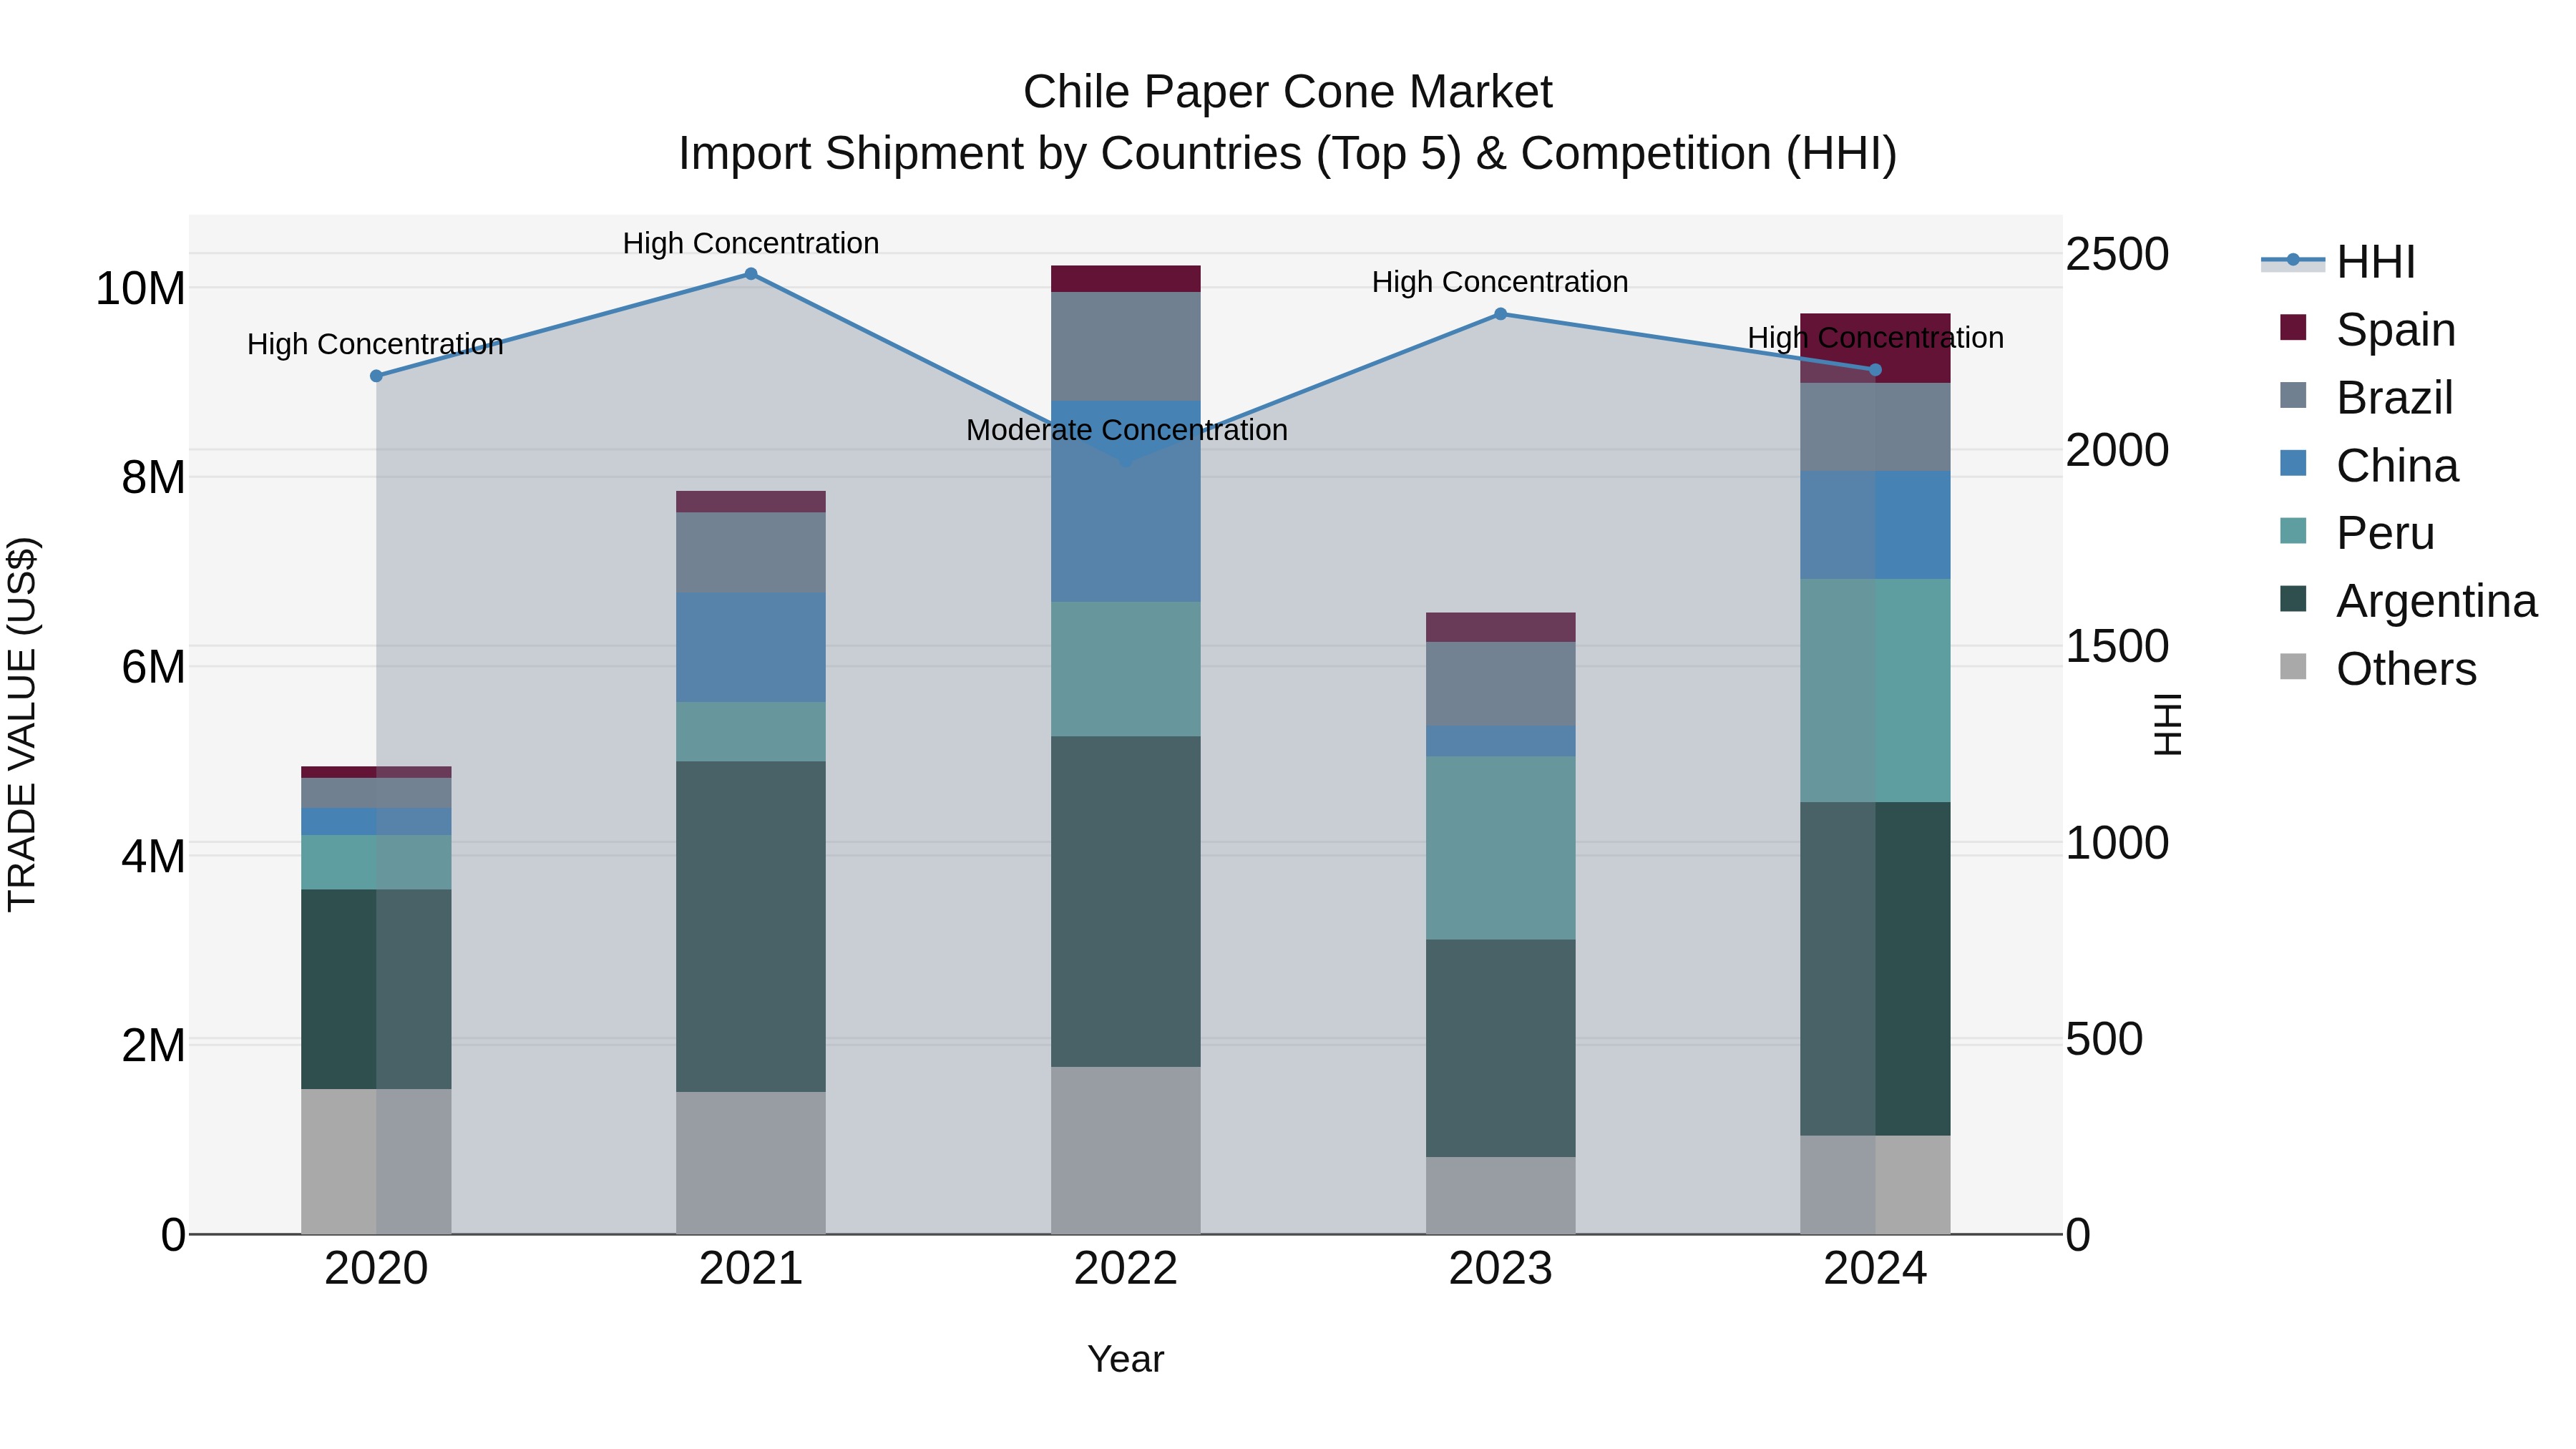
Chile Paper Cone Market Top 5 Importing Countries and Market Competition (HHI) Analysis
Chile`s import shipments of paper cones in 2024 continued to show a high concentration, with top exporting countries including Argentina, Peru, China, Brazil, and Spain. The HHI remained elevated, indicating a market dominated by a few key players. The impressive compound annual growth rate (CAGR) of 18.43% from 2020 to 2024 reflects a strong upward trajectory in demand for paper cones in Chile. Furthermore, the remarkable growth rate of 48.1% from 2023 to 2024 signals a significant surge in imports, highlighting the potential opportunities within this market segment.
Key Highlights of the Report:
- Chile Paper Cone Market Outlook
- Market Size of Chile Paper Cone Market, 2025
- Forecast of Chile Paper Cone Market, 2032
- Historical Data and Forecast of Chile Paper Cone Revenues & Volume for the Period 2022 - 2032F
- Chile Paper Cone Market Trend Evolution
- Chile Paper Cone Market Drivers and Challenges
- Chile Paper Cone Price Trends
- Chile Paper Cone Porter's Five Forces
- Chile Paper Cone Industry Life Cycle
- Historical Data and Forecast of Chile Paper Cone Market Revenues & Volume By Type for the Period 2022 - 2032F
- Historical Data and Forecast of Chile Paper Cone Market Revenues & Volume By Tight Bong Paper Cone for the Period 2022 - 2032F
- Historical Data and Forecast of Chile Paper Cone Market Revenues & Volume By Jumbo Paper Cone for the Period 2022 - 2032F
- Historical Data and Forecast of Chile Paper Cone Market Revenues & Volume By Yarn Paper Cone for the Period 2022 - 2032F
- Historical Data and Forecast of Chile Paper Cone Market Revenues & Volume By Printed Paper Cone for the Period 2022 - 2032F
- Historical Data and Forecast of Chile Paper Cone Market Revenues & Volume By Bobbins for the Period 2022 - 2032F
- Historical Data and Forecast of Chile Paper Cone Market Revenues & Volume By Textile Paper Cone for the Period 2022 - 2032F
- Historical Data and Forecast of Chile Paper Cone Market Revenues & Volume By Wax Paper Cone for the Period 2022 - 2032F
- Historical Data and Forecast of Chile Paper Cone Market Revenues & Volume By Conical Paper Cone for the Period 2022 - 2032F
- Historical Data and Forecast of Chile Paper Cone Market Revenues & Volume By Construction Cone for the Period 2022 - 2032F
- Historical Data and Forecast of Chile Paper Cone Market Revenues & Volume By Plain Paper Cone for the Period 2022 - 2032F
- Historical Data and Forecast of Chile Paper Cone Market Revenues & Volume By Others for the Period 2022 - 2032F
- Historical Data and Forecast of Chile Paper Cone Market Revenues & Volume By Number of Piles for the Period 2022 - 2032F
- Historical Data and Forecast of Chile Paper Cone Market Revenues & Volume By Single Ply for the Period 2022 - 2032F
- Historical Data and Forecast of Chile Paper Cone Market Revenues & Volume By Multiple Ply for the Period 2022 - 2032F
- Historical Data and Forecast of Chile Paper Cone Market Revenues & Volume By for the Period 2022 - 2032F
- Historical Data and Forecast of Chile Paper Cone Market Revenues & Volume By Taper of the Cone for the Period 2022 - 2032F
- Historical Data and Forecast of Chile Paper Cone Market Revenues & Volume By Upto 30 Taper for the Period 2022 - 2032F
- Historical Data and Forecast of Chile Paper Cone Market Revenues & Volume By 30 To 50 Taper for the Period 2022 - 2032F
- Historical Data and Forecast of Chile Paper Cone Market Revenues & Volume By Above 50 Taper for the Period 2022 - 2032F
- Historical Data and Forecast of Chile Paper Cone Market Revenues & Volume By Size for the Period 2022 - 2032F
- Historical Data and Forecast of Chile Paper Cone Market Revenues & Volume By 1-Degree 51-Minutes Cone for the Period 2022 - 2032F
- Historical Data and Forecast of Chile Paper Cone Market Revenues & Volume By 3-Degree 51-Minutes Cone for the Period 2022 - 2032F
- Historical Data and Forecast of Chile Paper Cone Market Revenues & Volume By 5-Degree 57-Minutes Cone for the Period 2022 - 2032F
- Historical Data and Forecast of Chile Paper Cone Market Revenues & Volume By 3-Degree 30-Minutes Cone for the Period 2022 - 2032F
- Historical Data and Forecast of Chile Paper Cone Market Revenues & Volume By 6-Degree 20-Minutes Cone for the Period 2022 - 2032F
- Historical Data and Forecast of Chile Paper Cone Market Revenues & Volume By 9-Degree 51-Minutes Cone for the Period 2022 - 2032F
- Historical Data and Forecast of Chile Paper Cone Market Revenues & Volume By 9-Degree 36-Minutes Cone for the Period 2022 - 2032F
- Historical Data and Forecast of Chile Paper Cone Market Revenues & Volume By Others for the Period 2022 - 2032F
- Historical Data and Forecast of Chile Paper Cone Market Revenues & Volume By Distribution Channel for the Period 2022 - 2032F
- Historical Data and Forecast of Chile Paper Cone Market Revenues & Volume By Direct Sales/B2B for the Period 2022 - 2032F
- Historical Data and Forecast of Chile Paper Cone Market Revenues & Volume By Specialist Retailers for the Period 2022 - 2032F
- Historical Data and Forecast of Chile Paper Cone Market Revenues & Volume By Convenience Stores for the Period 2022 - 2032F
- Historical Data and Forecast of Chile Paper Cone Market Revenues & Volume By Supermarkets/Hypermarkets for the Period 2022 - 2032F
- Historical Data and Forecast of Chile Paper Cone Market Revenues & Volume By E-Commerce for the Period 2022 - 2032F
- Historical Data and Forecast of Chile Paper Cone Market Revenues & Volume By Others for the Period 2022 - 2032F
- Historical Data and Forecast of Chile Paper Cone Market Revenues & Volume By End-User for the Period 2022 - 2032F
- Historical Data and Forecast of Chile Paper Cone Market Revenues & Volume By Textile for the Period 2022 - 2032F
- Historical Data and Forecast of Chile Paper Cone Market Revenues & Volume By Construction for the Period 2022 - 2032F
- Historical Data and Forecast of Chile Paper Cone Market Revenues & Volume By Others for the Period 2022 - 2032F
- Chile Paper Cone Import Export Trade Statistics
- Market Opportunity Assessment By Type
- Market Opportunity Assessment By Bobbins
- Market Opportunity Assessment By Number of Piles
- Market Opportunity Assessment By Taper of the Cone
- Market Opportunity Assessment By Size
- Market Opportunity Assessment By Distribution Channel
- Market Opportunity Assessment By End-User
- Chile Paper Cone Top Companies Market Share
- Chile Paper Cone Competitive Benchmarking By Technical and Operational Parameters
- Chile Paper Cone Company Profiles
- Chile Paper Cone Key Strategic Recommendations
Frequently Asked Questions About the Market Study (FAQs):
6Wresearch actively monitors the Chile Paper Cone Market and publishes its comprehensive annual report, highlighting emerging trends, growth drivers, revenue analysis, and forecast outlook. Our insights help businesses to make data-backed strategic decisions with ongoing market dynamics. Our analysts track relevent industries related to the Chile Paper Cone Market, allowing our clients with actionable intelligence and reliable forecasts tailored to emerging regional needs.
Yes, we provide customisation as per your requirements. To learn more, feel free to contact us on sales@6wresearch.com
1 Executive Summary |
2 Introduction |
2.1 Key Highlights of the Report |
2.2 Report Description |
2.3 Market Scope & Segmentation |
2.4 Research Methodology |
2.5 Assumptions |
3 Chile Paper Cone Market Overview |
3.1 Chile Country Macro Economic Indicators |
3.2 Chile Paper Cone Market Revenues & Volume, 2022 & 2032F |
3.3 Chile Paper Cone Market - Industry Life Cycle |
3.4 Chile Paper Cone Market - Porter's Five Forces |
3.5 Chile Paper Cone Market Revenues & Volume Share, By Type, 2022 & 2032F |
3.6 Chile Paper Cone Market Revenues & Volume Share, By Bobbins, 2022 & 2032F |
3.7 Chile Paper Cone Market Revenues & Volume Share, By Number of Piles, 2022 & 2032F |
3.8 Chile Paper Cone Market Revenues & Volume Share, By Taper of the Cone, 2022 & 2032F |
3.9 Chile Paper Cone Market Revenues & Volume Share, By Size, 2022 & 2032F |
3.10 Chile Paper Cone Market Revenues & Volume Share, By Distribution Channel, 2022 & 2032F |
3.11 Chile Paper Cone Market Revenues & Volume Share, By End-User, 2022 & 2032F |
4 Chile Paper Cone Market Dynamics |
4.1 Impact Analysis |
4.2 Market Drivers |
4.2.1 Increasing awareness about environmental sustainability leading to a shift towards biodegradable packaging solutions. |
4.2.2 Growing foodservice industry and increasing demand for convenient and portable food packaging solutions. |
4.2.3 Rising popularity of street food culture and food trucks, driving the demand for disposable packaging like chile paper cones. |
4.3 Market Restraints |
4.3.1 Fluctuating raw material prices impacting production costs. |
4.3.2 Intense competition from alternative packaging solutions like plastic or Styrofoam containers. |
5 Chile Paper Cone Market Trends |
6 Chile Paper Cone Market, By Types |
6.1 Chile Paper Cone Market, By Type |
6.1.1 Overview and Analysis |
6.1.2 Chile Paper Cone Market Revenues & Volume, By Type, 2022 - 2032F |
6.1.3 Chile Paper Cone Market Revenues & Volume, By Tight Bong Paper Cone, 2022 - 2032F |
6.1.4 Chile Paper Cone Market Revenues & Volume, By Jumbo Paper Cone, 2022 - 2032F |
6.1.5 Chile Paper Cone Market Revenues & Volume, By Yarn Paper Cone, 2022 - 2032F |
6.1.6 Chile Paper Cone Market Revenues & Volume, By Printed Paper Cone, 2022 - 2032F |
6.2 Chile Paper Cone Market, By Bobbins |
6.2.1 Overview and Analysis |
6.2.2 Chile Paper Cone Market Revenues & Volume, By Textile Paper Cone, 2022 - 2032F |
6.2.3 Chile Paper Cone Market Revenues & Volume, By Wax Paper Cone, 2022 - 2032F |
6.2.4 Chile Paper Cone Market Revenues & Volume, By Conical Paper Cone, 2022 - 2032F |
6.2.5 Chile Paper Cone Market Revenues & Volume, By Construction Cone, 2022 - 2032F |
6.2.6 Chile Paper Cone Market Revenues & Volume, By Plain Paper Cone, 2022 - 2032F |
6.2.7 Chile Paper Cone Market Revenues & Volume, By Others, 2022 - 2032F |
6.3 Chile Paper Cone Market, By Number of Piles |
6.3.1 Overview and Analysis |
6.3.2 Chile Paper Cone Market Revenues & Volume, By Single Ply, 2022 - 2032F |
6.3.3 Chile Paper Cone Market Revenues & Volume, By Multiple Ply, 2022 - 2032F |
6.3.4 Chile Paper Cone Market Revenues & Volume, By , 2022 - 2032F |
6.4 Chile Paper Cone Market, By Taper of the Cone |
6.4.1 Overview and Analysis |
6.4.2 Chile Paper Cone Market Revenues & Volume, By Upto 30 Taper, 2022 - 2032F |
6.4.3 Chile Paper Cone Market Revenues & Volume, By 30 To 50 Taper, 2022 - 2032F |
6.4.4 Chile Paper Cone Market Revenues & Volume, By Above 50 Taper, 2022 - 2032F |
6.5 Chile Paper Cone Market, By Size |
6.5.1 Overview and Analysis |
6.5.2 Chile Paper Cone Market Revenues & Volume, By 1-Degree 51-Minutes Cone, 2022 - 2032F |
6.5.3 Chile Paper Cone Market Revenues & Volume, By 3-Degree 51-Minutes Cone, 2022 - 2032F |
6.5.4 Chile Paper Cone Market Revenues & Volume, By 5-Degree 57-Minutes Cone, 2022 - 2032F |
6.5.5 Chile Paper Cone Market Revenues & Volume, By 3-Degree 30-Minutes Cone, 2022 - 2032F |
6.5.6 Chile Paper Cone Market Revenues & Volume, By 6-Degree 20-Minutes Cone, 2022 - 2032F |
6.5.7 Chile Paper Cone Market Revenues & Volume, By 9-Degree 51-Minutes Cone, 2022 - 2032F |
6.5.8 Chile Paper Cone Market Revenues & Volume, By Others, 2022 - 2032F |
6.5.9 Chile Paper Cone Market Revenues & Volume, By Others, 2022 - 2032F |
6.6 Chile Paper Cone Market, By Distribution Channel |
6.6.1 Overview and Analysis |
6.6.2 Chile Paper Cone Market Revenues & Volume, By Direct Sales/B2B, 2022 - 2032F |
6.6.3 Chile Paper Cone Market Revenues & Volume, By Specialist Retailers, 2022 - 2032F |
6.6.4 Chile Paper Cone Market Revenues & Volume, By Convenience Stores, 2022 - 2032F |
6.6.5 Chile Paper Cone Market Revenues & Volume, By Supermarkets/Hypermarkets, 2022 - 2032F |
6.6.6 Chile Paper Cone Market Revenues & Volume, By E-Commerce, 2022 - 2032F |
6.6.7 Chile Paper Cone Market Revenues & Volume, By Others, 2022 - 2032F |
6.7 Chile Paper Cone Market, By End-User |
6.7.1 Overview and Analysis |
6.7.2 Chile Paper Cone Market Revenues & Volume, By Textile, 2022 - 2032F |
6.7.3 Chile Paper Cone Market Revenues & Volume, By Construction, 2022 - 2032F |
6.7.4 Chile Paper Cone Market Revenues & Volume, By , 2022 - 2032F |
7 Chile Paper Cone Market Import-Export Trade Statistics |
7.1 Chile Paper Cone Market Export to Major Countries |
7.2 Chile Paper Cone Market Imports from Major Countries |
8 Chile Paper Cone Market Key Performance Indicators |
8.1 Percentage of biodegradable materials used in chile paper cone production. |
8.2 Number of foodservice establishments using chile paper cones as packaging. |
8.3 Growth in demand for chile paper cones in food truck events or street food markets. |
9 Chile Paper Cone Market - Opportunity Assessment |
9.1 Chile Paper Cone Market Opportunity Assessment, By Type, 2022 & 2032F |
9.2 Chile Paper Cone Market Opportunity Assessment, By Bobbins, 2022 & 2032F |
9.3 Chile Paper Cone Market Opportunity Assessment, By Number of Piles, 2022 & 2032F |
9.4 Chile Paper Cone Market Opportunity Assessment, By Taper of the Cone, 2022 & 2032F |
9.5 Chile Paper Cone Market Opportunity Assessment, By Size, 2022 & 2032F |
9.6 Chile Paper Cone Market Opportunity Assessment, By Distribution Channel, 2022 & 2032F |
9.7 Chile Paper Cone Market Opportunity Assessment, By End-User, 2022 & 2032F |
10 Chile Paper Cone Market - Competitive Landscape |
10.1 Chile Paper Cone Market Revenue Share, By Companies, 2025 |
10.2 Chile Paper Cone Market Competitive Benchmarking, By Operating and Technical Parameters |
11 Company Profiles |
12 Recommendations |
13 Disclaimer |
Global Go To Market Strategy - 2030
Export potential enables firms to identify high-growth global markets with greater confidence by combining advanced trade intelligence with a structured quantitative methodology. The framework analyzes emerging demand trends and country-level import patterns while integrating macroeconomic and trade datasets such as GDP and population forecasts, bilateral import–export flows, tariff structures, elasticity differentials between developed and developing economies, geographic distance, and import demand projections. Using weighted trade values from 2020–2024 as the base period to project country-to-country export potential for 2030, these inputs are operationalized through calculated drivers such as gravity model parameters, tariff impact factors, and projected GDP per-capita growth. Through an analysis of hidden potentials, demand hotspots, and market conditions that are most favorable to success, this method enables firms to focus on target countries, maximize returns, and global expansion with data, backed by accuracy.
By factoring in the projected importer demand gap that is currently unmet and could be potential opportunity, it identifies the potential for the Exporter (Country) among 190 countries, against the general trade analysis, which identifies the biggest importer or exporter.
To discover high-growth global markets and optimize your business strategy:
Click Here
Pricing
- Single User License$ 1,995
- Department License$ 2,400
- Site License$ 3,120
- Global License$ 3,795

Leadership Perspectives from Industry Events
Search
Thought Leadership and Analyst Meet


Our Clients
6WResearch In News
- India Export Attractiveness Tracker 2026
- India Air Conditioner Market Set for Strong Rebound in 2026 After Weather-Led Correction and GST-Driven Recovery: 6Wresearch
- ADAS in India: How Automatic Emergency Braking, Blind Spot Detection & Driver Monitoring are Transforming Road Safety
- Doha a strategic location for EV manufacturing hub: IPA Qatar
- Demand for luxury TVs surging in the GCC, says Samsung
- Empowering Growth: The Thriving Journey of Bangladesh’s Cable Industry
Latest Reports
- Nicaragua RPG Gaming Market (2026-2032)
- New Zealand RPG Gaming Market (2026-2032)
- Netherlands RPG Gaming Market (2026-2032)
- Nauru RPG Gaming Market (2026-2032)
- Namibia RPG Gaming Market (2026-2032)
- Mozambique RPG Gaming Market (2026-2032)
- Montenegro RPG Gaming Market (2026-2032)
- Mongolia RPG Gaming Market (2026-2032)
- Monaco RPG Gaming Market (2026-2032)
- Micronesia RPG Gaming Market (2026-2032)
Industry Events and Analyst Meet

EV India Expo 2026

HIMTEX 2026

India Refining Summit 2026

India EV Show 2026

EV tech India Expo 2026
Whitepaper
- Middle East & Africa Commercial Security Market Click here to view more.
- Middle East & Africa Fire Safety Systems & Equipment Market Click here to view more.
- GCC Drone Market Click here to view more.
- Middle East Lighting Fixture Market Click here to view more.
- GCC Physical & Perimeter Security Market Click here to view more.