China Smart City AQ Network Market Size & Growth Rate
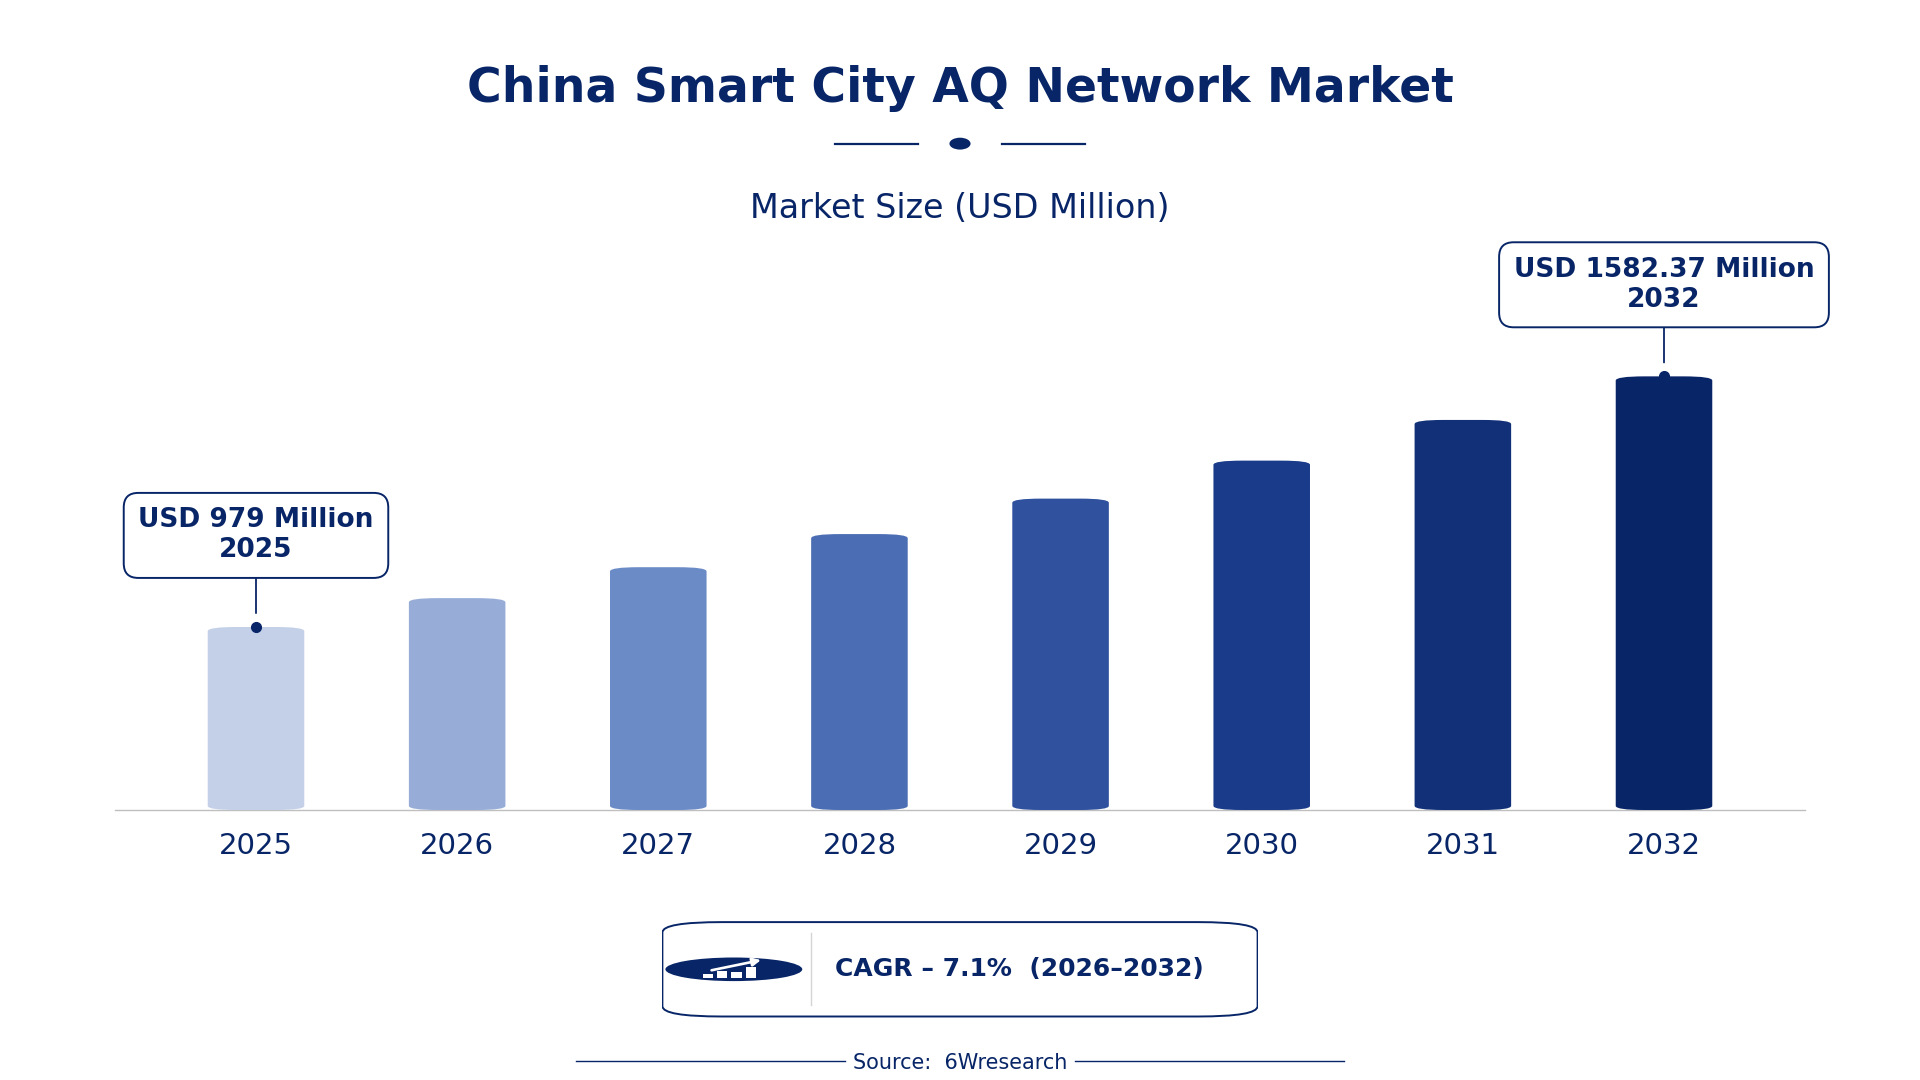
According to 6Wresearch internal database and industry insights, the China Smart City AQ Network Market was valued at USD 979.0 million in 2025 and is projected to reach USD 1,582.37 million by 2032, growing at a CAGR of approximately 7.1% during 2026–2032.
China Smart City AQ Network Market Highlights
| Report Metric | Details |
| Report Name | China Smart City AQ Network Market |
| Market Size 2025 | USD 979.0 million |
| Market Size 2032 | USD 1,582.37 million |
| Absolute Growth 2025–2032 | USD 603.37 million |
| CAGR 2026–2032 | 7.1% |
| Peak Annual Growth | 9.6% in 2032 |
| Forecast Period | 2026–2032 |
| Historical Data | 2022–2025 |
| Base Year | 2025 |
| Leading Network Type, 2025 | Fixed Monitoring Units (48% share) |
| Leading Monitored Parameters, 2025 | PM2.5 (44% share) |
| Leading Sensor Deployment Location, 2025 | Poles (38% share) |
| Leading End User, 2025 | City Governments (39% share) |
| Fastest-Growing Network Type | Mobile AQ Sensors (9.5% CAGR) |
| Fastest-Growing Monitored Parameters | CO₂ (8.7% CAGR) |
| Fastest-Growing Sensor Deployment Location | Buildings (9.8% CAGR) |
| Fastest-Growing End User | Environmental Agencies (9.6% CAGR) |
| Growing Sector | Environmental Monitoring |
| Key End Users | City Governments, Environmental Agencies, Research Institutions, Smart City Operators |
China Smart City AQ Network Market Year-wise Growth Rate and Key Drivers (2022–2032)
This graph illustrates the annual growth rates of the market from 2022 to 2032, highlighting a steady upward trajectory and projected market expansion over the forecast period.
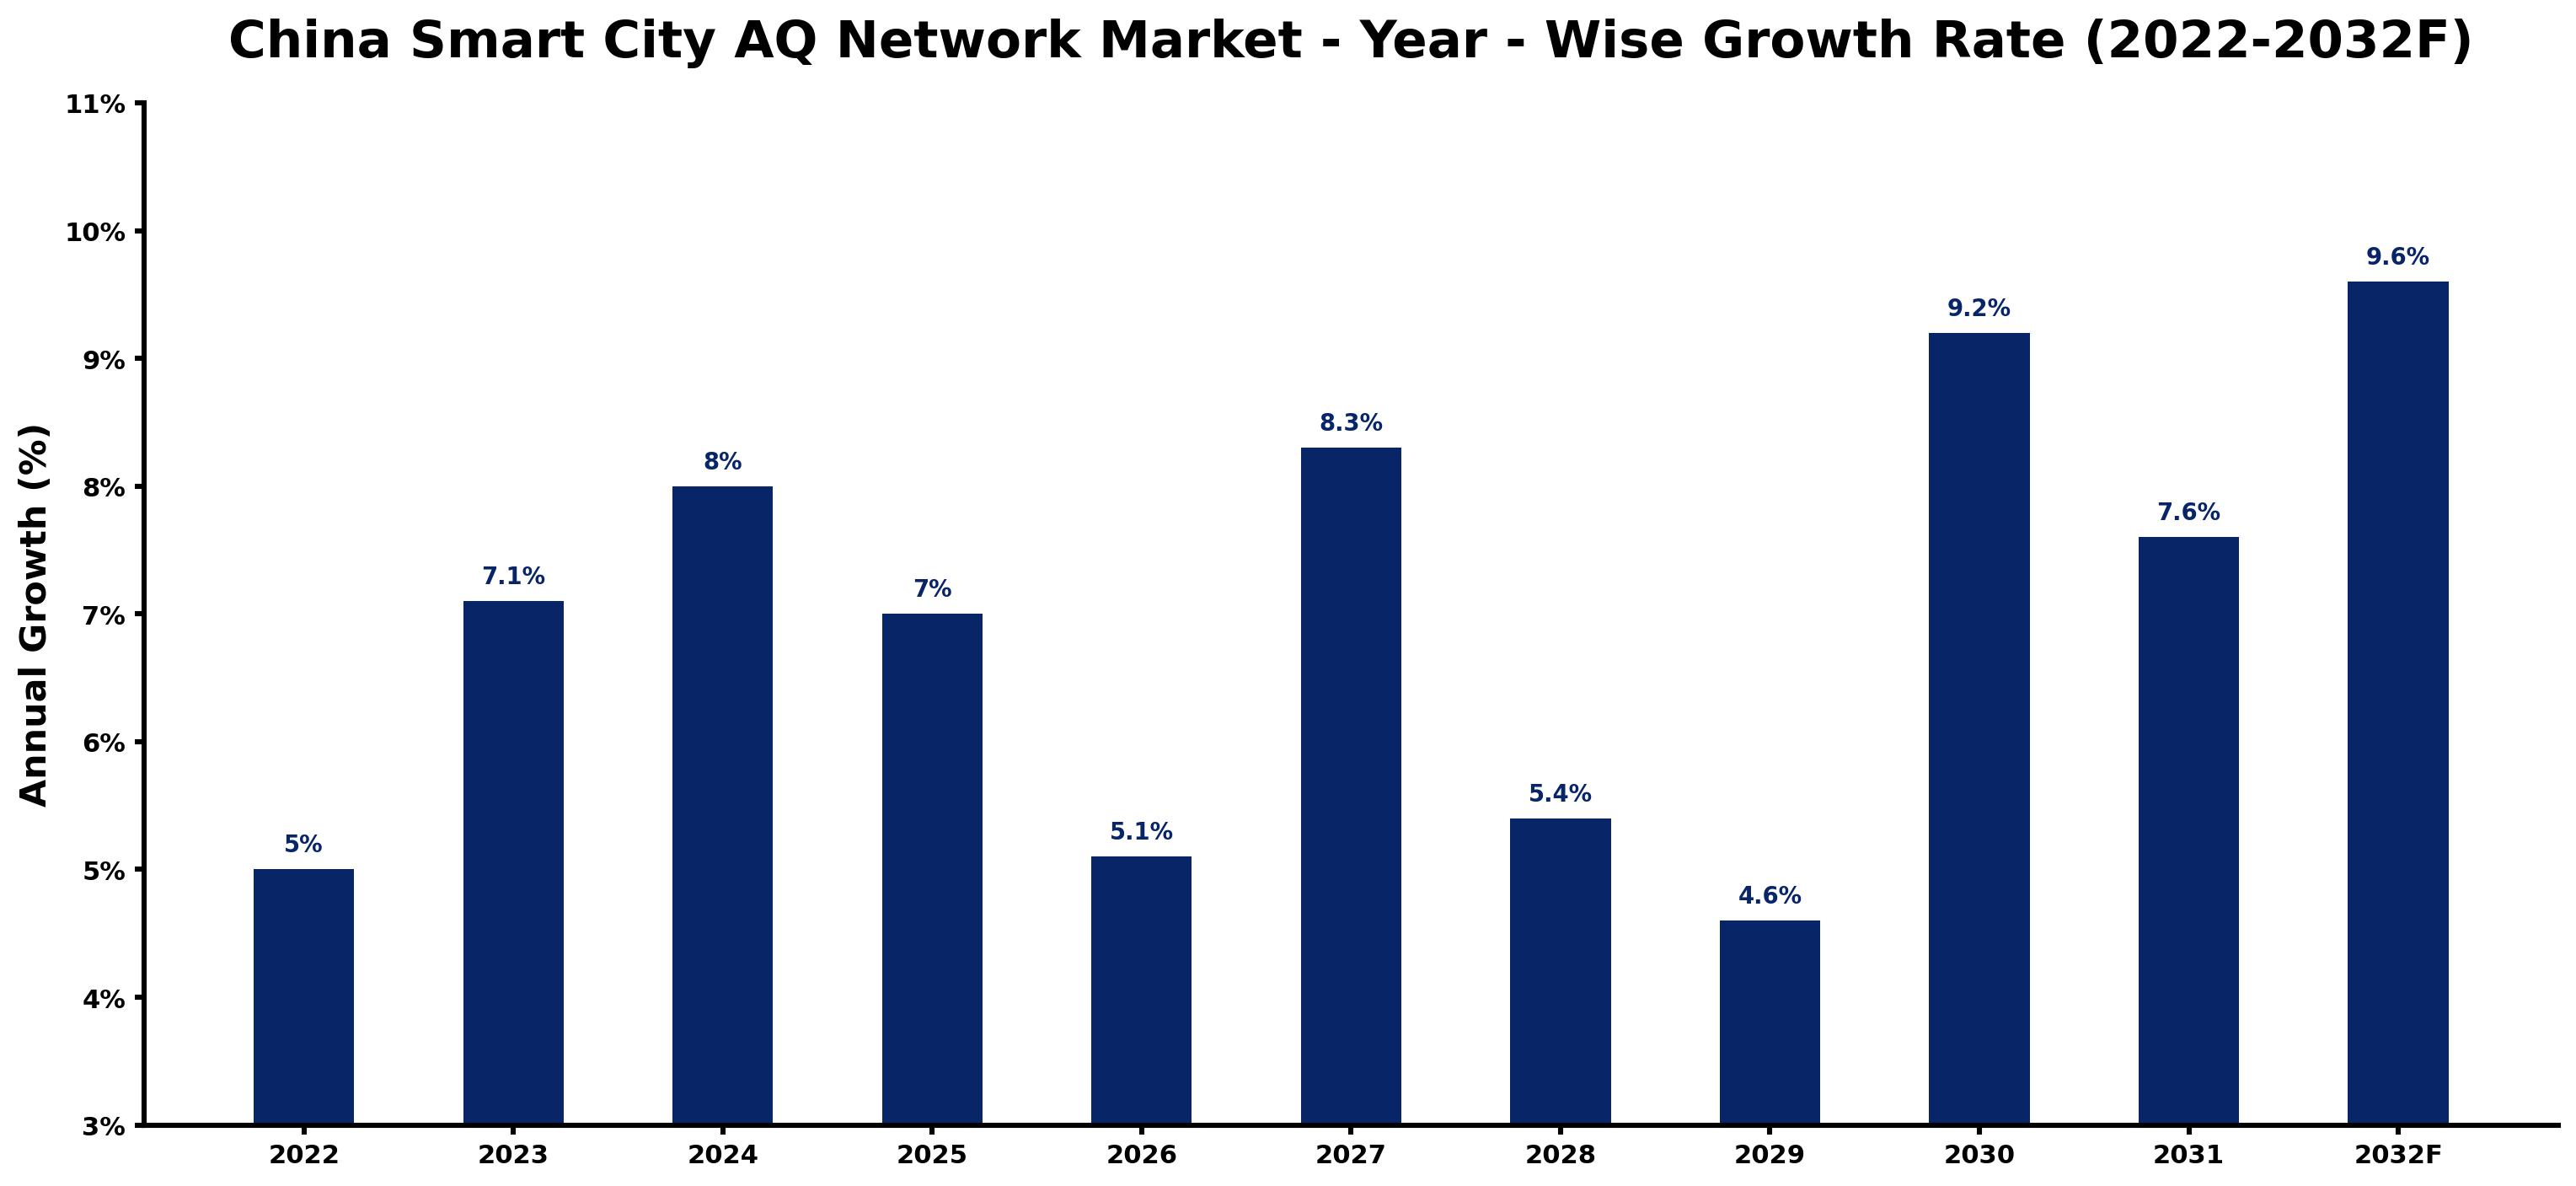
Annual growth estimates for each year appear below with the principal reason behind them, explaining the shifts that set the pace of the market.
| Year | Estimated Annual Growth (%) | Market Rationale |
| 2022 | 5.0 | The market experienced steady demand due to existing urban monitoring systems. |
| 2023 | 7.1 | Growth accelerated as city governments increased investments in air quality initiatives. |
| 2024 | 8.0 | Demand surged with the implementation of new environmental monitoring standards. |
| 2025 | 7.0 | The growth rate slowed as some cities reached saturation in sensor deployment. |
| 2026 | 5.1 | A further slowdown occurred as cities focused on optimising existing systems. |
| 2027 | 8.3 | The market rebounded with renewed interest in mobile air quality sensors. |
| 2028 | 5.4 | Growth decelerated as the focus shifted towards data integration and analysis. |
| 2029 | 4.6 | A continued slowdown reflected the need for system upgrades and maintenance. |
| 2030 | 9.2 | Demand surged again as cities aimed for improved air quality targets. |
| 2031 | 7.6 | The growth rate slowed as market maturity began to set in. |
| 2032 | 9.6 | The market peaked with significant investments in advanced monitoring technologies. |
Note: Market size estimations and growth projections presented in this report are based on 6Wresearch's proprietary forecasting methodology, utilizing the latest available industry data, government publications, and primary research inputs.
China Smart City AQ Network Market Synopsis
Smart City AQ Network in China encompasses a technology-driven system designed to monitor air quality through various sensors and data analytics. It integrates fixed and mobile sensors across urban areas, facilitating environmental monitoring, public health assessments, and urban planning. The market is expanding due to increased investments from city governments, environmental agencies, and research institutions. China's 14th Five-Year Plan emphasises smart city development and air quality improvements, driving demand for these systems. With over 100 cities implementing such networks, the market is poised for substantial growth in the coming years.
Market Dynamics Impact Analysis (2026–2032)
| Factor | Type | Impact | Primary Segment Affected |
| Increased investments from city governments in air quality monitoring systems | Driver | High | Fixed Monitoring Units |
| Growing public health awareness regarding air pollution levels | Driver | High | Mobile AQ Sensors |
| Emerging opportunities in urban areas with over 1 million residents | Opportunity | High | Real-Time Dashboards |
| Potential for partnerships with environmental agencies for data sharing | Opportunity | Medium | Satellite-Linked AQ |
| High initial investment costs for deploying comprehensive networks | Restraint | High | Fixed Monitoring Units |
| Regulatory compliance challenges with evolving air quality standards | Restraint | Medium | Mobile AQ Sensors |
| The Smart City AQ Network market faces significant budget constraints | Challenge | High | Real-Time Dashboards |
| Technological integration issues among different monitoring systems | Challenge | Medium | Satellite-Linked AQ |
Evaluation of Drivers in China Smart City AQ Network Market (2026–2032)
Key forces behind demand, with the segment each one moves most, are listed below.
| Drivers | Primary Segment Affected | Why It Matters (Evidence) |
| Increased funding for urban air quality initiatives | Fixed Monitoring Units | City governments are allocating more resources to improve air quality monitoring, with investments projected to reach USD 1 billion by 2025. |
| Rising public concern over health impacts of air pollution | Mobile AQ Sensors | Public health campaigns are driving demand for mobile sensors, supporting a growth rate of 9.5% for this segment. |
| Expansion of real-time data access through dashboards | Real-Time Dashboards | More cities are adopting real-time dashboards for public access, with over 50 major cities currently utilising this technology. |
| Increasing research activities using air quality data | Satellite-Linked AQ | Research institutions published over 200 studies in 2023, highlighting the need for effective air quality data. |
| Integration of smart technologies in urban planning | Mobile AQ Sensors | The push for smart city initiatives is increasing the deployment of mobile AQ sensors, with a CAGR of 9.5% expected. |
Market growth for Smart City AQ Network in China is underpinned by rising public concern over health impacts of air pollution, prompting city governments to allocate more resources for monitoring systems. In 2022, Beijing reported PM2.5 levels averaging 33 µg/m³, driving demand for fixed monitoring units. Real-time data access through dashboards is becoming essential, with many cities currently utilising this technology. Research institutions are increasingly using air quality data, having published over 200 studies in 2023, which further supports the demand for effective monitoring solutions.
Evaluation of Restraints in China Smart City AQ Network Market
The main factors holding the market back are set out below.
| Market Restraint | Primary Segment Affected | Why It Matters (Evidence) |
| High initial investment costs for air quality networks | Fixed Monitoring Units | The deployment of extensive monitoring systems requires considerable capital, which can deter city governments from full implementation. |
| Regulatory compliance challenges with evolving air quality standards | Mobile AQ Sensors | As standards change, cities face difficulties in ensuring compliance, affecting their ability to deploy new technologies. |
| Limited public funding for environmental initiatives | Real-Time Dashboards | Budget constraints in many municipalities hinder the expansion of real-time monitoring capabilities. |
| Insufficient data-sharing frameworks among stakeholders | Mobile AQ Sensors | Without effective data-sharing mechanisms, the potential of mobile sensors is not fully realised, limiting their impact. |
| Technological integration issues among different monitoring systems | Satellite-Linked AQ | The lack of standardisation complicates the integration of various monitoring technologies, delaying implementation. |
China Smart City AQ Network Market Challenges
Buyers in the China Smart City AQ Network market face supply chain disruptions due to reliance on imported components, which can delay project timelines by up to six months. Many cities encounter technology integration issues, as inadequate infrastructure hampers the deployment of advanced data analytics, leading to inefficient air quality systems. A shortage of skilled personnel is evident, with a significant gap in qualified experts to manage and interpret air quality data, reducing the effectiveness of monitoring efforts. Compliance with the Environmental Protection Law imposes additional costs on local governments for frequent updates to monitoring systems, straining budgets and resources.
Trends in the China Smart City AQ Network Market
Four trends stand out in the China Smart City AQ Network Market.
- Shift towards Real-Time Monitoring Solutions: There is a growing trend towards real-time monitoring solutions in urban areas. The implementation of real-time dashboards in over 50 major cities promotes public access to air quality data, enhancing transparency and awareness.
- Transition from Fixed to Mobile Sensors: Cities are increasingly adopting mobile air quality sensors for dynamic monitoring. For instance, Shanghai has deployed over 500 fixed monitoring units, but mobile solutions are gaining traction due to their flexibility.
- Emergence of Integrated Data Platforms: Integrated data platforms are becoming essential for effective air quality management. The National Air Quality Monitoring Network, with over 1,500 stations nationwide, supports data collection and analysis.
- Focus on PM2.5 Monitoring: There is a heightened focus on PM2.5 monitoring as a critical pollutant. In 2022, Beijing reported PM2.5 levels averaging 33 µg/m³, driving demand for advanced monitoring technologies.
Investment Opportunities in the China Smart City AQ Network Market
Some of the investment opportunities in the China Smart City AQ Network Market are mentioned below.
- Partnerships with Environmental Agencies: Now is an ideal time for partnerships with environmental agencies to improve data sharing. Collaborating with local governments can facilitate the deployment of effective monitoring systems, especially in urban areas.
- Investment in Smart City Initiatives: The current emphasis on smart city initiatives presents an opportunity for investment in air quality technologies. Urban areas with populations over 1 million are prioritised for monitoring, creating demand for effective solutions.
- Supply of Mobile AQ Sensors: There is a growing need for mobile AQ sensors in urban environments. City governments are increasingly seeking flexible solutions to monitor air quality dynamically, particularly in densely populated areas.
- Development of Real-Time Dashboards: The demand for real-time dashboards is increasing as cities aim for transparency in air quality data. This trend supports investment in user-friendly platforms that can display live air quality information.
Government Initiatives in the China Smart City AQ Network Market
The Environmental Protection Law mandates air quality monitoring in urban areas, adding to previous regulations. This law ensures that city governments are accountable for maintaining air quality standards, requiring regular reporting and compliance checks. The Ministry of Ecology and Environment oversees air quality monitoring standards, ensuring that all monitoring systems meet national requirements. This framework supports the implementation of Smart City AQ Networks across China, improving the overall effectiveness of air quality management. In 2025, the National Development and Reform Commission aims to invest USD 1 billion in urban infrastructure projects, including air quality monitoring systems.
The National Development and Reform Commission supports smart city initiatives with an investment target of USD 1 billion by 2025. This agency funds various projects aimed at improving urban infrastructure, including air quality monitoring systems. The Ministry of Ecology and Environment plays a critical role in approving air quality monitoring technologies, ensuring they comply with national standards. This collaboration encourages innovation and facilitates the adoption of advanced monitoring solutions in cities.
Future Insight of the China Smart City AQ Network Market
By 2032, buyers and suppliers in the China Smart City AQ Network market can anticipate a shift towards enhanced AI technologies that will improve data accuracy and response times. The National Development and Reform Commission will likely increase funding for urban air quality initiatives, enabling the rollout of advanced monitoring systems across more cities. With over 1,500 stations in the National Air Quality Monitoring Network, data accessibility will improve significantly, allowing for better public health assessments. The ongoing emphasis on smart city development in the 14th Five-Year Plan will drive innovation and investment in air quality solutions.
Market Segmentation Analysis
The analysis below covers each segmentation, its leading category in 2025 and its fastest-growing category through 2032.
By Network Type – Fixed Monitoring Units Dominated, Mobile AQ Sensors Expected to Grow Fastest
According to Dhaval Chaurasia, Assistant Manager at 6Wresearch, Fixed Monitoring Units took a 48% share of network type in 2025, more than any other category. Fixed Monitoring Units dominate the market share due to their extensive use across over 100 cities for stationary air quality monitoring. Their reliability is vital for urban assessments, particularly in cities like Shanghai, where more than 500 units are actively deployed. Mobile AQ Sensors are set to record the highest CAGR in this split, 9.5% over 2026–2032. Mobile AQ Sensors are experiencing rapid growth as cities seek adaptable monitoring solutions to respond to fluctuating pollution levels. Their capability to deliver real-time data from various locations is crucial for comprehensive air quality management. Suppliers need to focus on enhancing mobile sensor capabilities to meet the rising demand in urban settings.
By Monitored Parameters – PM2.5 Dominated, CO₂ Expected to Grow Fastest
With a 44% revenue share in 2025, PM2.5 was the largest monitored parameters category. PM2.5 dominates the market share as it is a critical pollutant linked to public health, with cities like Beijing reporting average levels of 33 µg/m³. Its importance is reinforced by national monitoring standards that prioritise its assessment. The quickest growth will come from CO₂, forecast to expand at a CAGR of 8.7% between 2026 and 2032. CO₂ is the fastest-growing monitored parameter, spurred by heightened awareness of greenhouse gas emissions and their climate impact. The focus on sustainability is driving agencies to incorporate CO₂ monitoring into their air quality frameworks. Buyers must ensure their solutions cover both PM2.5 and CO₂ monitoring to comply with regulatory standards and support public health initiatives.
By Sensor Deployment Location – Poles Dominated, Buildings Expected to Grow Fastest
Poles held a 38% share of the China Smart City AQ Network Market by sensor deployment location in 2025. Poles serve as the primary deployment location for fixed sensors, offering a stable and accessible platform for air quality monitoring in urban environments. Their widespread application ensures reliable data collection in densely populated areas. Over 2026–2032, Buildings are expected to post the fastest growth, at a CAGR of 9.8%. Buildings are quickly becoming the fastest-growing deployment location as urban planners integrate air quality monitoring into new constructions. This shift reflects a proactive stance towards environmental management in urban development. Suppliers should engage with construction companies to incorporate monitoring solutions into upcoming building projects.
By End User – City Governments Dominated, Environmental Agencies Expected to Grow Fastest
The largest end user category in 2025 was City Governments, with a 39% share of total revenue. City Governments account for the largest share of end users, as they are primarily responsible for air quality management and public health initiatives. Their commitment to implementing Smart City AQ Networks drives the demand for reliable monitoring solutions. Environmental Agencies are projected to grow fastest, at a CAGR of 9.6% during 2026–2032. Environmental Agencies are the fastest-growing end users, as regulatory bodies heighten their focus on air quality compliance and monitoring. Their expanding role in overseeing urban air quality is vital for maintaining public health standards. Suppliers should tailor their products to meet the specific needs of environmental agencies, ensuring alignment with evolving regulations.
Key Attractiveness of the Report
- 10 Years of Market Numbers
- Historical Data Starting from 2022 to 2025
- Base Year 2025
- Forecast Data until 2032
- Key Performance Indicators Impacting the Market
- Major Upcoming Developments and Projects
Key Highlights of the Report:
- China Smart City AQ Network Market Outlook
- Market Size of China Smart City AQ Network Market, 2025
- Forecast of China Smart City AQ Network Market, 2032
- Historical Data and Forecast of China Smart City AQ Network Revenues & Volume for the Period 2022 - 2032F
- China Smart City AQ Network Market Trend Evolution
- China Smart City AQ Network Market Drivers and Challenges
- China Smart City AQ Network Price Trends
- China Smart City AQ Network Porter's Five Forces
- China Smart City AQ Network Industry Life Cycle
- Historical Data and Forecast of China Smart City AQ Network Market Revenues & Volume By Network Type for the Period 2022 - 2032F
- Historical Data and Forecast of China Smart City AQ Network Market Revenues & Volume By Fixed Monitoring Units for the Period 2022 - 2032F
- Historical Data and Forecast of China Smart City AQ Network Market Revenues & Volume By Mobile AQ Sensors for the Period 2022 - 2032F
- Historical Data and Forecast of China Smart City AQ Network Market Revenues & Volume By Satellite-Linked AQ for the Period 2022 - 2032F
- Historical Data and Forecast of China Smart City AQ Network Market Revenues & Volume By Real-Time Dashboards for the Period 2022 - 2032F
- Historical Data and Forecast of China Smart City AQ Network Market Revenues & Volume By Monitored Parameters for the Period 2022 - 2032F
- Historical Data and Forecast of China Smart City AQ Network Market Revenues & Volume By PM2.5, CO , NOx for the Period 2022 - 2032F
- Historical Data and Forecast of China Smart City AQ Network Market Revenues & Volume By Mounted on Vehicles for the Period 2022 - 2032F
- Historical Data and Forecast of China Smart City AQ Network Market Revenues & Volume By Macro Data Collection for the Period 2022 - 2032F
- Historical Data and Forecast of China Smart City AQ Network Market Revenues & Volume By Cloud-Based Alerts for the Period 2022 - 2032F
- Historical Data and Forecast of China Smart City AQ Network Market Revenues & Volume By Sensor Deployment Location for the Period 2022 - 2032F
- Historical Data and Forecast of China Smart City AQ Network Market Revenues & Volume By Poles, Buildings for the Period 2022 - 2032F
- Historical Data and Forecast of China Smart City AQ Network Market Revenues & Volume By Buses, Taxis, Drones for the Period 2022 - 2032F
- Historical Data and Forecast of China Smart City AQ Network Market Revenues & Volume By Entire Urban Zones for the Period 2022 - 2032F
- Historical Data and Forecast of China Smart City AQ Network Market Revenues & Volume By City Control Rooms for the Period 2022 - 2032F
- Historical Data and Forecast of China Smart City AQ Network Market Revenues & Volume By End User for the Period 2022 - 2032F
- Historical Data and Forecast of China Smart City AQ Network Market Revenues & Volume By City Governments for the Period 2022 - 2032F
- Historical Data and Forecast of China Smart City AQ Network Market Revenues & Volume By Environmental Agencies for the Period 2022 - 2032F
- Historical Data and Forecast of China Smart City AQ Network Market Revenues & Volume By Research Institutions for the Period 2022 - 2032F
- Historical Data and Forecast of China Smart City AQ Network Market Revenues & Volume By Smart City Operators for the Period 2022 - 2032F
- China Smart City AQ Network Import Export Trade Statistics
- Market Opportunity Assessment By Network Type
- Market Opportunity Assessment By Monitored Parameters
- Market Opportunity Assessment By Sensor Deployment Location
- Market Opportunity Assessment By End User
- China Smart City AQ Network Top Companies Market Share
- China Smart City AQ Network Competitive Benchmarking By Technical and Operational Parameters
- China Smart City AQ Network Company Profiles
- China Smart City AQ Network Key Strategic Recommendations
Market Covered
Segments analysed in this report are listed below.
By Network Type
- Fixed Monitoring Units
- Mobile AQ Sensors
- Satellite-Linked AQ
- Real-Time Dashboards
By Monitored Parameters
- PM2.5
- CO₂
- NOx
- Mounted on Vehicles
- Macro Data Collection
- Cloud-Based Alerts
By Sensor Deployment Location
- Poles
- Buildings
- Buses
- Taxis
- Drones
- Entire Urban Zones
- City Control Rooms
By End User
- City Governments
- Environmental Agencies
- Research Institutions
- Smart City Operators































