Croatia Allopurinol Market (2026-2032) | Industry, Value, Size & Revenue, Outlook, Growth, Share, Segmentation, Trends, Competitive Landscape, Analysis, Companies, Forecast
Market Forecast By Drug Class (Antigout Agents, Antihyperuricemic Agents), By Application (Gout, Kidney Stones, Others, Demographic, Adult, Pediatric), By Dosage Form (Intravenous Powder for Injection, Oral Tablet), By End-Users (Clinic, Hospital, Others), By Distribution Channel (Hospital Pharmacy, Retail Pharmacy, Online Pharmacy) And Competitive Landscape
| Product Code: ETC6844383 | Publication Date: Sep 2024 | Updated Date: Apr 2026 | Product Type: Market Research Report | |
| Publisher: 6Wresearch | Author: Sumit Sagar | No. of Pages: 75 | No. of Figures: 35 | No. of Tables: 20 |
Croatia Allopurinol Market Size (2020-2030)
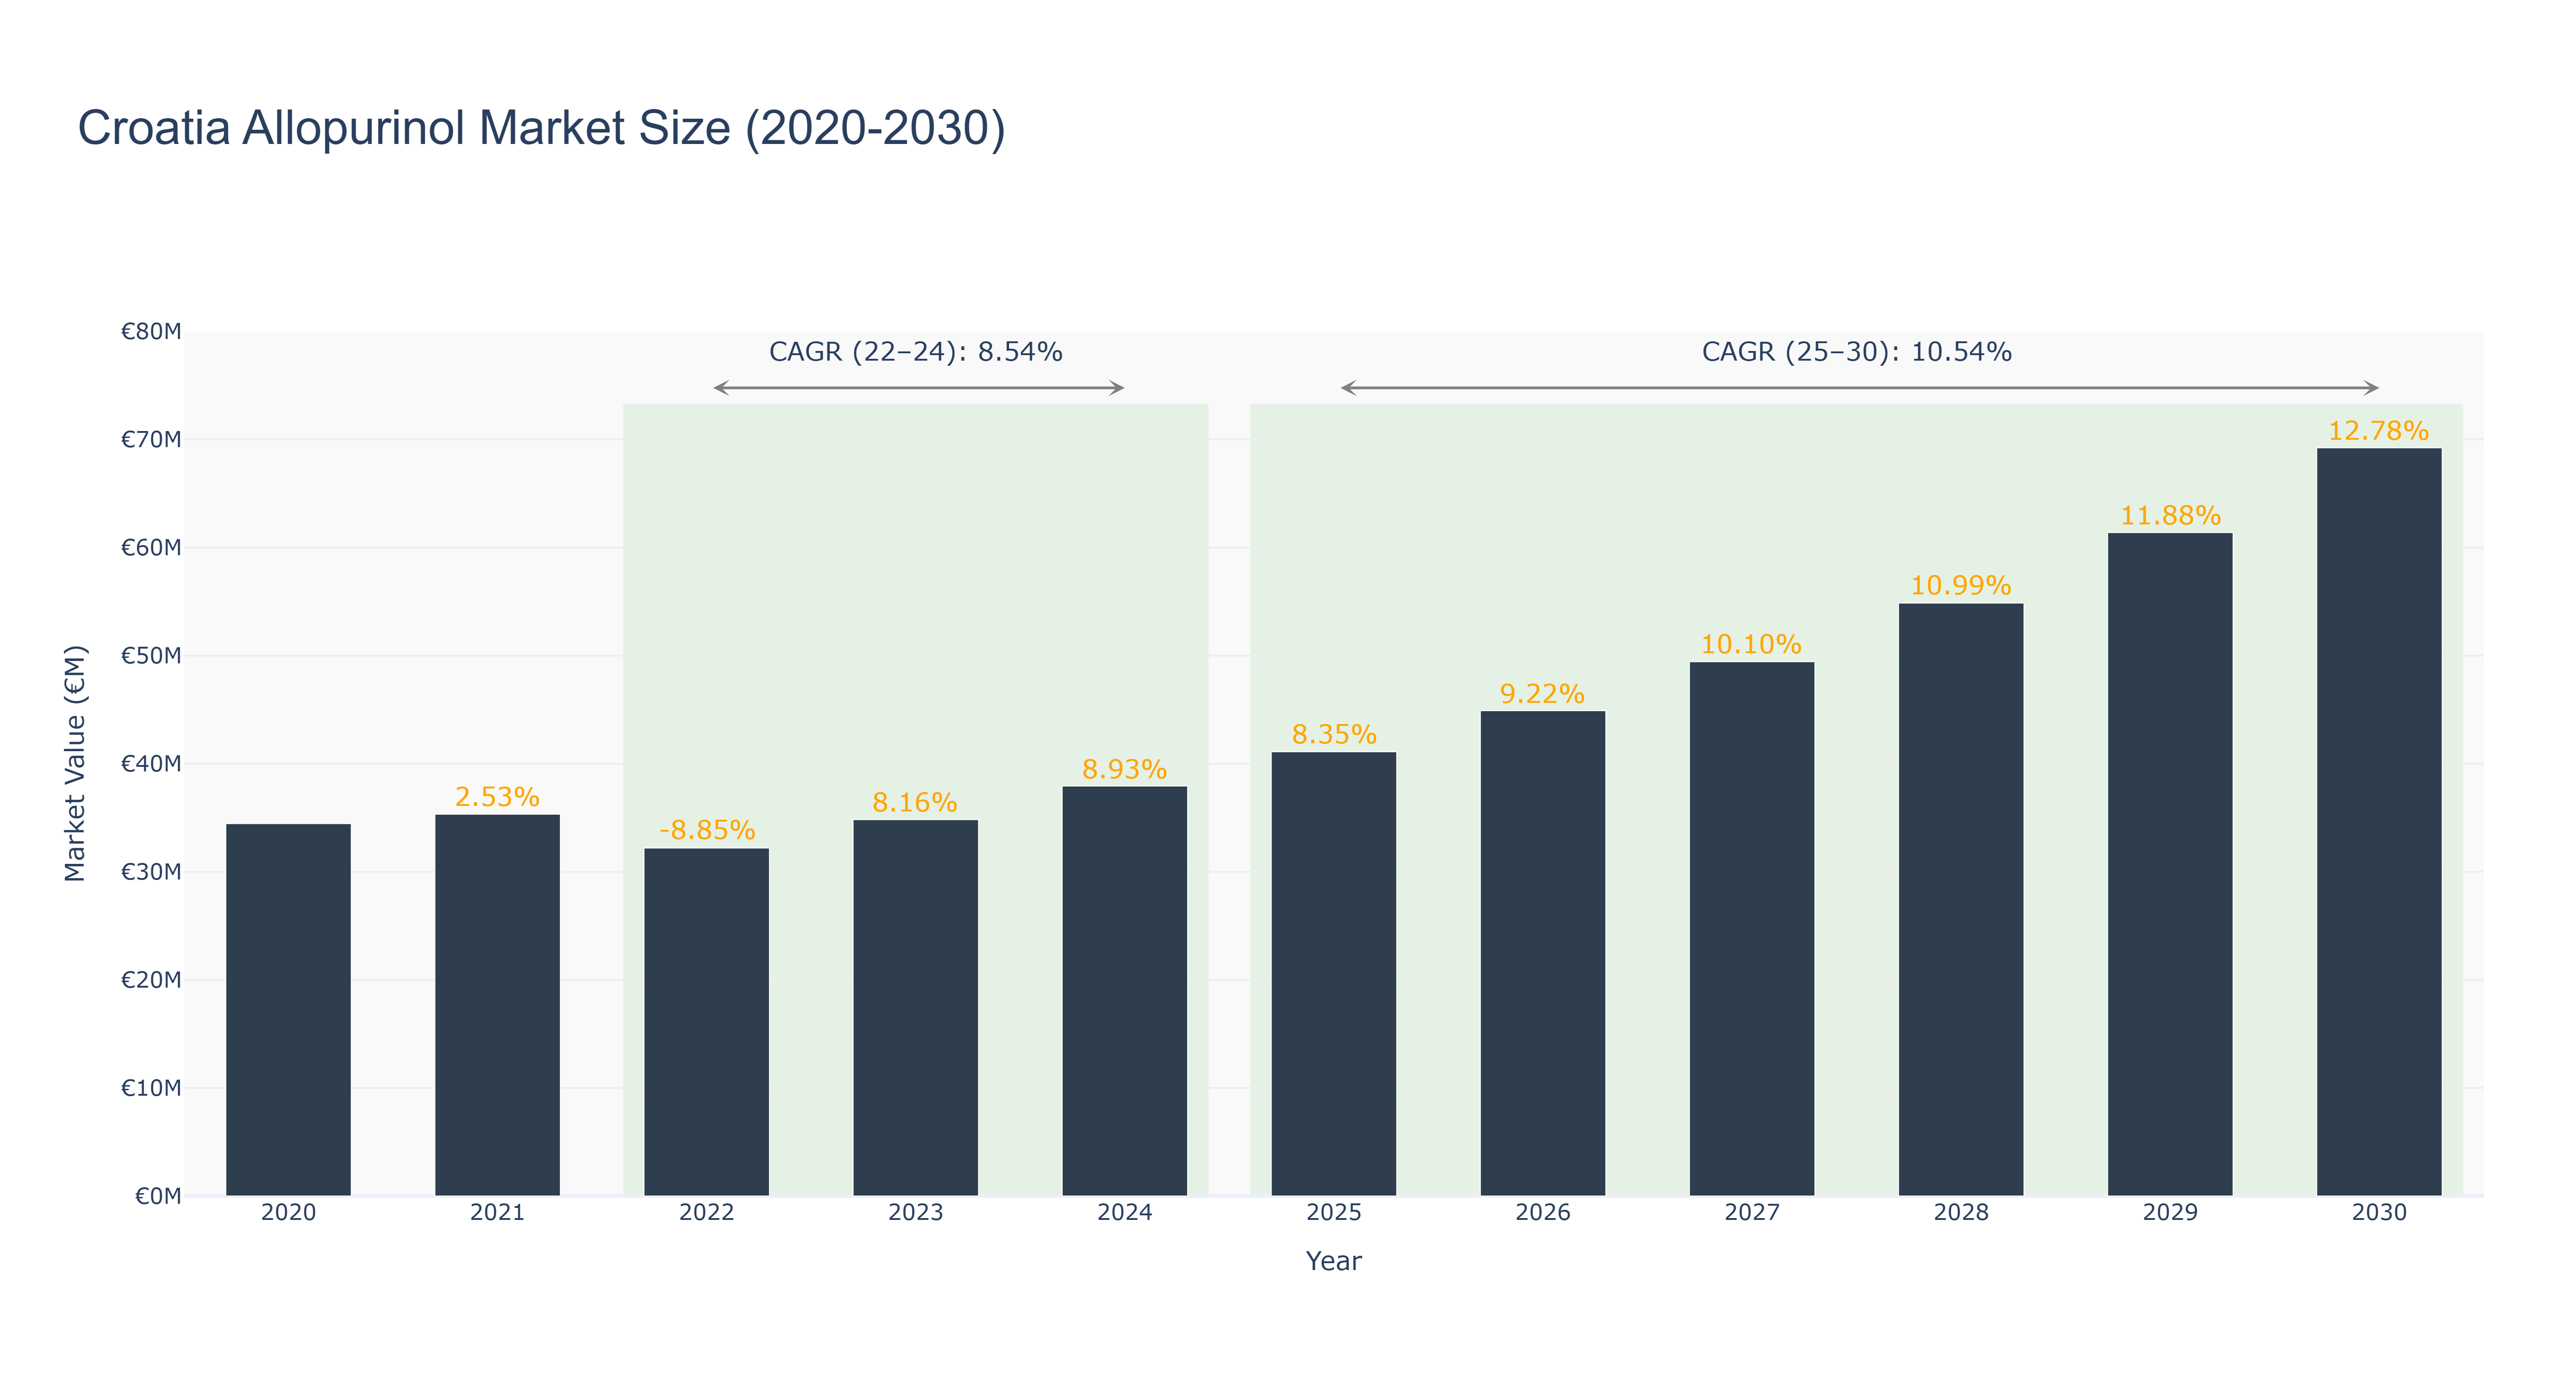
The Croatia Allopurinol Market has shown a steady growth trajectory over the years. The market size peaked at €69.23 million in 2030, with a notable increase in growth rate from 2025 to 2030 at 10.54%. The actual market size from 2020 to 2024 saw fluctuations, with a dip in 2022 at €32.20 million followed by a significant rise in 2025 to €41.11 million. The market rebounded strongly with a CAGR of 8.54% from 2022 to 2024, attributed to increased demand and improved healthcare infrastructure. The forecasted growth from 2025 to 2030 is driven by rising prevalence of gout and increased awareness about Allopurinol's efficacy. Looking ahead, Croatia is set to implement new regulations promoting generic Allopurinol production, fostering market competitiveness and driving further growth.
Croatia Allopurinol Market: Production & Trade Performance (2019-2025)
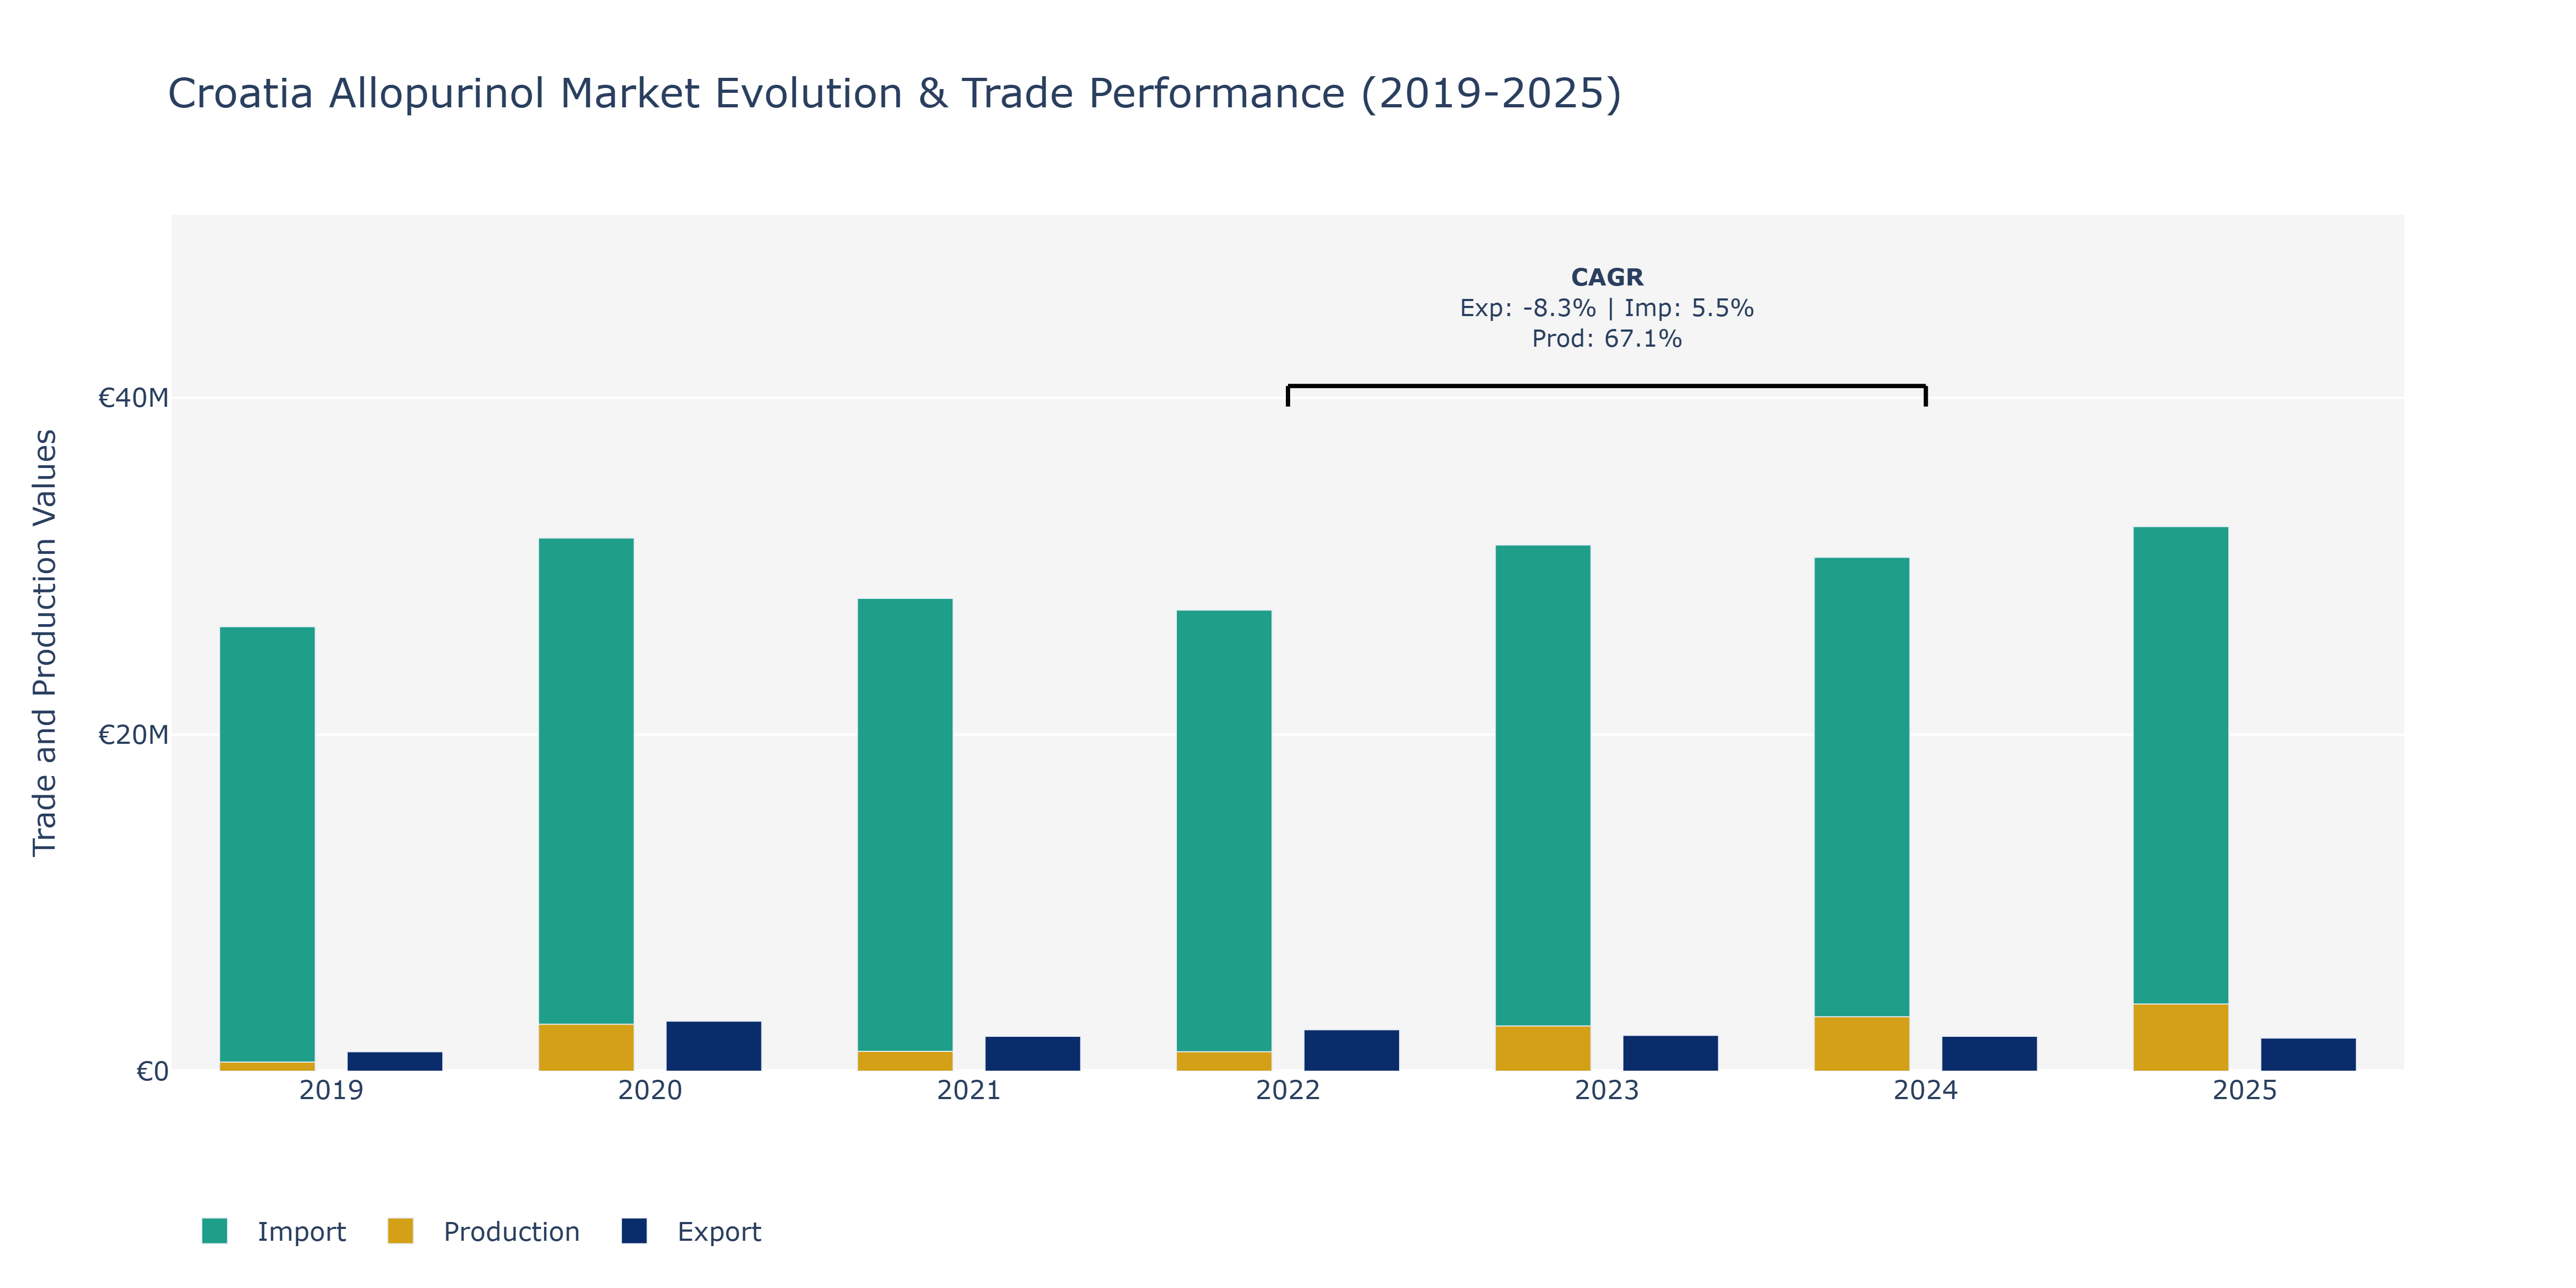
The Croatia Allopurinol Market saw notable dynamics in Exports, Imports, and Production from 2019 to 2025. Exports experienced fluctuations, with a peak in 2020 at €2.97 million and a gradual decline thereafter, reaching €1.97 million in 2025. Imports showcased a steady increase over the same period, with 2025 recording the highest value at over €32.36 million. Production, on the other hand, exhibited remarkable growth, more than doubling from €544.94 million in 2019 to €3.99 million in 2025. The surge in production can be attributed to increased demand for allopurinol globally, driven by the rising prevalence of gout and other conditions. Imports growth reflects Croatia's reliance on imported raw materials for manufacturing allopurinol, while the fluctuating exports may be influenced by global market conditions and competition. The market's production CAGR of 67.12% from 2022 to 2024 underscores the rapid expansion of local manufacturing capabilities, potentially fueled by investments in technology and infrastructure to meet growing demand.
Key Highlights of the Report:
- Croatia Allopurinol Market Outlook
- Market Size of Croatia Allopurinol Market, 2025
- Forecast of Croatia Allopurinol Market, 2032
- Historical Data and Forecast of Croatia Allopurinol Revenues & Volume for the Period 2022 - 2032
- Croatia Allopurinol Market Trend Evolution
- Croatia Allopurinol Market Drivers and Challenges
- Croatia Allopurinol Price Trends
- Croatia Allopurinol Porter's Five Forces
- Croatia Allopurinol Industry Life Cycle
- Historical Data and Forecast of Croatia Allopurinol Market Revenues & Volume By Drug Class for the Period 2022 - 2032
- Historical Data and Forecast of Croatia Allopurinol Market Revenues & Volume By Antigout Agents for the Period 2022 - 2032
- Historical Data and Forecast of Croatia Allopurinol Market Revenues & Volume By Antihyperuricemic Agents for the Period 2022 - 2032
- Historical Data and Forecast of Croatia Allopurinol Market Revenues & Volume By Application for the Period 2022 - 2032
- Historical Data and Forecast of Croatia Allopurinol Market Revenues & Volume By Gout for the Period 2022 - 2032
- Historical Data and Forecast of Croatia Allopurinol Market Revenues & Volume By Kidney Stones for the Period 2022 - 2032
- Historical Data and Forecast of Croatia Allopurinol Market Revenues & Volume By Others for the Period 2022 - 2032
- Historical Data and Forecast of Croatia Allopurinol Market Revenues & Volume By Demographic for the Period 2022 - 2032
- Historical Data and Forecast of Croatia Allopurinol Market Revenues & Volume By Adult for the Period 2022 - 2032
- Historical Data and Forecast of Croatia Allopurinol Market Revenues & Volume By Pediatric for the Period 2022 - 2032
- Historical Data and Forecast of Croatia Allopurinol Market Revenues & Volume By Dosage Form for the Period 2022 - 2032
- Historical Data and Forecast of Croatia Allopurinol Market Revenues & Volume By Intravenous Powder for Injection for the Period 2022 - 2032
- Historical Data and Forecast of Croatia Allopurinol Market Revenues & Volume By Oral Tablet for the Period 2022 - 2032
- Historical Data and Forecast of Croatia Allopurinol Market Revenues & Volume By End-Users for the Period 2022 - 2032
- Historical Data and Forecast of Croatia Allopurinol Market Revenues & Volume By Clinic for the Period 2022 - 2032
- Historical Data and Forecast of Croatia Allopurinol Market Revenues & Volume By Hospital for the Period 2022 - 2032
- Historical Data and Forecast of Croatia Allopurinol Market Revenues & Volume By Others for the Period 2022 - 2032
- Historical Data and Forecast of Croatia Allopurinol Market Revenues & Volume By Distribution Channel for the Period 2022 - 2032
- Historical Data and Forecast of Croatia Allopurinol Market Revenues & Volume By Hospital Pharmacy for the Period 2022 - 2032
- Historical Data and Forecast of Croatia Allopurinol Market Revenues & Volume By Retail Pharmacy for the Period 2022 - 2032
- Historical Data and Forecast of Croatia Allopurinol Market Revenues & Volume By Online Pharmacy for the Period 2022 - 2032
- Croatia Allopurinol Import Export Trade Statistics
- Market Opportunity Assessment By Drug Class
- Market Opportunity Assessment By Application
- Market Opportunity Assessment By Dosage Form
- Market Opportunity Assessment By End-Users
- Market Opportunity Assessment By Distribution Channel
- Croatia Allopurinol Top Companies Market Share
- Croatia Allopurinol Competitive Benchmarking By Technical and Operational Parameters
- Croatia Allopurinol Company Profiles
- Croatia Allopurinol Key Strategic Recommendations
Frequently Asked Questions About the Market Study (FAQs):
6Wresearch actively monitors the Croatia Allopurinol Market and publishes its comprehensive annual report, highlighting emerging trends, growth drivers, revenue analysis, and forecast outlook. Our insights help businesses to make data-backed strategic decisions with ongoing market dynamics. Our analysts track relevent industries related to the Croatia Allopurinol Market, allowing our clients with actionable intelligence and reliable forecasts tailored to emerging regional needs.
Yes, we provide customisation as per your requirements. To learn more, feel free to contact us on sales@6wresearch.com
1 Executive Summary |
2 Introduction |
2.1 Key Highlights of the Report |
2.2 Report Description |
2.3 Market Scope & Segmentation |
2.4 Research Methodology |
2.5 Assumptions |
3 Croatia Allopurinol Market Overview |
3.1 Croatia Country Macro Economic Indicators |
3.2 Croatia Allopurinol Market Revenues & Volume, 2022 & 2032F |
3.3 Croatia Allopurinol Market - Industry Life Cycle |
3.4 Croatia Allopurinol Market - Porter's Five Forces |
3.5 Croatia Allopurinol Market Revenues & Volume Share, By Drug Class, 2022 & 2032F |
3.6 Croatia Allopurinol Market Revenues & Volume Share, By Application, 2022 & 2032F |
3.7 Croatia Allopurinol Market Revenues & Volume Share, By Dosage Form, 2022 & 2032F |
3.8 Croatia Allopurinol Market Revenues & Volume Share, By End-Users, 2022 & 2032F |
3.9 Croatia Allopurinol Market Revenues & Volume Share, By Distribution Channel, 2022 & 2032F |
4 Croatia Allopurinol Market Dynamics |
4.1 Impact Analysis |
4.2 Market Drivers |
4.2.1 Increasing prevalence of gout and hyperuricemia in Croatia |
4.2.2 Growing awareness about the benefits of allopurinol in managing and preventing gout attacks |
4.2.3 Rising geriatric population in Croatia leading to higher demand for gout medications |
4.3 Market Restraints |
4.3.1 Stringent regulatory requirements for the approval and sale of pharmaceutical products in Croatia |
4.3.2 Availability of alternative treatments for gout and hyperuricemia |
4.3.3 Price competition from generic allopurinol manufacturers |
5 Croatia Allopurinol Market Trends |
6 Croatia Allopurinol Market, By Types |
6.1 Croatia Allopurinol Market, By Drug Class |
6.1.1 Overview and Analysis |
6.1.2 Croatia Allopurinol Market Revenues & Volume, By Drug Class, 2022 - 2032F |
6.1.3 Croatia Allopurinol Market Revenues & Volume, By Antigout Agents, 2022 - 2032F |
6.1.4 Croatia Allopurinol Market Revenues & Volume, By Antihyperuricemic Agents, 2022 - 2032F |
6.2 Croatia Allopurinol Market, By Application |
6.2.1 Overview and Analysis |
6.2.2 Croatia Allopurinol Market Revenues & Volume, By Gout, 2022 - 2032F |
6.2.3 Croatia Allopurinol Market Revenues & Volume, By Kidney Stones, 2022 - 2032F |
6.2.4 Croatia Allopurinol Market Revenues & Volume, By Others, 2022 - 2032F |
6.2.5 Croatia Allopurinol Market Revenues & Volume, By Demographic, 2022 - 2032F |
6.2.6 Croatia Allopurinol Market Revenues & Volume, By Adult, 2022 - 2032F |
6.2.7 Croatia Allopurinol Market Revenues & Volume, By Pediatric, 2022 - 2032F |
6.3 Croatia Allopurinol Market, By Dosage Form |
6.3.1 Overview and Analysis |
6.3.2 Croatia Allopurinol Market Revenues & Volume, By Intravenous Powder for Injection, 2022 - 2032F |
6.3.3 Croatia Allopurinol Market Revenues & Volume, By Oral Tablet, 2022 - 2032F |
6.4 Croatia Allopurinol Market, By End-Users |
6.4.1 Overview and Analysis |
6.4.2 Croatia Allopurinol Market Revenues & Volume, By Clinic, 2022 - 2032F |
6.4.3 Croatia Allopurinol Market Revenues & Volume, By Hospital, 2022 - 2032F |
6.4.4 Croatia Allopurinol Market Revenues & Volume, By Others, 2022 - 2032F |
6.5 Croatia Allopurinol Market, By Distribution Channel |
6.5.1 Overview and Analysis |
6.5.2 Croatia Allopurinol Market Revenues & Volume, By Hospital Pharmacy, 2022 - 2032F |
6.5.3 Croatia Allopurinol Market Revenues & Volume, By Retail Pharmacy, 2022 - 2032F |
6.5.4 Croatia Allopurinol Market Revenues & Volume, By Online Pharmacy, 2022 - 2032F |
7 Croatia Allopurinol Market Import-Export Trade Statistics |
7.1 Croatia Allopurinol Market Export to Major Countries |
7.2 Croatia Allopurinol Market Imports from Major Countries |
8 Croatia Allopurinol Market Key Performance Indicators |
8.1 Number of prescriptions for allopurinol filled by healthcare providers |
8.2 Patient adherence rates to allopurinol treatment regimens |
8.3 Number of healthcare providers recommending allopurinol as a first-line treatment option |
9 Croatia Allopurinol Market - Opportunity Assessment |
9.1 Croatia Allopurinol Market Opportunity Assessment, By Drug Class, 2022 & 2032F |
9.2 Croatia Allopurinol Market Opportunity Assessment, By Application, 2022 & 2032F |
9.3 Croatia Allopurinol Market Opportunity Assessment, By Dosage Form, 2022 & 2032F |
9.4 Croatia Allopurinol Market Opportunity Assessment, By End-Users, 2022 & 2032F |
9.5 Croatia Allopurinol Market Opportunity Assessment, By Distribution Channel, 2022 & 2032F |
10 Croatia Allopurinol Market - Competitive Landscape |
10.1 Croatia Allopurinol Market Revenue Share, By Companies, 2025 |
10.2 Croatia Allopurinol Market Competitive Benchmarking, By Operating and Technical Parameters |
11 Company Profiles |
12 Recommendations |
13 Disclaimer |
Global Go To Market Strategy - 2030
Export potential enables firms to identify high-growth global markets with greater confidence by combining advanced trade intelligence with a structured quantitative methodology. The framework analyzes emerging demand trends and country-level import patterns while integrating macroeconomic and trade datasets such as GDP and population forecasts, bilateral import–export flows, tariff structures, elasticity differentials between developed and developing economies, geographic distance, and import demand projections. Using weighted trade values from 2020–2024 as the base period to project country-to-country export potential for 2030, these inputs are operationalized through calculated drivers such as gravity model parameters, tariff impact factors, and projected GDP per-capita growth. Through an analysis of hidden potentials, demand hotspots, and market conditions that are most favorable to success, this method enables firms to focus on target countries, maximize returns, and global expansion with data, backed by accuracy.
By factoring in the projected importer demand gap that is currently unmet and could be potential opportunity, it identifies the potential for the Exporter (Country) among 190 countries, against the general trade analysis, which identifies the biggest importer or exporter.
To discover high-growth global markets and optimize your business strategy:
Click Here
Pricing
- Single User License$ 1,995
- Department License$ 2,400
- Site License$ 3,120
- Global License$ 3,795

Leadership Perspectives from Industry Events
Search
Thought Leadership and Analyst Meet


Our Clients
6WResearch In News
- India Export Attractiveness Tracker 2026
- India Air Conditioner Market Set for Strong Rebound in 2026 After Weather-Led Correction and GST-Driven Recovery: 6Wresearch
- ADAS in India: How Automatic Emergency Braking, Blind Spot Detection & Driver Monitoring are Transforming Road Safety
- Doha a strategic location for EV manufacturing hub: IPA Qatar
- Demand for luxury TVs surging in the GCC, says Samsung
- Empowering Growth: The Thriving Journey of Bangladesh’s Cable Industry
Latest Reports
- Nicaragua RPG Gaming Market (2026-2032)
- New Zealand RPG Gaming Market (2026-2032)
- Netherlands RPG Gaming Market (2026-2032)
- Nauru RPG Gaming Market (2026-2032)
- Namibia RPG Gaming Market (2026-2032)
- Mozambique RPG Gaming Market (2026-2032)
- Montenegro RPG Gaming Market (2026-2032)
- Mongolia RPG Gaming Market (2026-2032)
- Monaco RPG Gaming Market (2026-2032)
- Micronesia RPG Gaming Market (2026-2032)
Industry Events and Analyst Meet

EV India Expo 2026

HIMTEX 2026

India Refining Summit 2026

India EV Show 2026

EV tech India Expo 2026
Whitepaper
- Middle East & Africa Commercial Security Market Click here to view more.
- Middle East & Africa Fire Safety Systems & Equipment Market Click here to view more.
- GCC Drone Market Click here to view more.
- Middle East Lighting Fixture Market Click here to view more.
- GCC Physical & Perimeter Security Market Click here to view more.