Croatia Ammonia Water Market (2026-2032) | Pricing Analysis, Outlook, Drivers, Opportunities, Industry, Value, Analysis, Segmentation, Challenges, Segments, Revenue, Strategic Insights, Companies, Growth, Strategy, Demand, Supply, Size, Consumer Insights, Competitive, Forecast, Investment Trends, Share, Restraints, Trends, Competition
Market Forecast By Concentration Type (Low-Concentration Ammonia, High-Concentration Ammonia, Ammonium Hydroxide, Ammonia Solution), By Application (Water Treatment, Industrial Use, Fertilizers & Agrochemicals, Refrigeration & Cooling), By End-Use (Municipal Utilities, Chemical Manufacturing, Agriculture Industry, Food Processing) And Competitive Landscape
| Product Code: ETC11913365 | Publication Date: Apr 2025 | Updated Date: Apr 2026 | Product Type: Market Research Report | |
| Publisher: 6Wresearch | Author: Sachin Kumar Rai | No. of Pages: 65 | No. of Figures: 34 | No. of Tables: 19 |
Croatia Ammonia Water Market Size (2020-2030)
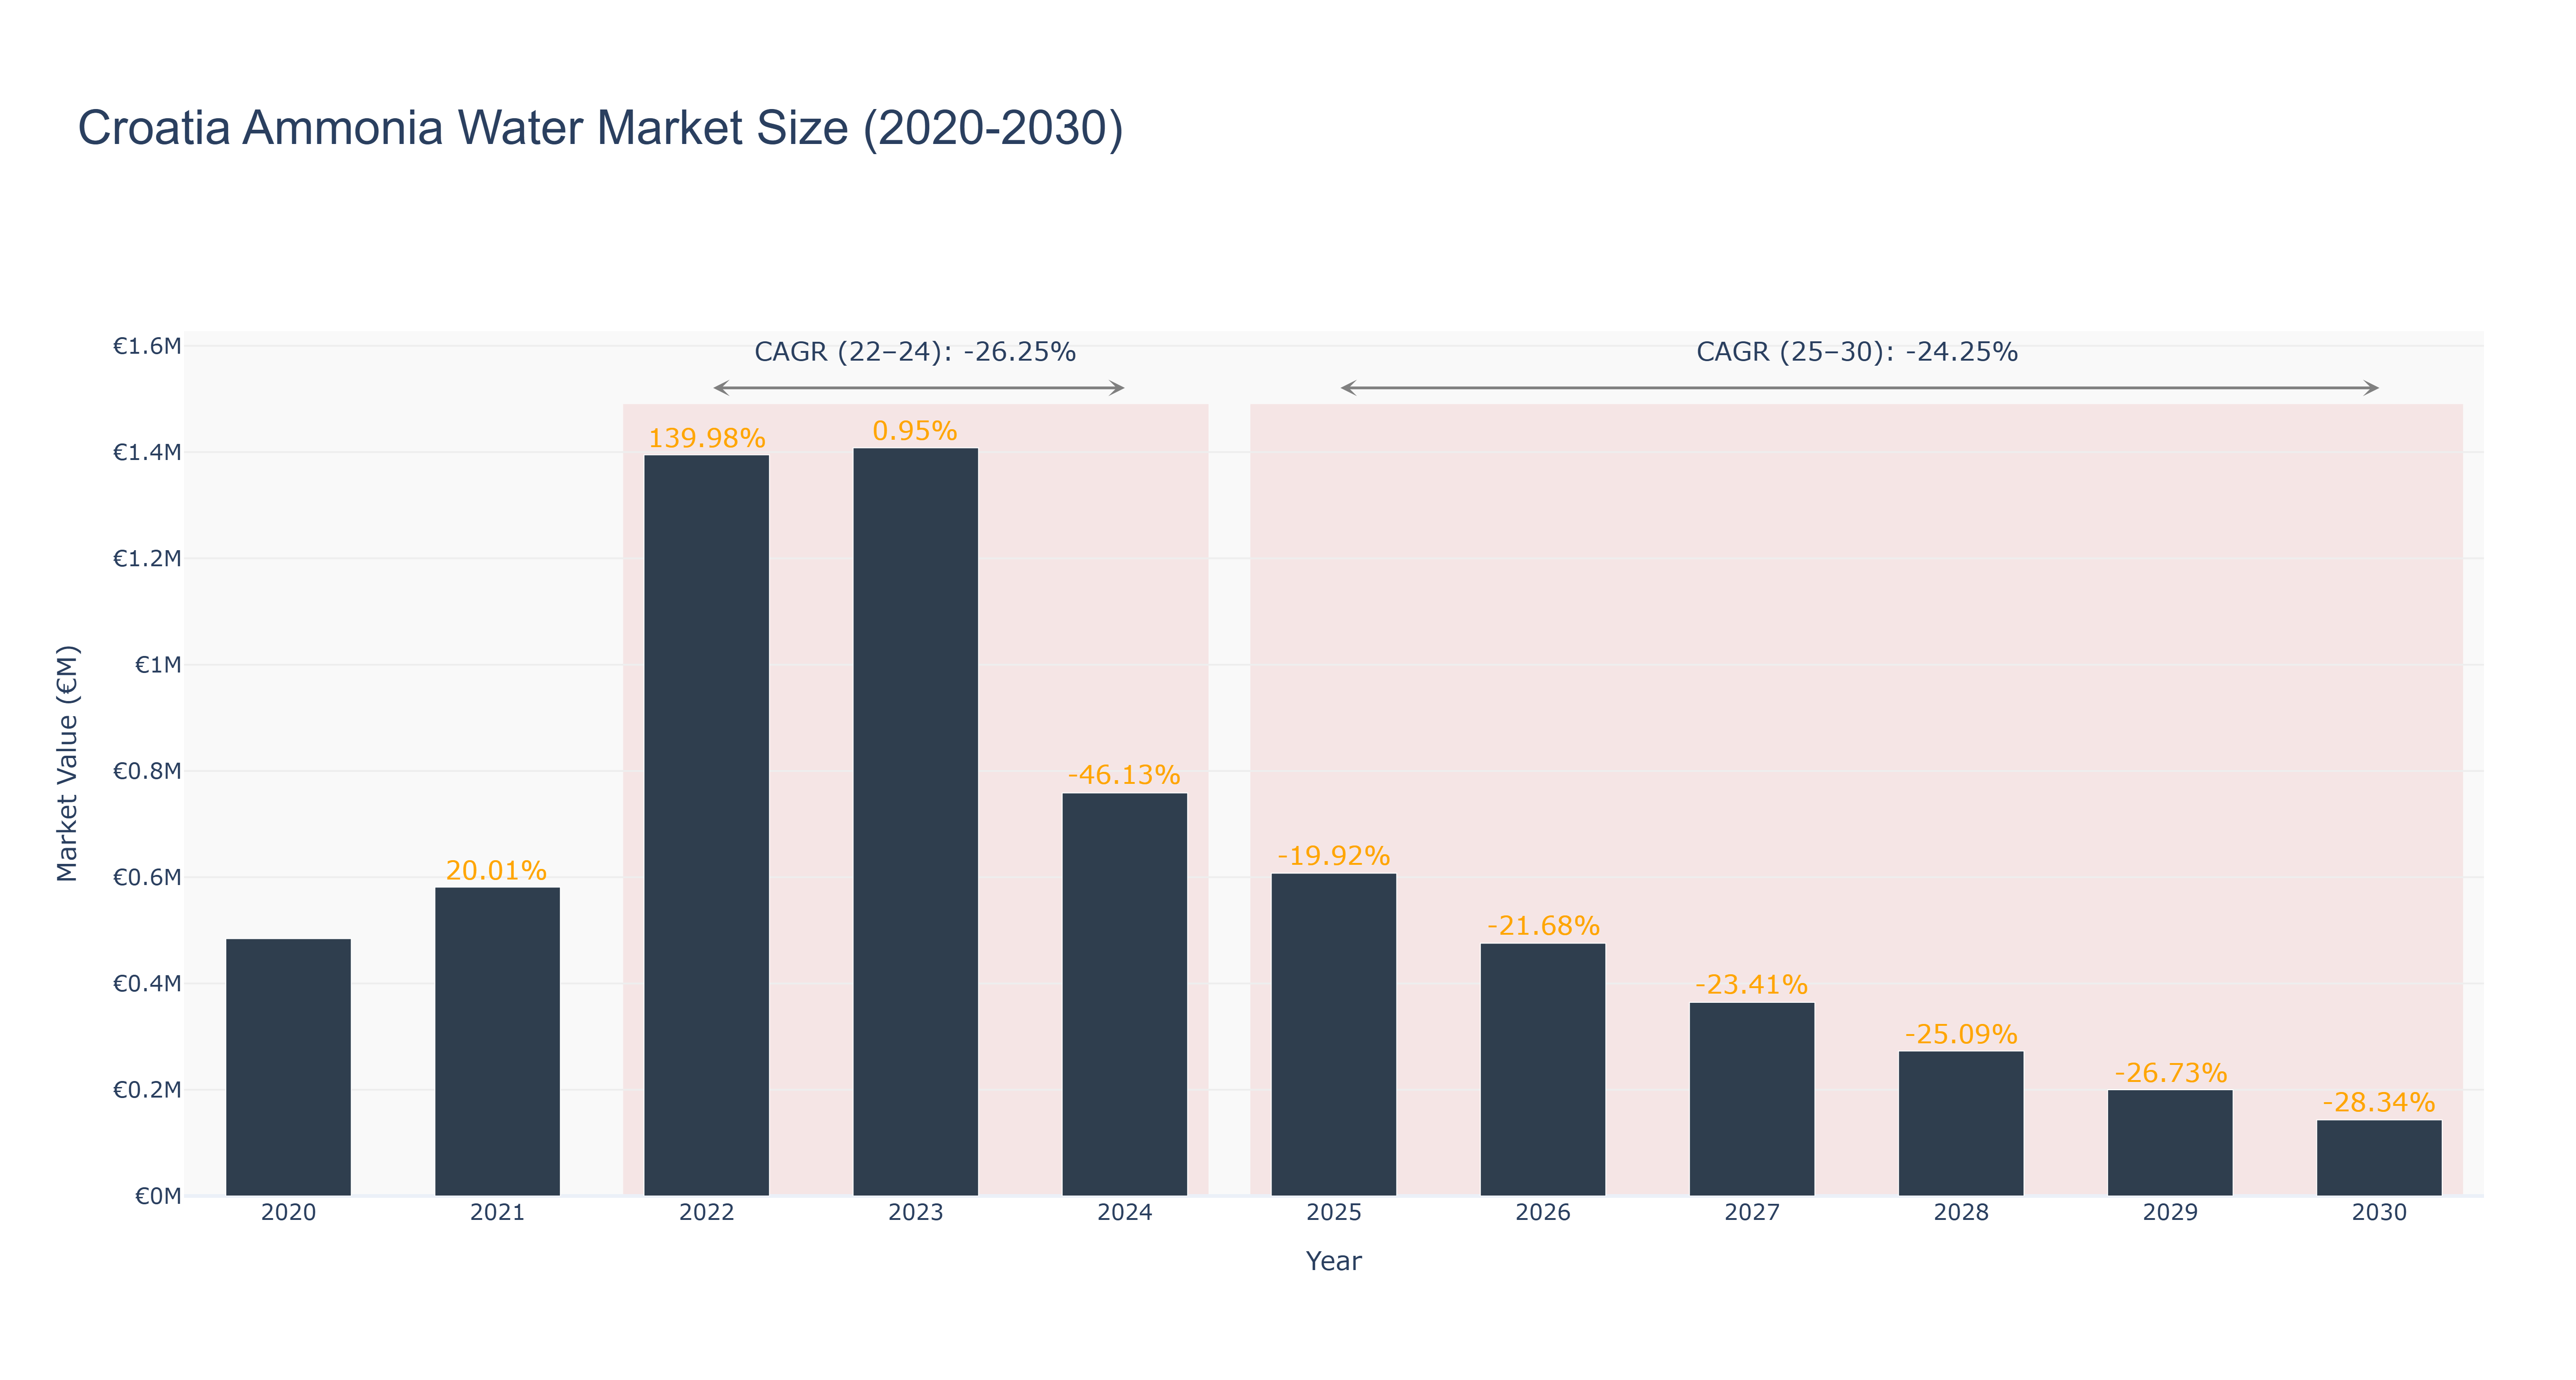
Croatia's Ammonia Water Market experienced a peak market size of €1.41 million in 2023, followed by a decline to €0.14 million in 2030. The actual market size decreased from €0.48 million in 2020 to €0.76 million in 2024, mainly due to a significant negative growth rate of -46.13%. The forecasted market size is expected to continue its downward trend with a CAGR of -24.25% from 2025 to 2030. The market faced challenges due to reduced industrial demand and increasing environmental regulations leading to a shift towards eco-friendly alternatives. Looking ahead, Croatia is investing in sustainable production methods and exploring new applications for ammonia water in agriculture to revitalize the market. Industry drivers for the market include the need for environmentally friendly solutions and the growing focus on sustainable practices in various sectors. Recent developments in Croatia's agricultural sector, such as initiatives to improve water quality and increase crop yields, are expected to drive demand for ammonia water in the coming years.
Croatia Ammonia Water Market: Production & Trade Performance (2019-2025)
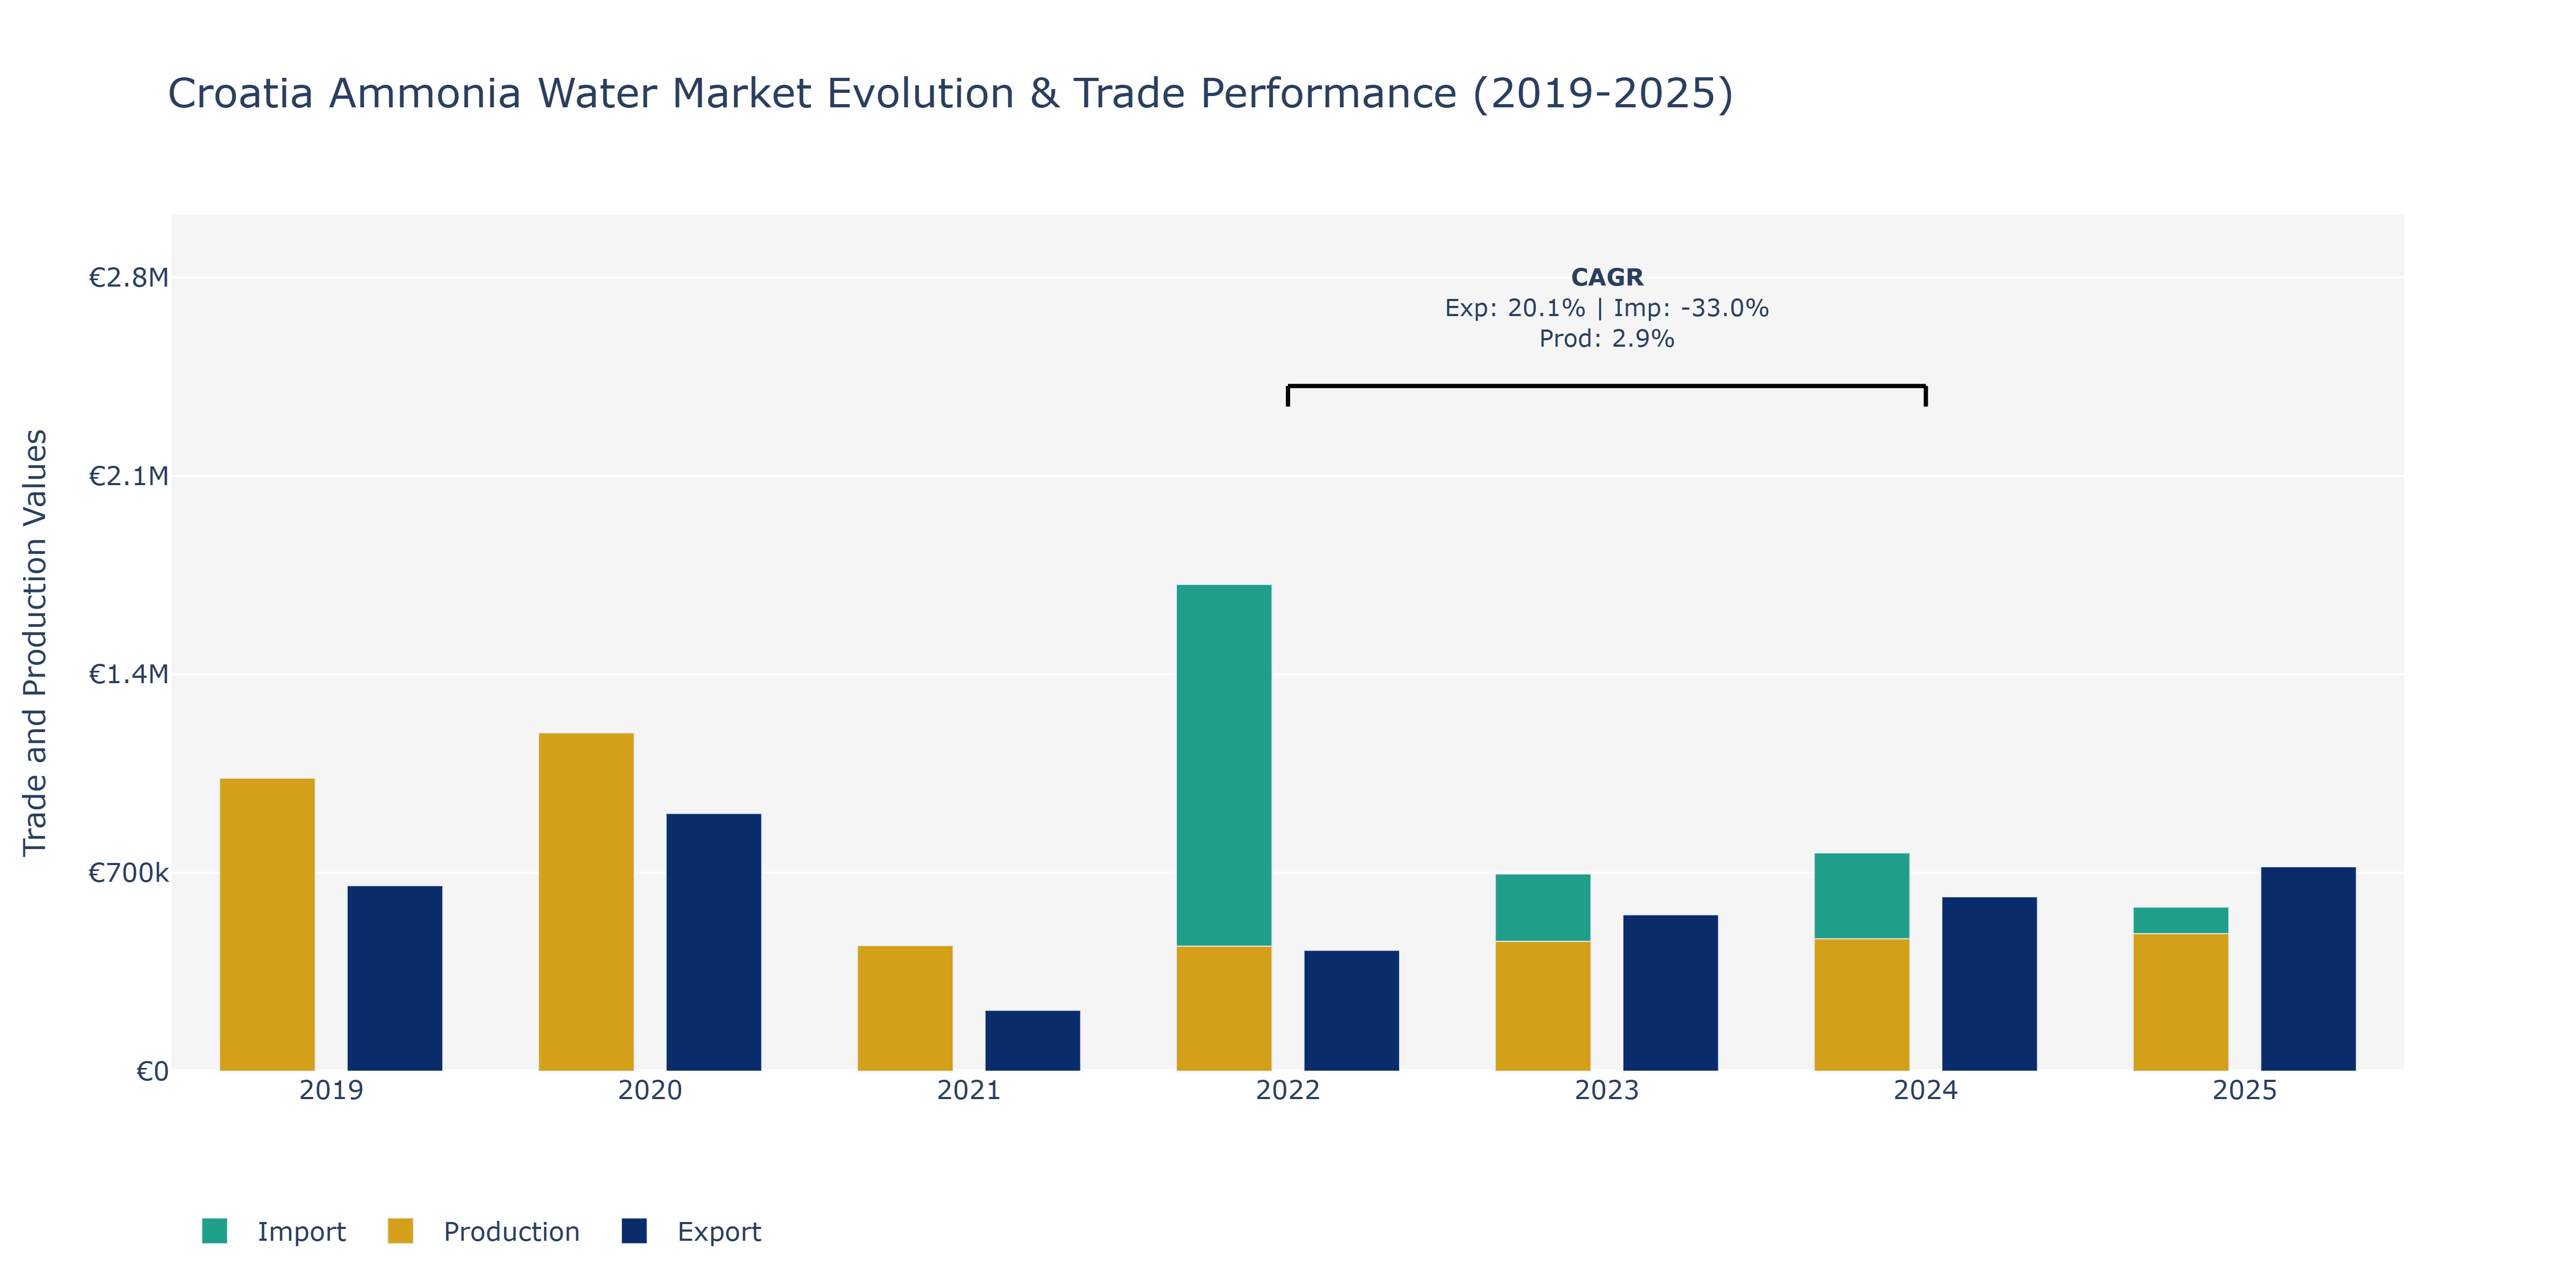
The Croatia Ammonia Water Market exhibited notable fluctuations in Exports, Imports, and Production from 2019 to 2025. Exports saw a consistent upward trend, increasing from €654.63 thousand in 2019 to €721.44 thousand in 2025, marking a peak in that year. Conversely, Imports experienced fluctuations, with a significant peak in 2022 at €1.72 million, followed by a gradual decline to €579.03 thousand in 2025. Production remained relatively stable, with a minor increase from €1.03 billion in 2019 to €1.19 billion in 2020 and a peak of €485.24 thousand in 2025. The surge in Exports can be attributed to growing international demand for ammonia water products from Croatia, potentially due to quality enhancements or increased marketing efforts by local manufacturers. The fluctuating Imports could be influenced by global market dynamics, such as changes in supply chain disruptions or shifts in trade agreements impacting import volumes. The slight production increase may indicate improved domestic manufacturing capabilities or operational efficiencies within the sector. Further research into trade policies and market dynamics would provide deeper insights into these trends.
Key Highlights of the Report:
- Croatia Ammonia Water Market Outlook
- Market Size of Croatia Ammonia Water Market, 2025
- Forecast of Croatia Ammonia Water Market, 2032
- Historical Data and Forecast of Croatia Ammonia Water Revenues & Volume for the Period 2022 - 2032F
- Croatia Ammonia Water Market Trend Evolution
- Croatia Ammonia Water Market Drivers and Challenges
- Croatia Ammonia Water Price Trends
- Croatia Ammonia Water Porter's Five Forces
- Croatia Ammonia Water Industry Life Cycle
- Historical Data and Forecast of Croatia Ammonia Water Market Revenues & Volume By Concentration Type for the Period 2022 - 2032F
- Historical Data and Forecast of Croatia Ammonia Water Market Revenues & Volume By Low-Concentration Ammonia for the Period 2022 - 2032F
- Historical Data and Forecast of Croatia Ammonia Water Market Revenues & Volume By High-Concentration Ammonia for the Period 2022 - 2032F
- Historical Data and Forecast of Croatia Ammonia Water Market Revenues & Volume By Ammonium Hydroxide for the Period 2022 - 2032F
- Historical Data and Forecast of Croatia Ammonia Water Market Revenues & Volume By Ammonia Solution for the Period 2022 - 2032F
- Historical Data and Forecast of Croatia Ammonia Water Market Revenues & Volume By Application for the Period 2022 - 2032F
- Historical Data and Forecast of Croatia Ammonia Water Market Revenues & Volume By Water Treatment for the Period 2022 - 2032F
- Historical Data and Forecast of Croatia Ammonia Water Market Revenues & Volume By Industrial Use for the Period 2022 - 2032F
- Historical Data and Forecast of Croatia Ammonia Water Market Revenues & Volume By Fertilizers & Agrochemicals for the Period 2022 - 2032F
- Historical Data and Forecast of Croatia Ammonia Water Market Revenues & Volume By Refrigeration & Cooling for the Period 2022 - 2032F
- Historical Data and Forecast of Croatia Ammonia Water Market Revenues & Volume By End-Use for the Period 2022 - 2032F
- Historical Data and Forecast of Croatia Ammonia Water Market Revenues & Volume By Municipal Utilities for the Period 2022 - 2032F
- Historical Data and Forecast of Croatia Ammonia Water Market Revenues & Volume By Chemical Manufacturing for the Period 2022 - 2032F
- Historical Data and Forecast of Croatia Ammonia Water Market Revenues & Volume By Agriculture Industry for the Period 2022 - 2032F
- Historical Data and Forecast of Croatia Ammonia Water Market Revenues & Volume By Food Processing for the Period 2022 - 2032F
- Croatia Ammonia Water Import Export Trade Statistics
- Market Opportunity Assessment By Concentration Type
- Market Opportunity Assessment By Application
- Market Opportunity Assessment By End-Use
- Croatia Ammonia Water Top Companies Market Share
- Croatia Ammonia Water Competitive Benchmarking By Technical and Operational Parameters
- Croatia Ammonia Water Company Profiles
- Croatia Ammonia Water Key Strategic Recommendations
Frequently Asked Questions About the Market Study (FAQs):
6Wresearch actively monitors the Croatia Ammonia Water Market and publishes its comprehensive annual report, highlighting emerging trends, growth drivers, revenue analysis, and forecast outlook. Our insights help businesses to make data-backed strategic decisions with ongoing market dynamics. Our analysts track relevent industries related to the Croatia Ammonia Water Market, allowing our clients with actionable intelligence and reliable forecasts tailored to emerging regional needs.
Yes, we provide customisation as per your requirements. To learn more, feel free to contact us on sales@6wresearch.com
1 Executive Summary |
2 Introduction |
2.1 Key Highlights of the Report |
2.2 Report Description |
2.3 Market Scope & Segmentation |
2.4 Research Methodology |
2.5 Assumptions |
3 Croatia Ammonia Water Market Overview |
3.1 Croatia Country Macro Economic Indicators |
3.2 Croatia Ammonia Water Market Revenues & Volume, 2022 & 2032F |
3.3 Croatia Ammonia Water Market - Industry Life Cycle |
3.4 Croatia Ammonia Water Market - Porter's Five Forces |
3.5 Croatia Ammonia Water Market Revenues & Volume Share, By Concentration Type, 2022 & 2032F |
3.6 Croatia Ammonia Water Market Revenues & Volume Share, By Application, 2022 & 2032F |
3.7 Croatia Ammonia Water Market Revenues & Volume Share, By End-Use, 2022 & 2032F |
4 Croatia Ammonia Water Market Dynamics |
4.1 Impact Analysis |
4.2 Market Drivers |
4.3 Market Restraints |
5 Croatia Ammonia Water Market Trends |
6 Croatia Ammonia Water Market, By Types |
6.1 Croatia Ammonia Water Market, By Concentration Type |
6.1.1 Overview and Analysis |
6.1.2 Croatia Ammonia Water Market Revenues & Volume, By Concentration Type, 2022 - 2032F |
6.1.3 Croatia Ammonia Water Market Revenues & Volume, By Low-Concentration Ammonia, 2022 - 2032F |
6.1.4 Croatia Ammonia Water Market Revenues & Volume, By High-Concentration Ammonia, 2022 - 2032F |
6.1.5 Croatia Ammonia Water Market Revenues & Volume, By Ammonium Hydroxide, 2022 - 2032F |
6.1.6 Croatia Ammonia Water Market Revenues & Volume, By Ammonia Solution, 2022 - 2032F |
6.2 Croatia Ammonia Water Market, By Application |
6.2.1 Overview and Analysis |
6.2.2 Croatia Ammonia Water Market Revenues & Volume, By Water Treatment, 2022 - 2032F |
6.2.3 Croatia Ammonia Water Market Revenues & Volume, By Industrial Use, 2022 - 2032F |
6.2.4 Croatia Ammonia Water Market Revenues & Volume, By Fertilizers & Agrochemicals, 2022 - 2032F |
6.2.5 Croatia Ammonia Water Market Revenues & Volume, By Refrigeration & Cooling, 2022 - 2032F |
6.3 Croatia Ammonia Water Market, By End-Use |
6.3.1 Overview and Analysis |
6.3.2 Croatia Ammonia Water Market Revenues & Volume, By Municipal Utilities, 2022 - 2032F |
6.3.3 Croatia Ammonia Water Market Revenues & Volume, By Chemical Manufacturing, 2022 - 2032F |
6.3.4 Croatia Ammonia Water Market Revenues & Volume, By Agriculture Industry, 2022 - 2032F |
6.3.5 Croatia Ammonia Water Market Revenues & Volume, By Food Processing, 2022 - 2032F |
7 Croatia Ammonia Water Market Import-Export Trade Statistics |
7.1 Croatia Ammonia Water Market Export to Major Countries |
7.2 Croatia Ammonia Water Market Imports from Major Countries |
8 Croatia Ammonia Water Market Key Performance Indicators |
9 Croatia Ammonia Water Market - Opportunity Assessment |
9.1 Croatia Ammonia Water Market Opportunity Assessment, By Concentration Type, 2022 & 2032F |
9.2 Croatia Ammonia Water Market Opportunity Assessment, By Application, 2022 & 2032F |
9.3 Croatia Ammonia Water Market Opportunity Assessment, By End-Use, 2022 & 2032F |
10 Croatia Ammonia Water Market - Competitive Landscape |
10.1 Croatia Ammonia Water Market Revenue Share, By Companies, 2025 |
10.2 Croatia Ammonia Water Market Competitive Benchmarking, By Operating and Technical Parameters |
11 Company Profiles |
12 Recommendations |
13 Disclaimer |
Global Go To Market Strategy - 2030
Export potential enables firms to identify high-growth global markets with greater confidence by combining advanced trade intelligence with a structured quantitative methodology. The framework analyzes emerging demand trends and country-level import patterns while integrating macroeconomic and trade datasets such as GDP and population forecasts, bilateral import–export flows, tariff structures, elasticity differentials between developed and developing economies, geographic distance, and import demand projections. Using weighted trade values from 2020–2024 as the base period to project country-to-country export potential for 2030, these inputs are operationalized through calculated drivers such as gravity model parameters, tariff impact factors, and projected GDP per-capita growth. Through an analysis of hidden potentials, demand hotspots, and market conditions that are most favorable to success, this method enables firms to focus on target countries, maximize returns, and global expansion with data, backed by accuracy.
By factoring in the projected importer demand gap that is currently unmet and could be potential opportunity, it identifies the potential for the Exporter (Country) among 190 countries, against the general trade analysis, which identifies the biggest importer or exporter.
To discover high-growth global markets and optimize your business strategy:
Click Here
Pricing
- Single User License$ 1,995
- Department License$ 2,400
- Site License$ 3,120
- Global License$ 3,795

Leadership Perspectives from Industry Events
Search
Thought Leadership and Analyst Meet


Our Clients
6WResearch In News
- India Export Attractiveness Tracker 2026
- India Air Conditioner Market Set for Strong Rebound in 2026 After Weather-Led Correction and GST-Driven Recovery: 6Wresearch
- ADAS in India: How Automatic Emergency Braking, Blind Spot Detection & Driver Monitoring are Transforming Road Safety
- Doha a strategic location for EV manufacturing hub: IPA Qatar
- Demand for luxury TVs surging in the GCC, says Samsung
- Empowering Growth: The Thriving Journey of Bangladesh’s Cable Industry
Latest Reports
- Nicaragua RPG Gaming Market (2026-2032)
- New Zealand RPG Gaming Market (2026-2032)
- Netherlands RPG Gaming Market (2026-2032)
- Nauru RPG Gaming Market (2026-2032)
- Namibia RPG Gaming Market (2026-2032)
- Mozambique RPG Gaming Market (2026-2032)
- Montenegro RPG Gaming Market (2026-2032)
- Mongolia RPG Gaming Market (2026-2032)
- Monaco RPG Gaming Market (2026-2032)
- Micronesia RPG Gaming Market (2026-2032)
Industry Events and Analyst Meet

EV India Expo 2026

HIMTEX 2026

India Refining Summit 2026

India EV Show 2026

EV tech India Expo 2026
Whitepaper
- Middle East & Africa Commercial Security Market Click here to view more.
- Middle East & Africa Fire Safety Systems & Equipment Market Click here to view more.
- GCC Drone Market Click here to view more.
- Middle East Lighting Fixture Market Click here to view more.
- GCC Physical & Perimeter Security Market Click here to view more.