Croatia Antiglare Glass Market (2026-2032) | Consumer Insights, Strategic Insights, Strategy, Growth, Supply, Investment Trends, Opportunities, Analysis, Drivers, Size, Revenue, Share, Industry, Restraints, Demand, Forecast, Challenges, Trends, Competition, Value, Segmentation, Segments, Outlook, Companies, Pricing Analysis, Competitive
Market Forecast By Type (Etched, Coated), By Application (Automotive, Electronics, Architectural), By End User (Construction, Consumer Electronics) And Competitive Landscape
| Product Code: ETC11392469 | Publication Date: Apr 2025 | Updated Date: Apr 2026 | Product Type: Market Research Report | |
| Publisher: 6Wresearch | Author: Bhawna Singh | No. of Pages: 65 | No. of Figures: 34 | No. of Tables: 19 |
Croatia Antiglare Glass Market Size (2020-2030)
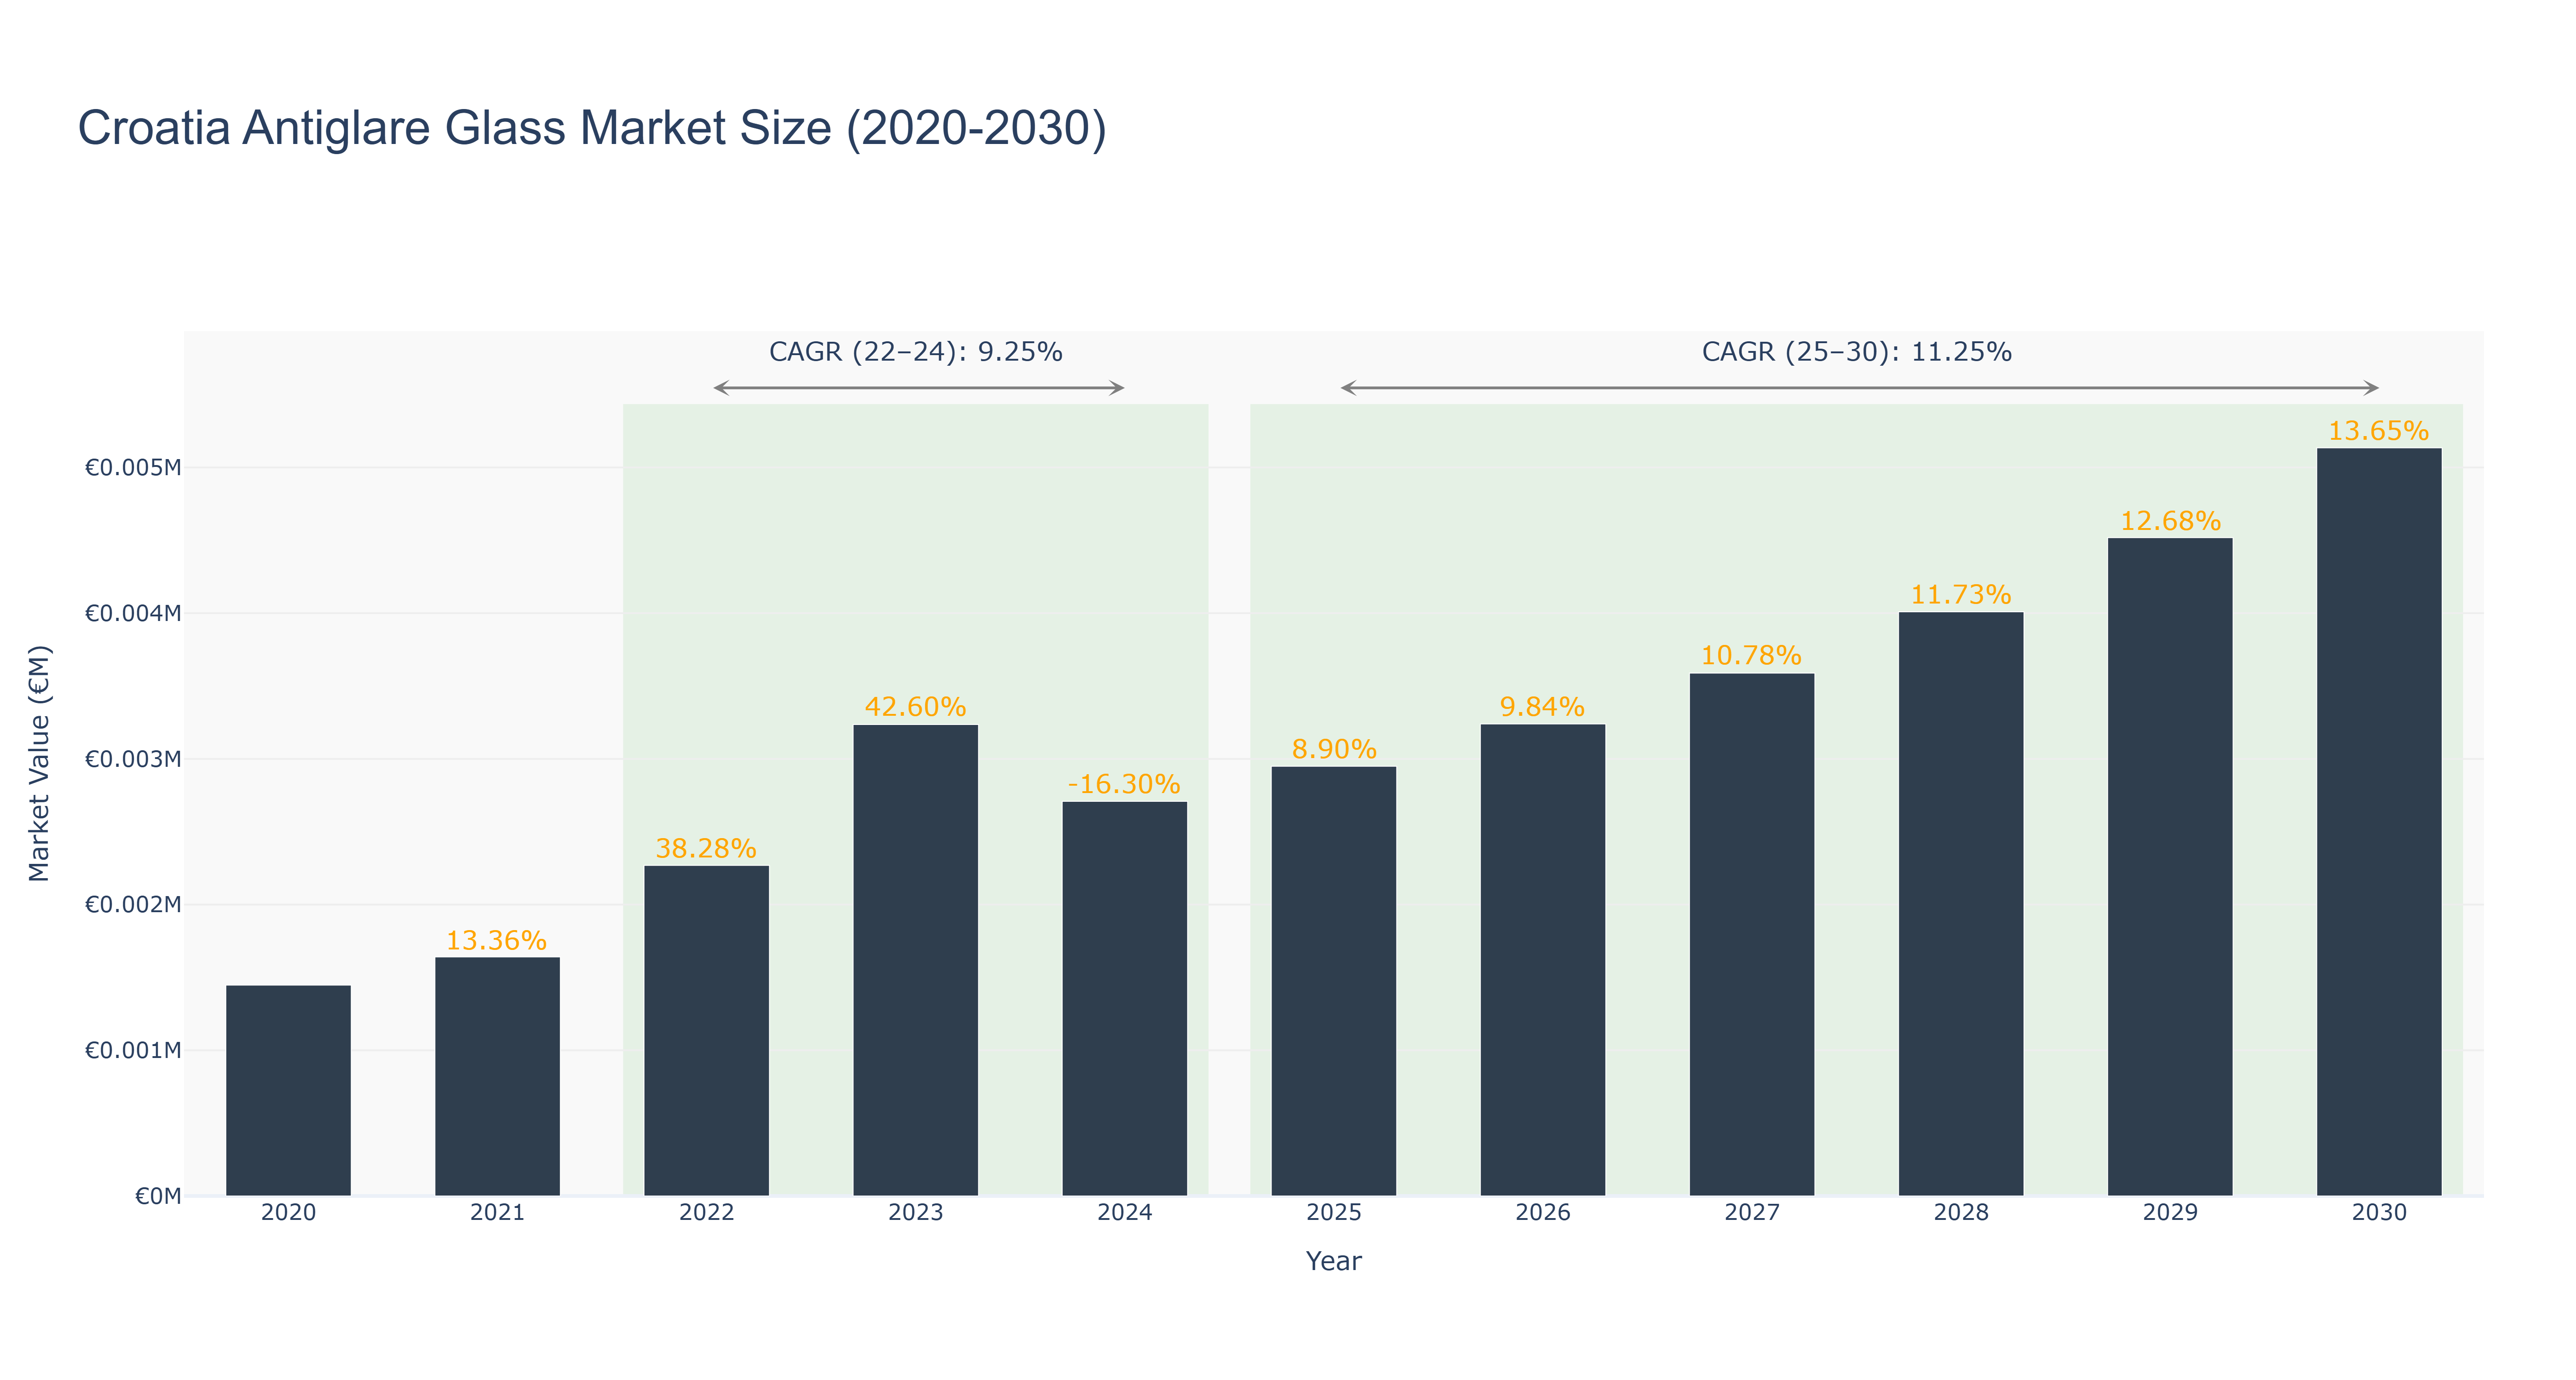
The Croatia Antiglare Glass Market has exhibited a dynamic trajectory, characterized by significant growth from €1.45 thousand in 2020 to a peak of €3.24 thousand in 2023, reflecting a robust compound annual growth rate (CAGR) of 9.25% from 2022 to 2024. This period was marked by a remarkable surge in demand, particularly in the automotive and electronics sectors, driven by increasing consumer awareness regarding eye protection and comfort. However, a projected decline to €2.71 thousand in 2024 indicates potential market saturation or economic fluctuations. Looking ahead, the forecasted period from 2025 to 2030 anticipates a recovery, with market size expected to reach €5.14 thousand by 2030, reflecting a CAGR of 11.25%. Continued advancements in technology and rising investments in infrastructure are expected to fuel this growth, positioning the market favorably for sustained expansion in the coming years.
Croatia Antiglare Glass Market: Production & Trade Performance (2019-2025)
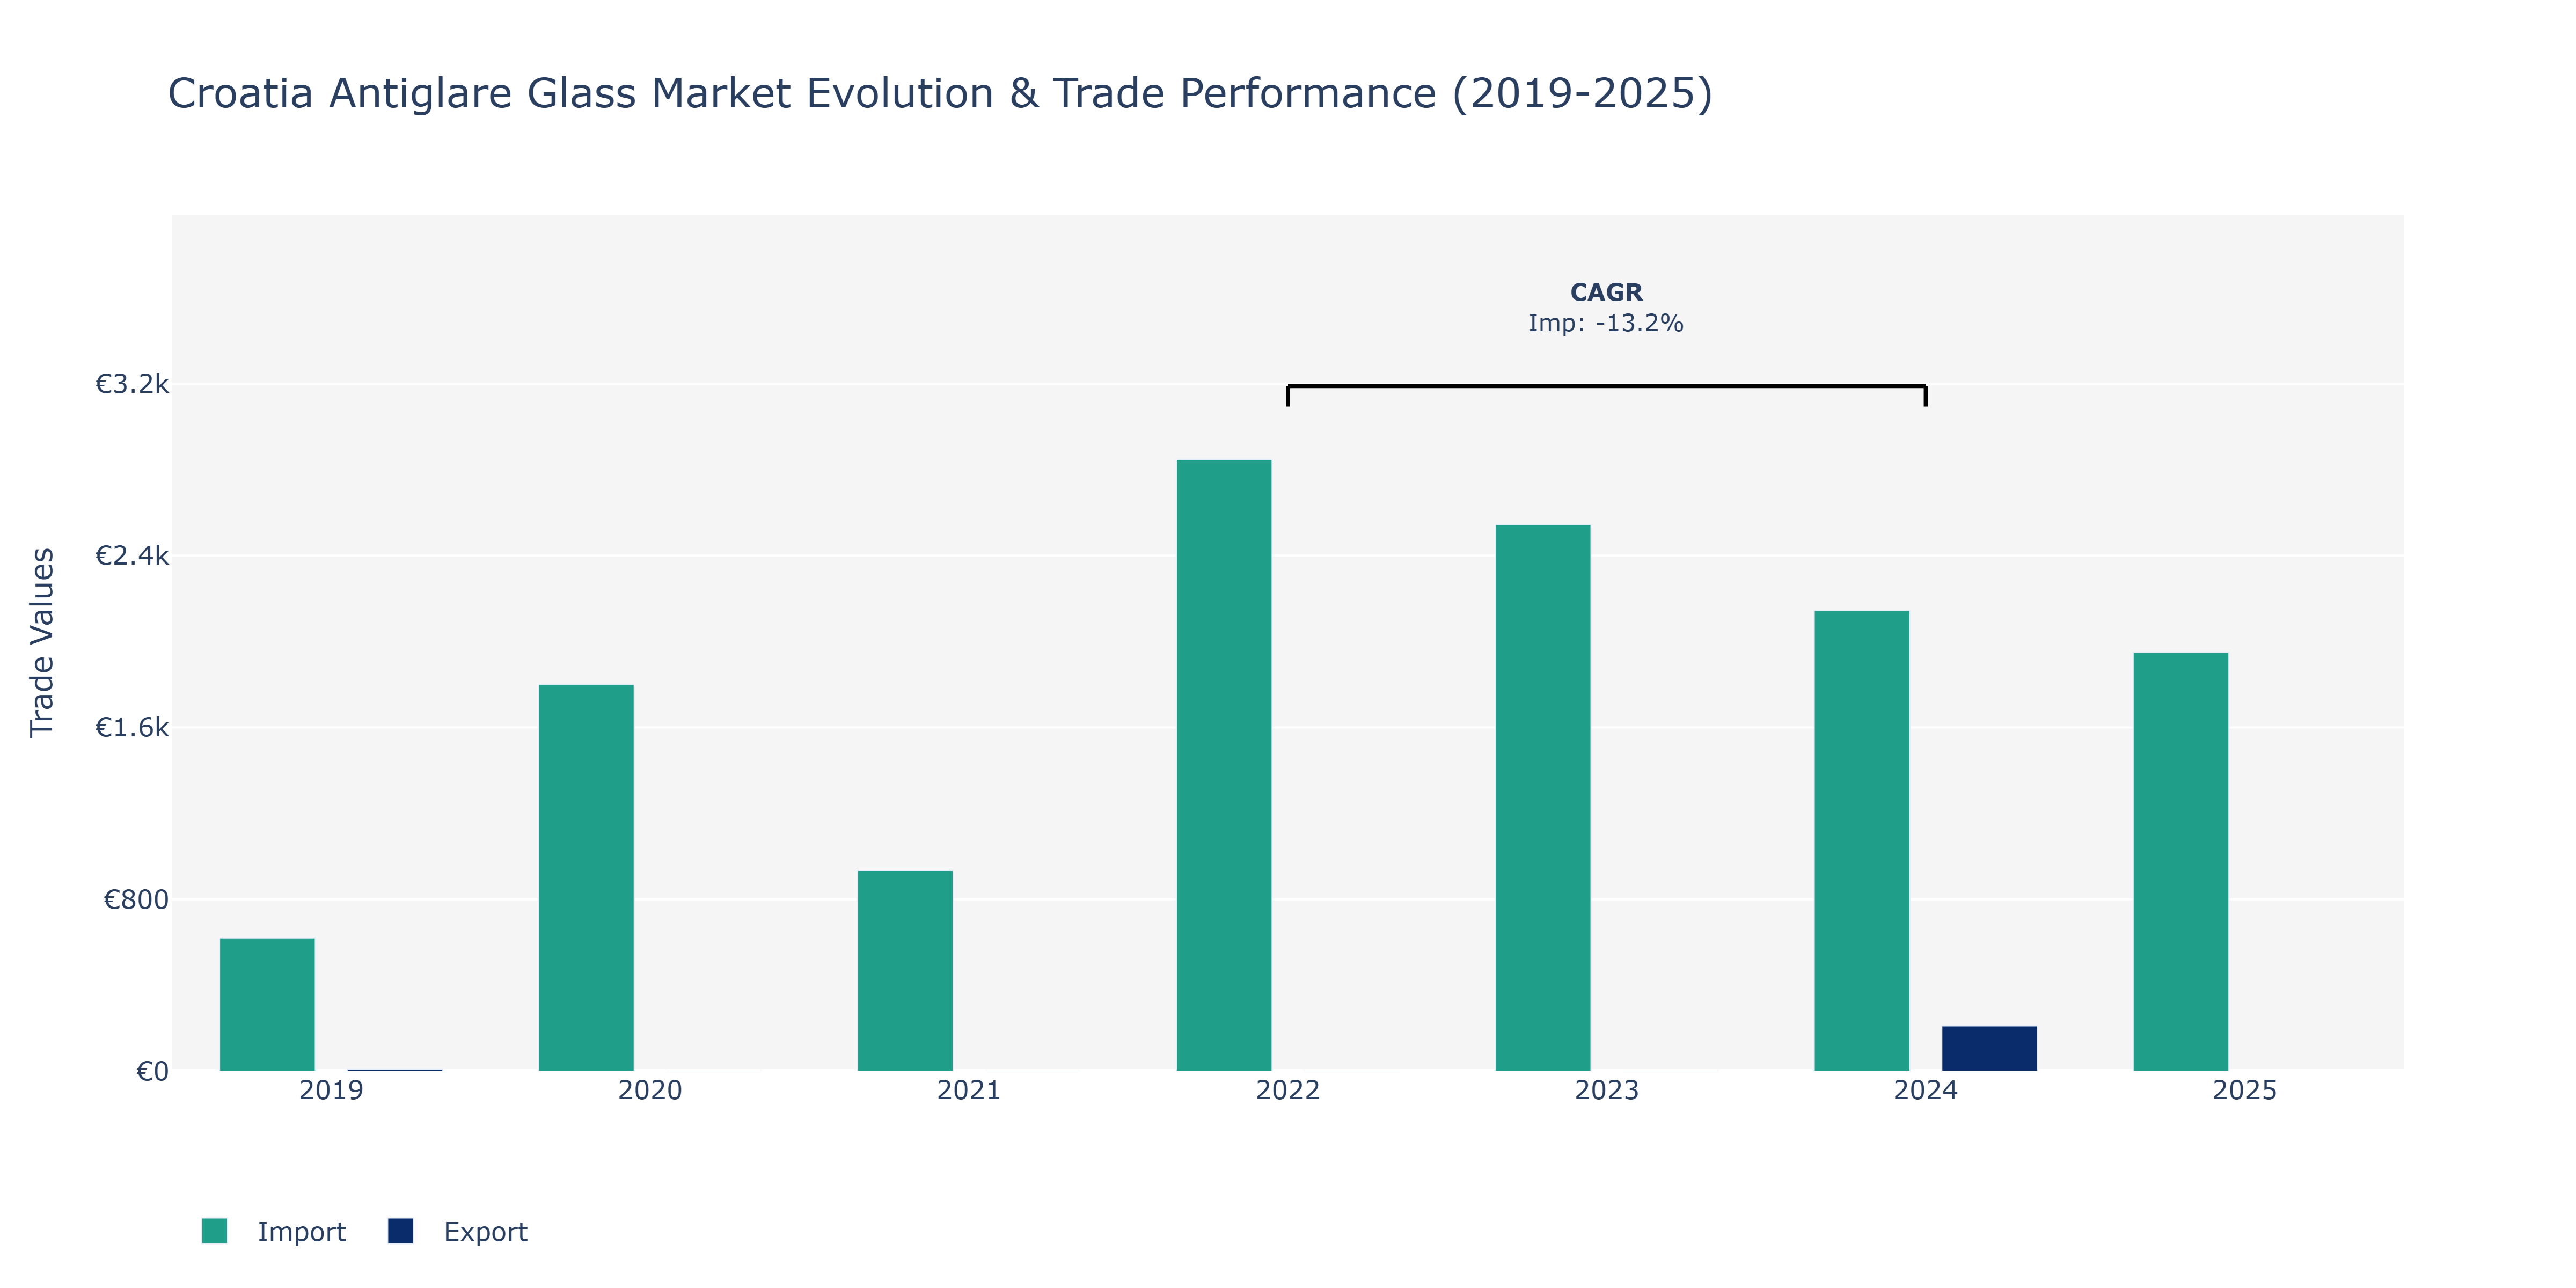
In the Croatia Antiglare Glass Market, the trend in exports and imports showed varied movements from 2019 to 2025. In 2019, exports stood at €10 million, contrasting sharply with imports at €620 million. A notable spike in imports occurred in 2020, soaring to €1.8 thousand, and continued to fluctuate in subsequent years, with peaks in 2022 at €2.85 thousand and in 2024 at €2.15 thousand. Concurrently, exports in 2024 were recorded at €211 million. The market experienced a decline in imports in 2025, dropping to €1.95 thousand. These fluctuations can be attributed to factors such as changes in demand for antiglare glass products, shifts in consumer preferences, and global economic conditions affecting trade dynamics. The increase in imports may reflect growing demand for antiglare glass in various applications, while fluctuations could stem from changes in production capacities or trade agreements impacting market dynamics.
Key Highlights of the Report:
- Croatia Antiglare Glass Market Outlook
- Market Size of Croatia Antiglare Glass Market, 2025
- Forecast of Croatia Antiglare Glass Market, 2032
- Historical Data and Forecast of Croatia Antiglare Glass Revenues & Volume for the Period 2022 - 2032F
- Croatia Antiglare Glass Market Trend Evolution
- Croatia Antiglare Glass Market Drivers and Challenges
- Croatia Antiglare Glass Price Trends
- Croatia Antiglare Glass Porter's Five Forces
- Croatia Antiglare Glass Industry Life Cycle
- Historical Data and Forecast of Croatia Antiglare Glass Market Revenues & Volume By Type for the Period 2022 - 2032F
- Historical Data and Forecast of Croatia Antiglare Glass Market Revenues & Volume By Etched for the Period 2022 - 2032F
- Historical Data and Forecast of Croatia Antiglare Glass Market Revenues & Volume By Coated for the Period 2022 - 2032F
- Historical Data and Forecast of Croatia Antiglare Glass Market Revenues & Volume By Application for the Period 2022 - 2032F
- Historical Data and Forecast of Croatia Antiglare Glass Market Revenues & Volume By Automotive for the Period 2022 - 2032F
- Historical Data and Forecast of Croatia Antiglare Glass Market Revenues & Volume By Electronics for the Period 2022 - 2032F
- Historical Data and Forecast of Croatia Antiglare Glass Market Revenues & Volume By Architectural for the Period 2022 - 2032F
- Historical Data and Forecast of Croatia Antiglare Glass Market Revenues & Volume By End User for the Period 2022 - 2032F
- Historical Data and Forecast of Croatia Antiglare Glass Market Revenues & Volume By Construction for the Period 2022 - 2032F
- Historical Data and Forecast of Croatia Antiglare Glass Market Revenues & Volume By Consumer Electronics for the Period 2022 - 2032F
- Croatia Antiglare Glass Import Export Trade Statistics
- Market Opportunity Assessment By Type
- Market Opportunity Assessment By Application
- Market Opportunity Assessment By End User
- Croatia Antiglare Glass Top Companies Market Share
- Croatia Antiglare Glass Competitive Benchmarking By Technical and Operational Parameters
- Croatia Antiglare Glass Company Profiles
- Croatia Antiglare Glass Key Strategic Recommendations
Frequently Asked Questions About the Market Study (FAQs):
6Wresearch actively monitors the Croatia Antiglare Glass Market and publishes its comprehensive annual report, highlighting emerging trends, growth drivers, revenue analysis, and forecast outlook. Our insights help businesses to make data-backed strategic decisions with ongoing market dynamics. Our analysts track relevent industries related to the Croatia Antiglare Glass Market, allowing our clients with actionable intelligence and reliable forecasts tailored to emerging regional needs.
Yes, we provide customisation as per your requirements. To learn more, feel free to contact us on sales@6wresearch.com
1 Executive Summary |
2 Introduction |
2.1 Key Highlights of the Report |
2.2 Report Description |
2.3 Market Scope & Segmentation |
2.4 Research Methodology |
2.5 Assumptions |
3 Croatia Antiglare Glass Market Overview |
3.1 Croatia Country Macro Economic Indicators |
3.2 Croatia Antiglare Glass Market Revenues & Volume, 2022 & 2032F |
3.3 Croatia Antiglare Glass Market - Industry Life Cycle |
3.4 Croatia Antiglare Glass Market - Porter's Five Forces |
3.5 Croatia Antiglare Glass Market Revenues & Volume Share, By Type, 2022 & 2032F |
3.6 Croatia Antiglare Glass Market Revenues & Volume Share, By Application, 2022 & 2032F |
3.7 Croatia Antiglare Glass Market Revenues & Volume Share, By End User, 2022 & 2032F |
4 Croatia Antiglare Glass Market Dynamics |
4.1 Impact Analysis |
4.2 Market Drivers |
4.2.1 Increasing awareness about the benefits of antiglare glass in enhancing visibility and reducing glare in various applications such as automotive, aviation, and electronics. |
4.2.2 Growing demand for antiglare glass in architectural projects for improved aesthetics and energy efficiency. |
4.3 Market Restraints |
4.3.1 High initial cost of antiglare glass compared to traditional glass products. |
4.3.2 Limited availability of antiglare glass options in the market, leading to potential supply chain challenges. |
5 Croatia Antiglare Glass Market Trends |
6 Croatia Antiglare Glass Market, By Types |
6.1 Croatia Antiglare Glass Market, By Type |
6.1.1 Overview and Analysis |
6.1.2 Croatia Antiglare Glass Market Revenues & Volume, By Type, 2022 - 2032F |
6.1.3 Croatia Antiglare Glass Market Revenues & Volume, By Etched, 2022 - 2032F |
6.1.4 Croatia Antiglare Glass Market Revenues & Volume, By Coated, 2022 - 2032F |
6.2 Croatia Antiglare Glass Market, By Application |
6.2.1 Overview and Analysis |
6.2.2 Croatia Antiglare Glass Market Revenues & Volume, By Automotive, 2022 - 2032F |
6.2.3 Croatia Antiglare Glass Market Revenues & Volume, By Electronics, 2022 - 2032F |
6.2.4 Croatia Antiglare Glass Market Revenues & Volume, By Architectural, 2022 - 2032F |
6.3 Croatia Antiglare Glass Market, By End User |
6.3.1 Overview and Analysis |
6.3.2 Croatia Antiglare Glass Market Revenues & Volume, By Construction, 2022 - 2032F |
6.3.3 Croatia Antiglare Glass Market Revenues & Volume, By Consumer Electronics, 2022 - 2032F |
7 Croatia Antiglare Glass Market Import-Export Trade Statistics |
7.1 Croatia Antiglare Glass Market Export to Major Countries |
7.2 Croatia Antiglare Glass Market Imports from Major Countries |
8 Croatia Antiglare Glass Market Key Performance Indicators |
8.1 Number of new applications or industries adopting antiglare glass technology. |
8.2 Percentage increase in the use of antiglare glass in architectural projects. |
8.3 Average cost reduction percentage of antiglare glass products over time. |
8.4 Customer satisfaction scores related to the performance of antiglare glass products. |
8.5 Number of patents or innovations in antiglare glass technology. |
9 Croatia Antiglare Glass Market - Opportunity Assessment |
9.1 Croatia Antiglare Glass Market Opportunity Assessment, By Type, 2022 & 2032F |
9.2 Croatia Antiglare Glass Market Opportunity Assessment, By Application, 2022 & 2032F |
9.3 Croatia Antiglare Glass Market Opportunity Assessment, By End User, 2022 & 2032F |
10 Croatia Antiglare Glass Market - Competitive Landscape |
10.1 Croatia Antiglare Glass Market Revenue Share, By Companies, 2025 |
10.2 Croatia Antiglare Glass Market Competitive Benchmarking, By Operating and Technical Parameters |
11 Company Profiles |
12 Recommendations |
13 Disclaimer |
Export potential assessment - trade Analytics for 2030
Export potential enables firms to identify high-growth global markets with greater confidence by combining advanced trade intelligence with a structured quantitative methodology. The framework analyzes emerging demand trends and country-level import patterns while integrating macroeconomic and trade datasets such as GDP and population forecasts, bilateral import–export flows, tariff structures, elasticity differentials between developed and developing economies, geographic distance, and import demand projections. Using weighted trade values from 2020–2024 as the base period to project country-to-country export potential for 2030, these inputs are operationalized through calculated drivers such as gravity model parameters, tariff impact factors, and projected GDP per-capita growth. Through an analysis of hidden potentials, demand hotspots, and market conditions that are most favorable to success, this method enables firms to focus on target countries, maximize returns, and global expansion with data, backed by accuracy.
By factoring in the projected importer demand gap that is currently unmet and could be potential opportunity, it identifies the potential for the Exporter (Country) among 190 countries, against the general trade analysis, which identifies the biggest importer or exporter.
To discover high-growth global markets and optimize your business strategy:
Click Here
Pricing
- Single User License$ 1,995
- Department License$ 2,400
- Site License$ 3,120
- Global License$ 3,795

Search
Thought Leadership and Analyst Meet


Our Clients
Latest Reports
- United Kingdom (UK) Outdoor Cooking Equipment Market (2026-2032) | Investment Opportunities, Outlook, Growth, Competition, Trends, Pricing, Demand, Insights, Challenges, Drivers, Size, Restraints, segmentation, Value, Share, Forecast, Companies, Analysis, Revenue, Strategy
- United Arab Emirates (UAE) Outdoor Cooking Equipment Market (2026-2032) | Challenges, Value, Restraints, Growth, Competition, Revenue, Trends, Outlook, Analysis, Drivers, Share, Investment Opportunities, Strategy, Demand, Companies, Forecast, Pricing, segmentation, Size, Insights
- Vietnam Outdoor Cooking Equipment Market (2026-2032) | Demand, Investment Opportunities, Growth, Pricing, Trends, Restraints, Competition, Outlook, Drivers, Strategy, Challenges, Revenue, Analysis, segmentation, Value, Size, Share, Insights, Companies, Forecast
- Venezuela Outdoor Cooking Equipment Market (2026-2032) | Challenges, Revenue, Demand, Value, Pricing, Strategy, Competition, Analysis, Companies, Insights, Growth, Outlook, Forecast, Size, Restraints, segmentation, Drivers, Trends, Investment Opportunities, Share
- Uganda Outdoor Cooking Equipment Market (2026-2032) | Drivers, Pricing, Challenges, Value, Growth, Companies, segmentation, Strategy, Analysis, Demand, Outlook, Size, Competition, Restraints, Revenue, Forecast, Investment Opportunities, Insights, Trends, Share
- Turkey Outdoor Cooking Equipment Market (2026-2032) | Size, Competition, Outlook, Strategy, Forecast, Drivers, Trends, Companies, Revenue, Growth, Analysis, segmentation, Insights, Pricing, Restraints, Demand, Investment Opportunities, Value, Share, Challenges
- Tunisia Outdoor Cooking Equipment Market (2026-2032) | Analysis, Share, Pricing, Trends, Size, Outlook, Revenue, segmentation, Demand, Insights, Investment Opportunities, Restraints, Growth, Forecast, Competition, Drivers, Challenges, Companies, Strategy, Value
- Thailand Outdoor Cooking Equipment Market (2026-2032) | Growth, Revenue, Insights, Companies, Drivers, Strategy, Forecast, Size, Analysis, segmentation, Trends, Challenges, Competition, Share, Investment Opportunities, Demand, Pricing, Value, Restraints, Outlook
- Tanzania Outdoor Cooking Equipment Market (2026-2032) | Share, Drivers, Forecast, Revenue, Growth, Outlook, Analysis, Investment Opportunities, Restraints, segmentation, Demand, Pricing, Size, Insights, Challenges, Competition, Companies, Value, Trends, Strategy
- Tajikistan Outdoor Cooking Equipment Market (2026-2032) | Value, Pricing, Companies, Share, Strategy, Revenue, Investment Opportunities, Demand, Forecast, Size, Competition, Challenges, Growth, Insights, Restraints, segmentation, Analysis, Trends, Drivers, Outlook
Industry Events and Analyst Meet

HIMTEX 2026

India Refining Summit 2026

India EV Show 2026

EV tech India Expo 2026

Auto Tech Asia 2026
Whitepaper
- Middle East & Africa Commercial Security Market Click here to view more.
- Middle East & Africa Fire Safety Systems & Equipment Market Click here to view more.
- GCC Drone Market Click here to view more.
- Middle East Lighting Fixture Market Click here to view more.
- GCC Physical & Perimeter Security Market Click here to view more.
6WResearch In News
- Doha a strategic location for EV manufacturing hub: IPA Qatar
- Demand for luxury TVs surging in the GCC, says Samsung
- Empowering Growth: The Thriving Journey of Bangladesh’s Cable Industry
- Demand for luxury TVs surging in the GCC, says Samsung
- Video call with a traditional healer? Once unthinkable, it’s now common in South Africa
- Intelligent Buildings To Smooth GCC’s Path To Net Zero