Croatia Ball Valves Market (2026-2032) | Size, Forecast, Segmentation, Revenue, Analysis, Industry, Trends, Companies, Outlook, Value, Share & Growth
Market Forecast By Type (Trunnion-mounted, Floating, Rising Stem), By Material (Stainless Steel, Cast Iron, Alloy-based), By Industry (Oil & Gas, Energy & Power, Water & Wastewater) And Competitive Landscape
| Product Code: ETC5906666 | Publication Date: Nov 2023 | Updated Date: Apr 2026 | Product Type: Market Research Report | |
| Publisher: 6Wresearch | Author: Ravi Bhandari | No. of Pages: 60 | No. of Figures: 30 | No. of Tables: 5 |
Croatia Ball Valves Market Size (2020-2030)
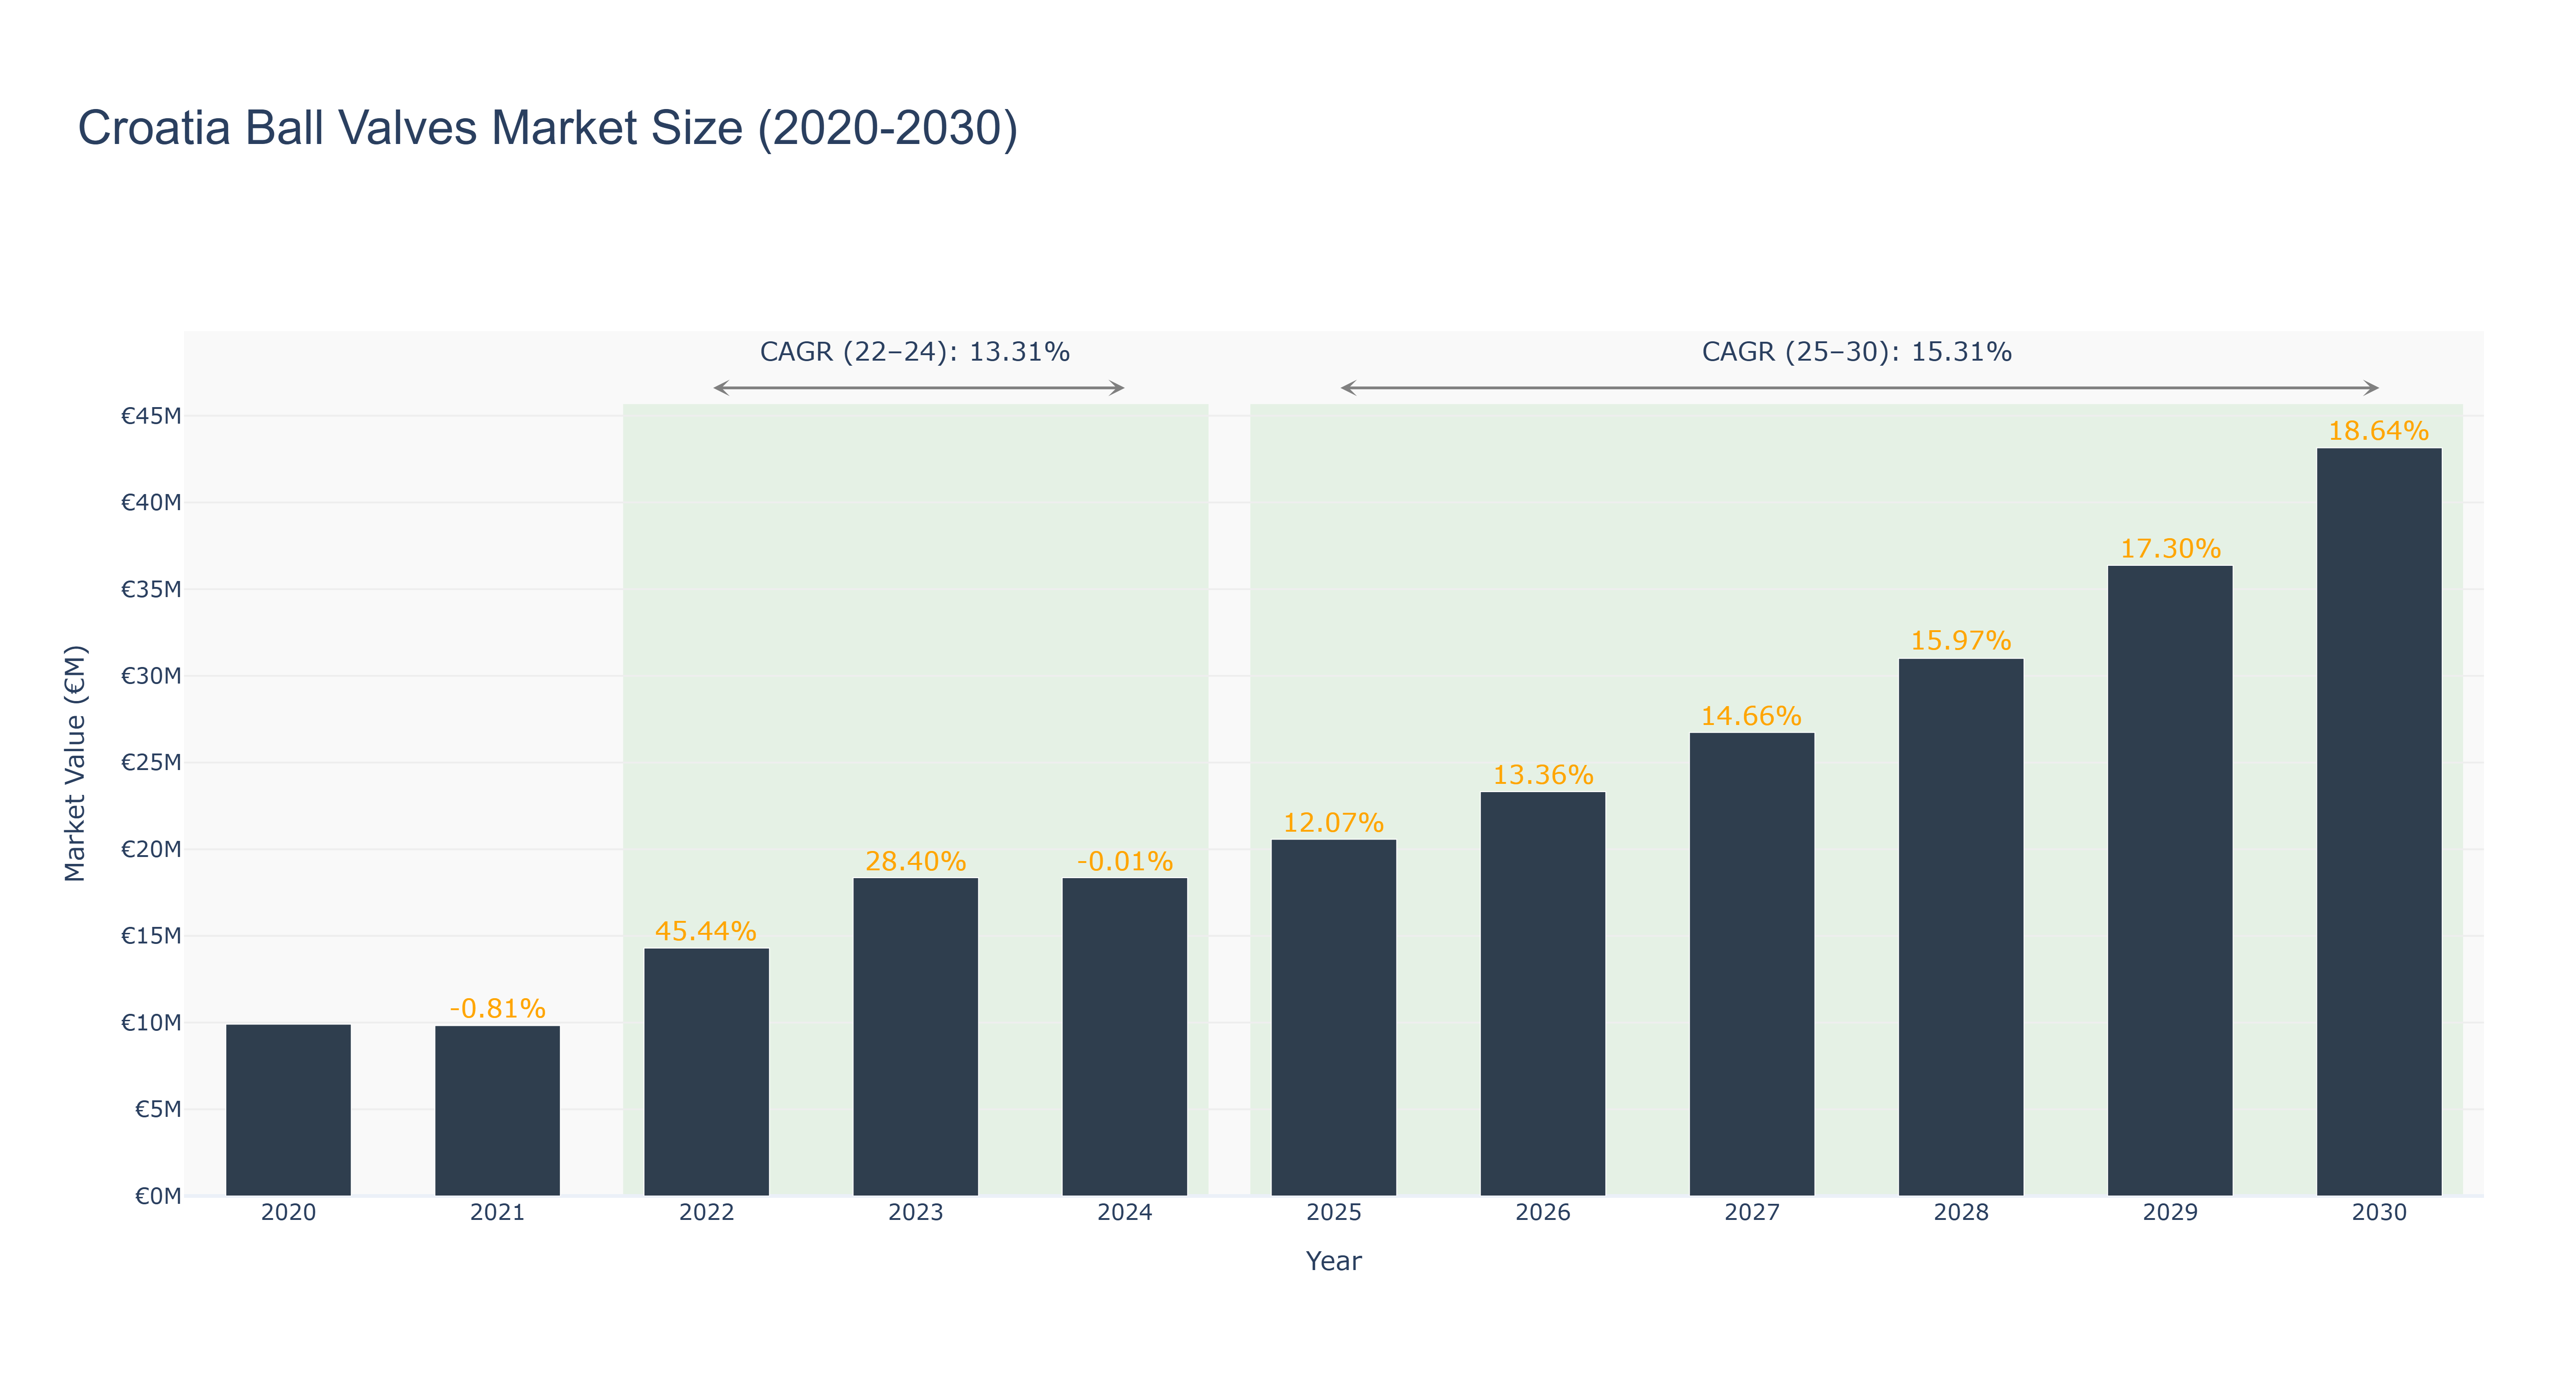
Croatia Ball Valves Market has shown a promising growth trajectory. The peak market size of €43.15 million is forecasted for 2030, with a steady increase from €14.30 million in 2022. The market experienced fluctuations, with a minor dip in 2024 before resuming its upward trend. The CAGR for the period 2025-2030 is projected at 15.31%, indicating sustained growth potential. Industry drivers such as increasing industrialization and infrastructure projects are fueling the demand for ball valves in Croatia. Recent developments include partnerships with key players to enhance product offerings and expand market reach. Future plans involve investing in advanced technologies to meet evolving consumer needs and strengthen market competitiveness. Croatia's ball valves market is poised for continued expansion, driven by innovation and strategic collaborations.
Croatia Ball Valves Market: Production & Trade Performance (2019-2025)
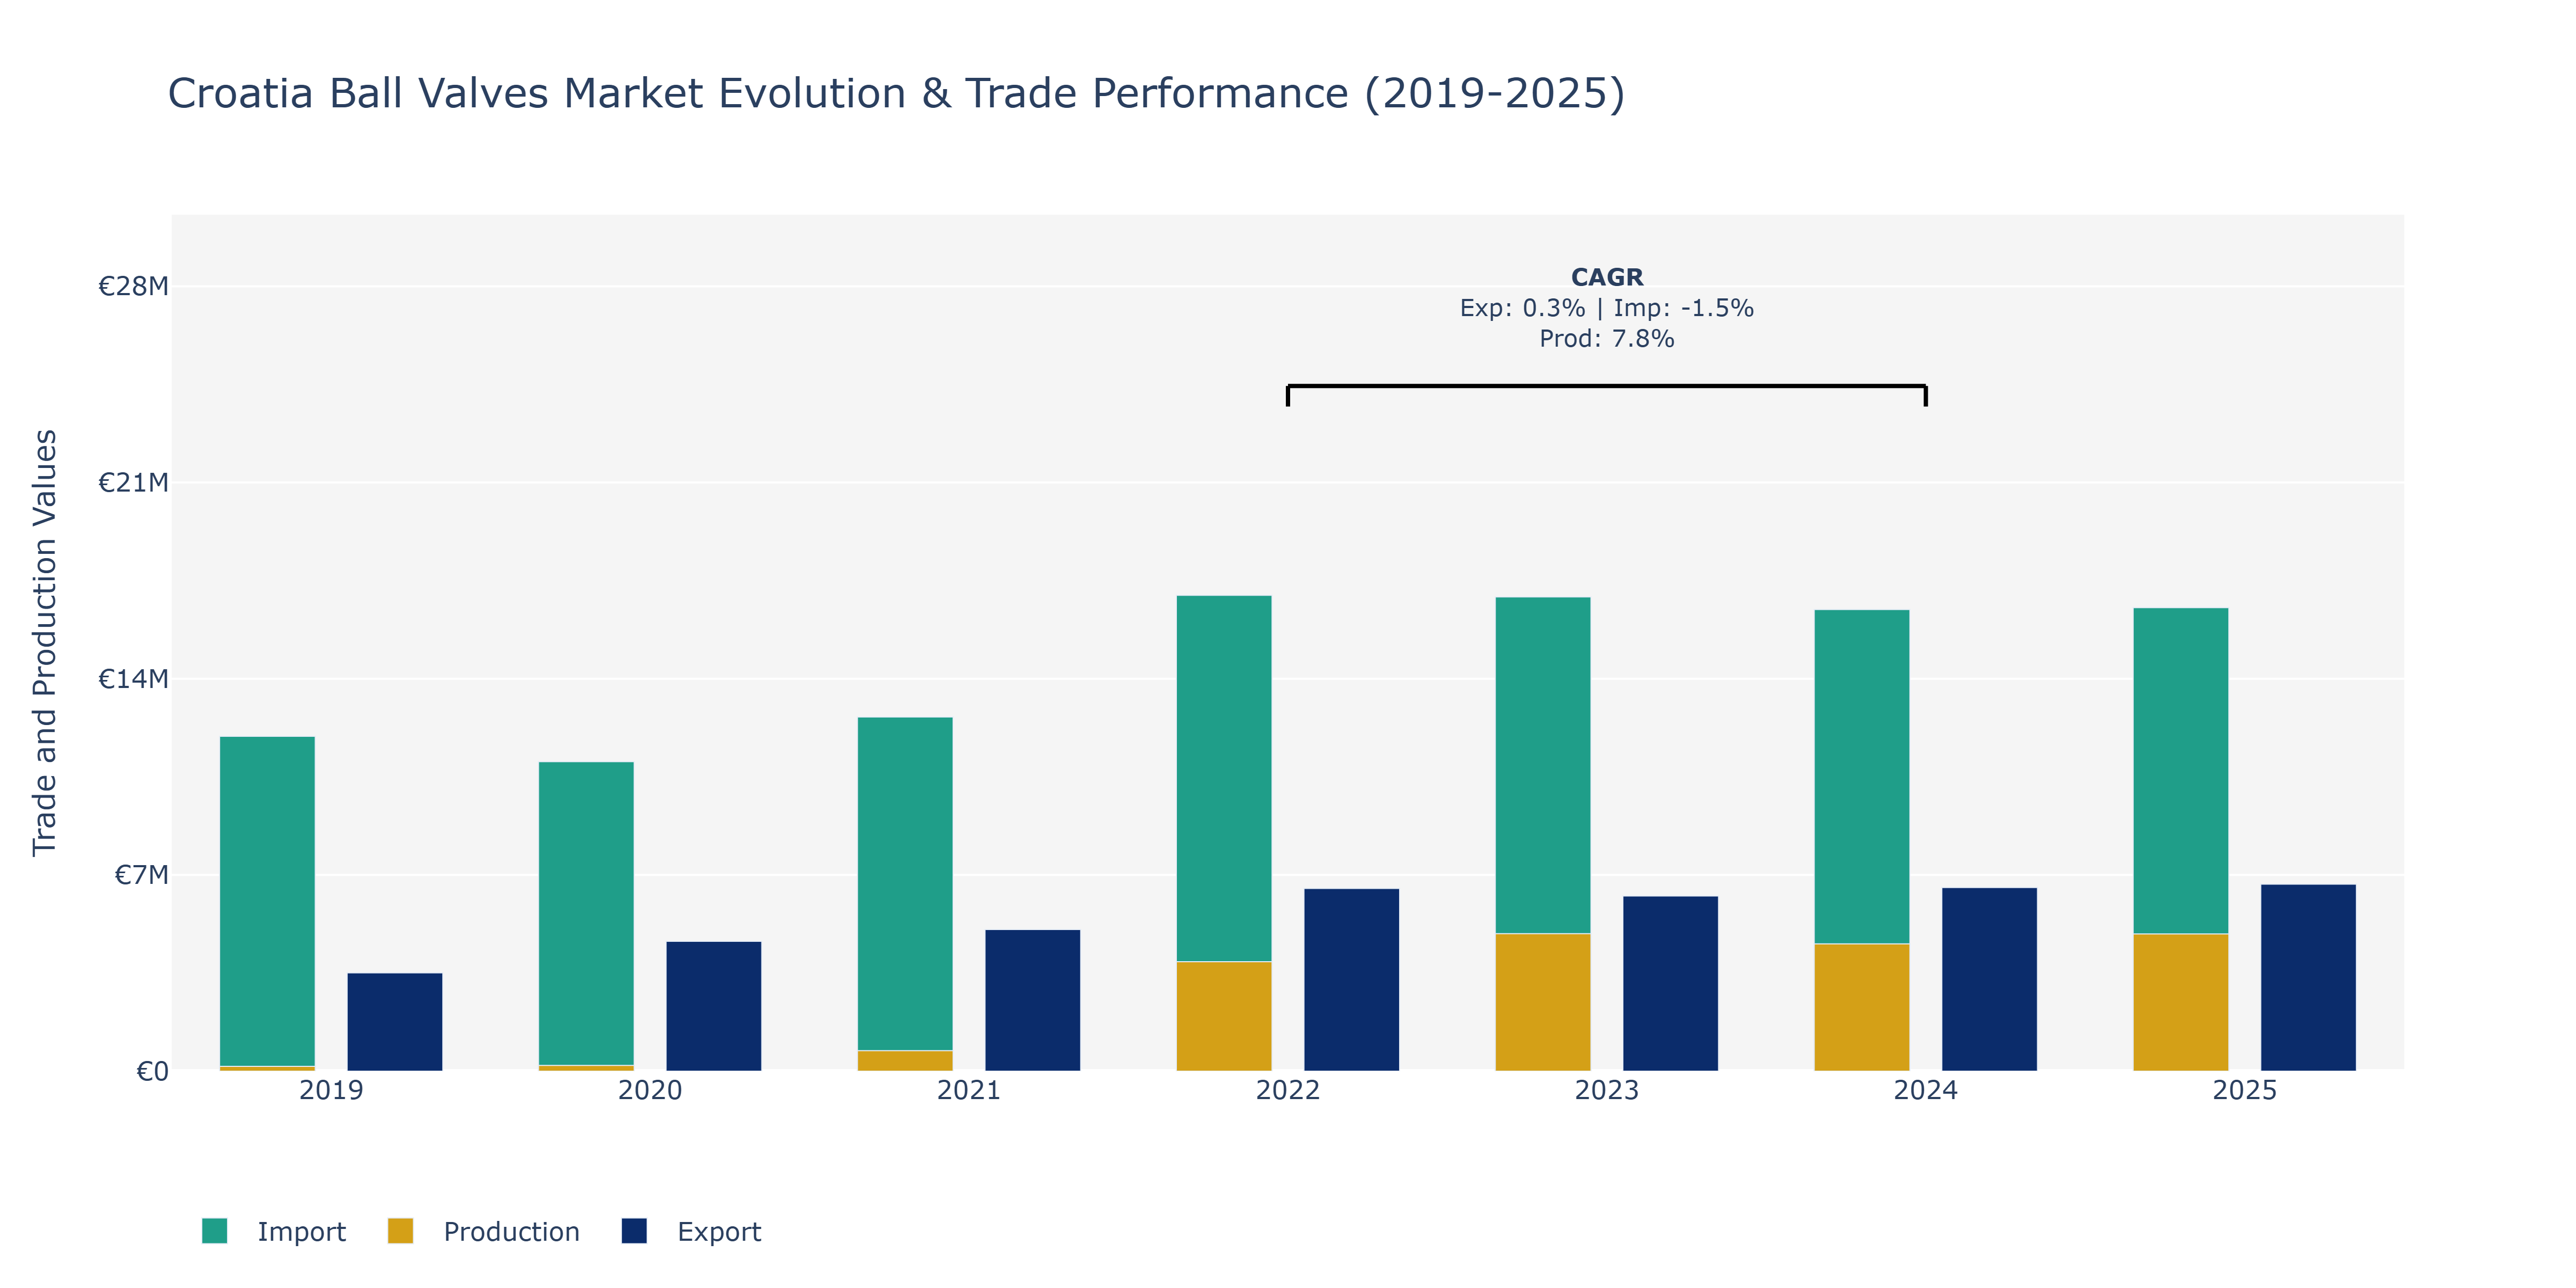
In the Croatia Ball Valves Market, exports displayed a consistent upward trend from 2019 to 2025, reaching €6.67 million. Imports, however, fluctuated notably, with a peak in 2022 at €16.98 million. Production saw a substantial increase, more than doubling from €173.74 million in 2019 to €4.90 billion in 2025. The growth in production can be attributed to increasing demand for ball valves globally, driven by industries such as oil and gas, water and wastewater, and chemical processing. The fluctuation in imports could be due to changes in global trade dynamics, impacting Croatia's import volumes. The steady growth in exports reflects Croatia's competitiveness in the ball valves market and its ability to meet international demand. To sustain this growth, continuous innovation and quality maintenance will be crucial for Croatian ball valve manufacturers.
Key Highlights of the Report:
- Croatia Ball Valves Market Outlook
- Market Size of Croatia Ball Valves Market, 2025
- Forecast of Croatia Ball Valves Market, 2032
- Historical Data and Forecast of Croatia Ball Valves Revenues & Volume for the Period 2022 - 2032F
- Croatia Ball Valves Market Trend Evolution
- Croatia Ball Valves Market Drivers and Challenges
- Croatia Ball Valves Price Trends
- Croatia Ball Valves Porter`s Five Forces
- Croatia Ball Valves Industry Life Cycle
- Historical Data and Forecast of Croatia Ball Valves Market Revenues & Volume By Type for the Period 2022 - 2032F
- Historical Data and Forecast of Croatia Ball Valves Market Revenues & Volume By Trunnion-mounted for the Period 2022 - 2032F
- Historical Data and Forecast of Croatia Ball Valves Market Revenues & Volume By Floating for the Period 2022 - 2032F
- Historical Data and Forecast of Croatia Ball Valves Market Revenues & Volume By Rising Stem for the Period 2022 - 2032F
- Historical Data and Forecast of Croatia Ball Valves Market Revenues & Volume By Material for the Period 2022 - 2032F
- Historical Data and Forecast of Croatia Ball Valves Market Revenues & Volume By Stainless Steel for the Period 2022 - 2032F
- Historical Data and Forecast of Croatia Ball Valves Market Revenues & Volume By Cast Iron for the Period 2022 - 2032F
- Historical Data and Forecast of Croatia Ball Valves Market Revenues & Volume By Alloy-based for the Period 2022 - 2032F
- Historical Data and Forecast of Croatia Ball Valves Market Revenues & Volume By Industry for the Period 2022 - 2032F
- Historical Data and Forecast of Croatia Ball Valves Market Revenues & Volume By Oil & Gas for the Period 2022 - 2032F
- Historical Data and Forecast of Croatia Ball Valves Market Revenues & Volume By Energy & Power for the Period 2022 - 2032F
- Historical Data and Forecast of Croatia Ball Valves Market Revenues & Volume By Water & Wastewater for the Period 2022 - 2032F
- Croatia Ball Valves Import Export Trade Statistics
- Market Opportunity Assessment By Type
- Market Opportunity Assessment By Material
- Market Opportunity Assessment By Industry
- Croatia Ball Valves Top Companies Market Share
- Croatia Ball Valves Competitive Benchmarking By Technical and Operational Parameters
- Croatia Ball Valves Company Profiles
- Croatia Ball Valves Key Strategic Recommendations
Frequently Asked Questions About the Market Study (FAQs):
6Wresearch actively monitors the Croatia Ball Valves Market and publishes its comprehensive annual report, highlighting emerging trends, growth drivers, revenue analysis, and forecast outlook. Our insights help businesses to make data-backed strategic decisions with ongoing market dynamics. Our analysts track relevent industries related to the Croatia Ball Valves Market, allowing our clients with actionable intelligence and reliable forecasts tailored to emerging regional needs.
Yes, we provide customisation as per your requirements. To learn more, feel free to contact us on sales@6wresearch.com
1 Executive Summary |
2 Introduction |
2.1 Key Highlights of the Report |
2.2 Report Description |
2.3 Market Scope & Segmentation |
2.4 Research Methodology |
2.5 Assumptions |
3 Croatia Ball Valves Market Overview |
3.1 Croatia Country Macro Economic Indicators |
3.2 Croatia Ball Valves Market Revenues & Volume, 2022 & 2032F |
3.3 Croatia Ball Valves Market - Industry Life Cycle |
3.4 Croatia Ball Valves Market - Porter's Five Forces |
3.5 Croatia Ball Valves Market Revenues & Volume Share, By Type, 2022 & 2032F |
3.6 Croatia Ball Valves Market Revenues & Volume Share, By Material, 2022 & 2032F |
3.7 Croatia Ball Valves Market Revenues & Volume Share, By Industry, 2022 & 2032F |
4 Croatia Ball Valves Market Dynamics |
4.1 Impact Analysis |
4.2 Market Drivers |
4.2.1 Increasing demand for energy and infrastructure projects in Croatia |
4.2.2 Growing focus on environmental sustainability and regulations driving the adoption of efficient ball valve solutions |
4.2.3 Expansion of industries such as oil gas, water & wastewater management, and chemicals in Croatia |
4.3 Market Restraints |
4.3.1 Fluctuating raw material prices impacting the manufacturing costs of ball valves |
4.3.2 Intense competition from global and regional players in the Croatia ball valves market |
4.3.3 Economic uncertainties and political instability affecting investment decisions in infrastructure projects |
5 Croatia Ball Valves Market Trends |
6 Croatia Ball Valves Market Segmentations |
6.1 Croatia Ball Valves Market, By Type |
6.1.1 Overview and Analysis |
6.1.2 Croatia Ball Valves Market Revenues & Volume, By Trunnion-mounted, 2022 - 2032F |
6.1.3 Croatia Ball Valves Market Revenues & Volume, By Floating, 2022 - 2032F |
6.1.4 Croatia Ball Valves Market Revenues & Volume, By Rising Stem, 2022 - 2032F |
6.2 Croatia Ball Valves Market, By Material |
6.2.1 Overview and Analysis |
6.2.2 Croatia Ball Valves Market Revenues & Volume, By Stainless Steel, 2022 - 2032F |
6.2.3 Croatia Ball Valves Market Revenues & Volume, By Cast Iron, 2022 - 2032F |
6.2.4 Croatia Ball Valves Market Revenues & Volume, By Alloy-based, 2022 - 2032F |
6.3 Croatia Ball Valves Market, By Industry |
6.3.1 Overview and Analysis |
6.3.2 Croatia Ball Valves Market Revenues & Volume, By Oil & Gas, 2022 - 2032F |
6.3.3 Croatia Ball Valves Market Revenues & Volume, By Energy & Power, 2022 - 2032F |
6.3.4 Croatia Ball Valves Market Revenues & Volume, By Water & Wastewater, 2022 - 2032F |
7 Croatia Ball Valves Market Import-Export Trade Statistics |
7.1 Croatia Ball Valves Market Export to Major Countries |
7.2 Croatia Ball Valves Market Imports from Major Countries |
8 Croatia Ball Valves Market Key Performance Indicators |
8.1 Percentage growth in the number of infrastructure projects in Croatia |
8.2 Adoption rate of environmentally friendly and energy-efficient ball valve solutions |
8.3 Number of new entrants or expansions of companies in the Croatia ball valves market |
8.4 Innovation rate in ball valve technologies |
8.5 Regulatory compliance rate for ball valve manufacturers |
9 Croatia Ball Valves Market - Opportunity Assessment |
9.1 Croatia Ball Valves Market Opportunity Assessment, By Type, 2022 & 2032F |
9.2 Croatia Ball Valves Market Opportunity Assessment, By Material, 2022 & 2032F |
9.3 Croatia Ball Valves Market Opportunity Assessment, By Industry, 2022 & 2032F |
10 Croatia Ball Valves Market - Competitive Landscape |
10.1 Croatia Ball Valves Market Revenue Share, By Companies, 2025 |
10.2 Croatia Ball Valves Market Competitive Benchmarking, By Operating and Technical Parameters |
11 Company Profiles |
12 Recommendations | 13 Disclaimer |
Global Go To Market Strategy - 2030
Export potential enables firms to identify high-growth global markets with greater confidence by combining advanced trade intelligence with a structured quantitative methodology. The framework analyzes emerging demand trends and country-level import patterns while integrating macroeconomic and trade datasets such as GDP and population forecasts, bilateral import–export flows, tariff structures, elasticity differentials between developed and developing economies, geographic distance, and import demand projections. Using weighted trade values from 2020–2024 as the base period to project country-to-country export potential for 2030, these inputs are operationalized through calculated drivers such as gravity model parameters, tariff impact factors, and projected GDP per-capita growth. Through an analysis of hidden potentials, demand hotspots, and market conditions that are most favorable to success, this method enables firms to focus on target countries, maximize returns, and global expansion with data, backed by accuracy.
By factoring in the projected importer demand gap that is currently unmet and could be potential opportunity, it identifies the potential for the Exporter (Country) among 190 countries, against the general trade analysis, which identifies the biggest importer or exporter.
To discover high-growth global markets and optimize your business strategy:
Click Here
Pricing
- Single User License$ 1,995
- Department License$ 2,400
- Site License$ 3,120
- Global License$ 3,795

Leadership Perspectives from Industry Events
Search
Thought Leadership and Analyst Meet


Our Clients
6WResearch In News
- India Export Attractiveness Tracker 2026
- India Air Conditioner Market Set for Strong Rebound in 2026 After Weather-Led Correction and GST-Driven Recovery: 6Wresearch
- ADAS in India: How Automatic Emergency Braking, Blind Spot Detection & Driver Monitoring are Transforming Road Safety
- Doha a strategic location for EV manufacturing hub: IPA Qatar
- Demand for luxury TVs surging in the GCC, says Samsung
- Empowering Growth: The Thriving Journey of Bangladesh’s Cable Industry
Latest Reports
- Nicaragua RPG Gaming Market (2026-2032)
- New Zealand RPG Gaming Market (2026-2032)
- Netherlands RPG Gaming Market (2026-2032)
- Nauru RPG Gaming Market (2026-2032)
- Namibia RPG Gaming Market (2026-2032)
- Mozambique RPG Gaming Market (2026-2032)
- Montenegro RPG Gaming Market (2026-2032)
- Mongolia RPG Gaming Market (2026-2032)
- Monaco RPG Gaming Market (2026-2032)
- Micronesia RPG Gaming Market (2026-2032)
Industry Events and Analyst Meet

EV India Expo 2026

HIMTEX 2026

India Refining Summit 2026

India EV Show 2026

EV tech India Expo 2026
Whitepaper
- Middle East & Africa Commercial Security Market Click here to view more.
- Middle East & Africa Fire Safety Systems & Equipment Market Click here to view more.
- GCC Drone Market Click here to view more.
- Middle East Lighting Fixture Market Click here to view more.
- GCC Physical & Perimeter Security Market Click here to view more.