Croatia Billiard Cues Market (2026-2032) | Revenue, Analysis, Size, Companies, Share, Value, Trends, Outlook, Industry, Segmentation, Growth & Forecast
Market Forecast By Type (Snooker Cue, Nine Ball Cue, Others), By Applications (Club, Race, Family, Others) And Competitive Landscape
| Product Code: ETC5031678 | Publication Date: Nov 2023 | Updated Date: Apr 2026 | Product Type: Market Research Report | |
| Publisher: 6Wresearch | Author: Shubham Padhi | No. of Pages: 60 | No. of Figures: 30 | No. of Tables: 5 |
Croatia Billiard Cues Market Size (2020-2030)
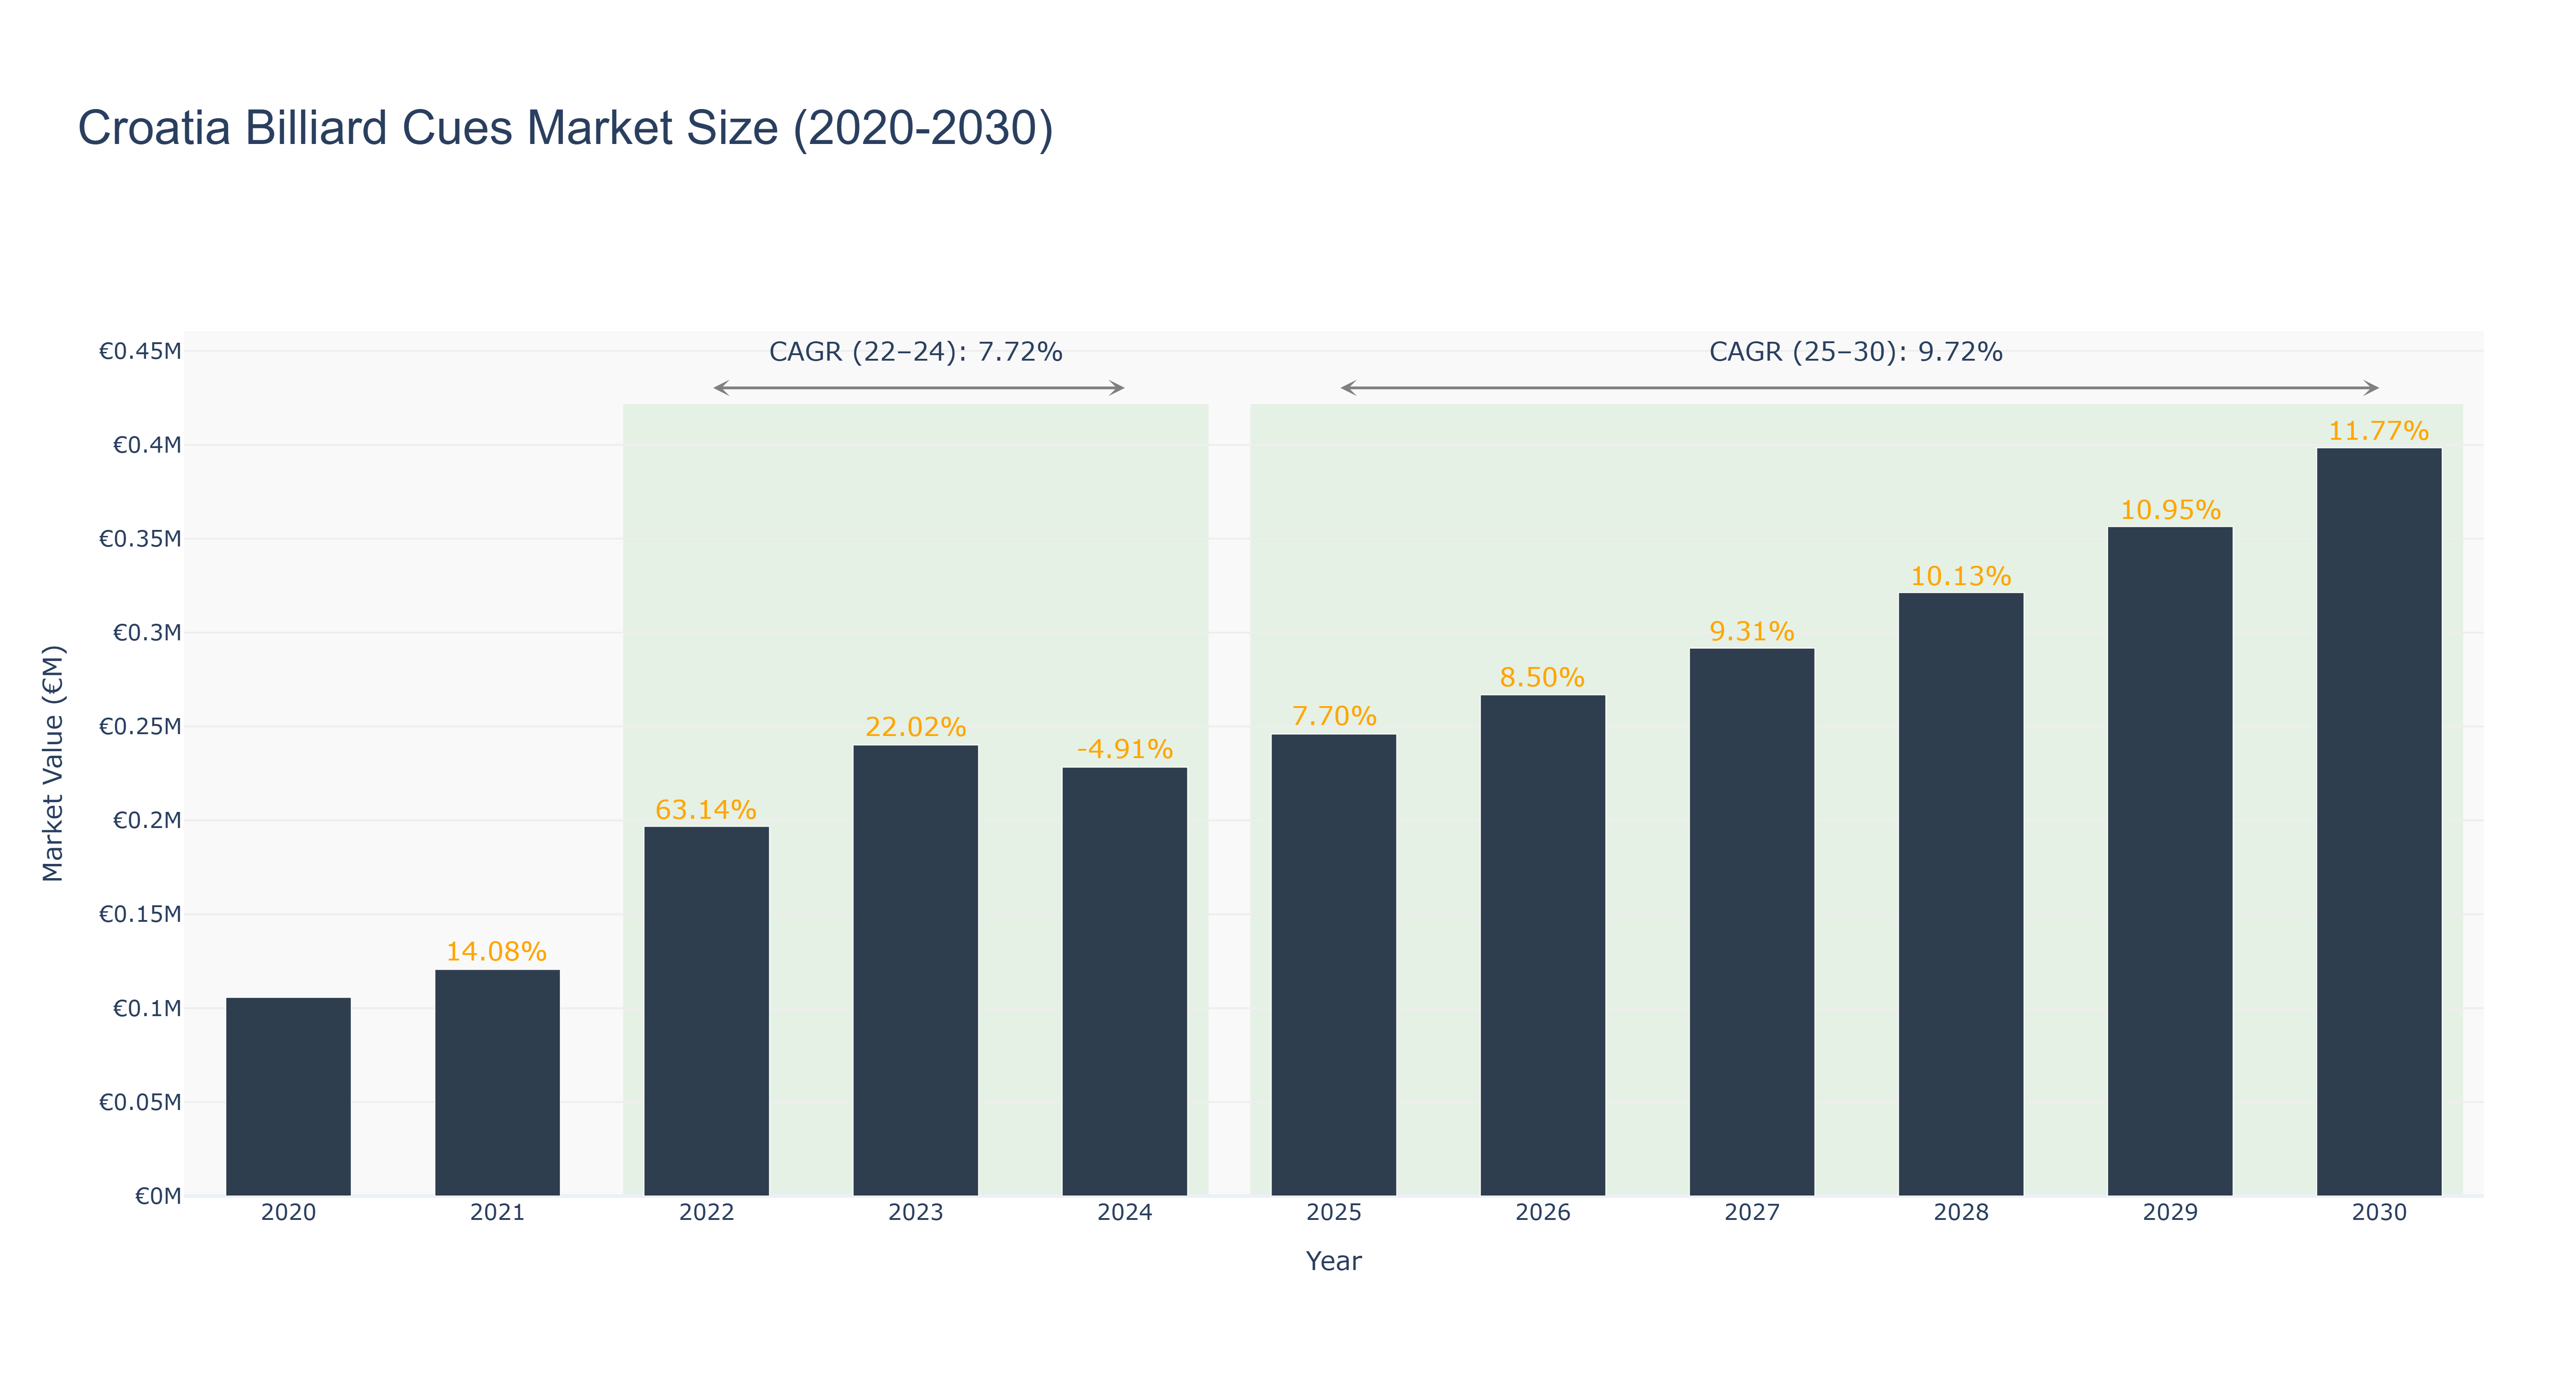
The Croatia Billiard Cues Market experienced significant fluctuations from 2020 to 2024, peaking at €240.16 thousand in 2023 before declining to €228.37 thousand in 2024, resulting in a compound annual growth rate (CAGR) of 7.72% for the actual period from 2022 to 2024. This volatility can be attributed to the resurgence of recreational activities post-pandemic and shifting consumer preferences, which saw a substantial growth of 63.14% in 2022. Looking ahead, the forecasted market size is projected to grow steadily from €245.96 thousand in 2025 to €398.41 thousand by 2030, with an anticipated CAGR of 9.72%. Continued investment in leisure facilities and the growing popularity of billiards among younger demographics are expected to drive this growth. Overall, the Croatia Billiard Cues Market is poised for a robust recovery and expansion in the coming years, benefiting from both leisure trends and enhanced consumer engagement in cue sports.
Croatia Billiard Cues Market: Production & Trade Performance (2019-2025)
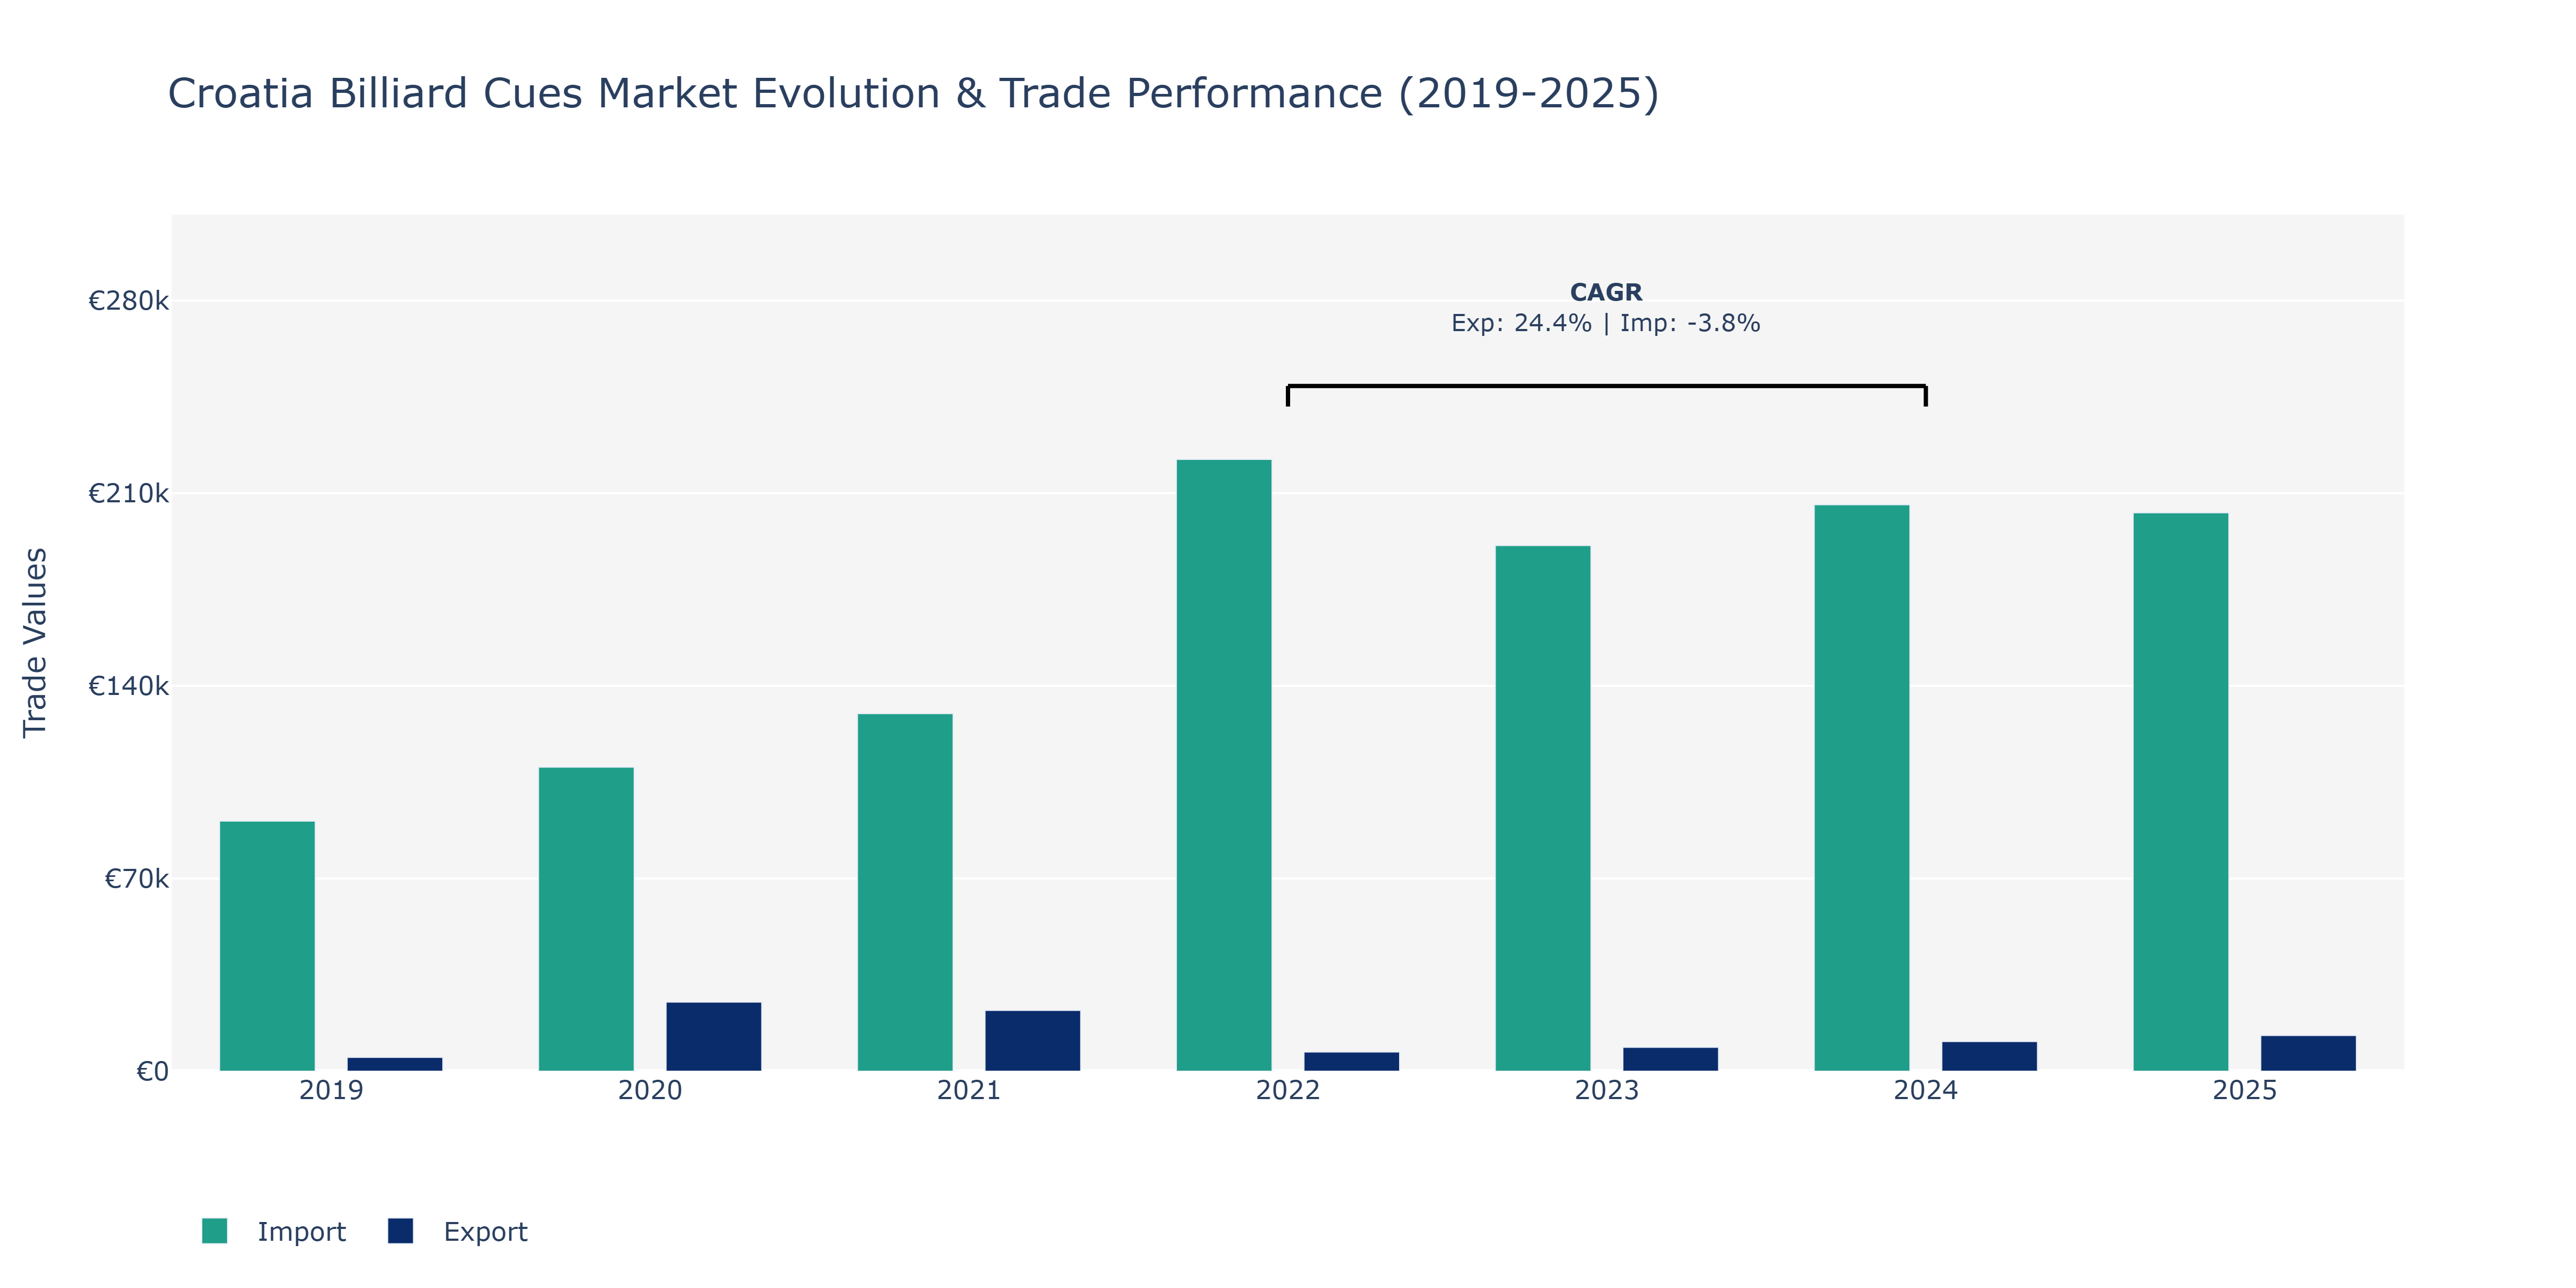
In the Croatia Billiard Cues Market, exports and imports exhibited notable fluctuations during the specified years. In 2019, exports stood at €5.0 thousand and witnessed a significant surge to €25.1 thousand in 2020. The following years saw a decrease, with exports declining to €7.0 thousand in 2022 before rising again to €12.97 thousand in 2025. Conversely, imports experienced an upward trajectory, starting at €90.88 thousand in 2019 and peaking at €222.29 thousand in 2022, before slightly decreasing to €202.89 thousand in 2025. The market's strong performance in exports during 2020 could be attributed to increased global demand for billiard cues, possibly fueled by a growing interest in recreational activities during the pandemic. Meanwhile, the fluctuations in imports could be influenced by shifts in trade agreements, currency exchange rates, and domestic consumption patterns impacting Croatia's imports of billiard cues components.
Key Highlights of the Report:
- Croatia Billiard Cues Market Outlook
- Market Size of Croatia Billiard Cues Market, 2025
- Forecast of Croatia Billiard Cues Market, 2032
- Historical Data and Forecast of Croatia Billiard Cues Revenues & Volume for the Period 2022 - 2032F
- Croatia Billiard Cues Market Trend Evolution
- Croatia Billiard Cues Market Drivers and Challenges
- Croatia Billiard Cues Price Trends
- Croatia Billiard Cues Porter`s Five Forces
- Croatia Billiard Cues Industry Life Cycle
- Historical Data and Forecast of Croatia Billiard Cues Market Revenues & Volume By Type for the Period 2022 - 2032F
- Historical Data and Forecast of Croatia Billiard Cues Market Revenues & Volume By Snooker Cue for the Period 2022 - 2032F
- Historical Data and Forecast of Croatia Billiard Cues Market Revenues & Volume By Nine Ball Cue for the Period 2022 - 2032F
- Historical Data and Forecast of Croatia Billiard Cues Market Revenues & Volume By Others for the Period 2022 - 2032F
- Historical Data and Forecast of Croatia Billiard Cues Market Revenues & Volume By Applications for the Period 2022 - 2032F
- Historical Data and Forecast of Croatia Billiard Cues Market Revenues & Volume By Club for the Period 2022 - 2032F
- Historical Data and Forecast of Croatia Billiard Cues Market Revenues & Volume By Race for the Period 2022 - 2032F
- Historical Data and Forecast of Croatia Billiard Cues Market Revenues & Volume By Family for the Period 2022 - 2032F
- Historical Data and Forecast of Croatia Billiard Cues Market Revenues & Volume By Others for the Period 2022 - 2032F
- Croatia Billiard Cues Import Export Trade Statistics
- Market Opportunity Assessment By Type
- Market Opportunity Assessment By Applications
- Croatia Billiard Cues Top Companies Market Share
- Croatia Billiard Cues Competitive Benchmarking By Technical and Operational Parameters
- Croatia Billiard Cues Company Profiles
- Croatia Billiard Cues Key Strategic Recommendations
Frequently Asked Questions About the Market Study (FAQs):
6Wresearch actively monitors the Croatia Billiard Cues Market and publishes its comprehensive annual report, highlighting emerging trends, growth drivers, revenue analysis, and forecast outlook. Our insights help businesses to make data-backed strategic decisions with ongoing market dynamics. Our analysts track relevent industries related to the Croatia Billiard Cues Market, allowing our clients with actionable intelligence and reliable forecasts tailored to emerging regional needs.
Yes, we provide customisation as per your requirements. To learn more, feel free to contact us on sales@6wresearch.com
1 Executive Summary |
2 Introduction |
2.1 Key Highlights of the Report |
2.2 Report Description |
2.3 Market Scope & Segmentation |
2.4 Research Methodology |
2.5 Assumptions |
3 Croatia Billiard Cues Market Overview |
3.1 Croatia Country Macro Economic Indicators |
3.2 Croatia Billiard Cues Market Revenues & Volume, 2022 & 2032F |
3.3 Croatia Billiard Cues Market - Industry Life Cycle |
3.4 Croatia Billiard Cues Market - Porter's Five Forces |
3.5 Croatia Billiard Cues Market Revenues & Volume Share, By Type, 2022 & 2032F |
3.6 Croatia Billiard Cues Market Revenues & Volume Share, By Applications, 2022 & 2032F |
4 Croatia Billiard Cues Market Dynamics |
4.1 Impact Analysis |
4.2 Market Drivers |
4.2.1 Growing popularity of billiards as a recreational activity in Croatia |
4.2.2 Increasing disposable income levels leading to higher spending on leisure activities |
4.2.3 Rise in number of billiard clubs and lounges in Croatia |
4.3 Market Restraints |
4.3.1 Competition from other recreational activities such as bowling, arcade games, etc. |
4.3.2 High cost associated with premium billiard cues impacting consumer purchasing decisions |
5 Croatia Billiard Cues Market Trends |
6 Croatia Billiard Cues Market Segmentations |
6.1 Croatia Billiard Cues Market, By Type |
6.1.1 Overview and Analysis |
6.1.2 Croatia Billiard Cues Market Revenues & Volume, By Snooker Cue, 2022 - 2032F |
6.1.3 Croatia Billiard Cues Market Revenues & Volume, By Nine Ball Cue, 2022 - 2032F |
6.1.4 Croatia Billiard Cues Market Revenues & Volume, By Others, 2022 - 2032F |
6.2 Croatia Billiard Cues Market, By Applications |
6.2.1 Overview and Analysis |
6.2.2 Croatia Billiard Cues Market Revenues & Volume, By Club, 2022 - 2032F |
6.2.3 Croatia Billiard Cues Market Revenues & Volume, By Race, 2022 - 2032F |
6.2.4 Croatia Billiard Cues Market Revenues & Volume, By Family, 2022 - 2032F |
6.2.5 Croatia Billiard Cues Market Revenues & Volume, By Others, 2022 - 2032F |
7 Croatia Billiard Cues Market Import-Export Trade Statistics |
7.1 Croatia Billiard Cues Market Export to Major Countries |
7.2 Croatia Billiard Cues Market Imports from Major Countries |
8 Croatia Billiard Cues Market Key Performance Indicators |
8.1 Number of new billiard clubs opening in Croatia |
8.2 Average spending per customer on billiard cues in Croatia |
8.3 Percentage of billiard cue manufacturers introducing innovative product designs |
8.4 Participation rate in billiard tournaments and events in Croatia |
8.5 Customer satisfaction levels with billiard cue quality and performance |
9 Croatia Billiard Cues Market - Opportunity Assessment |
9.1 Croatia Billiard Cues Market Opportunity Assessment, By Type, 2022 & 2032F |
9.2 Croatia Billiard Cues Market Opportunity Assessment, By Applications, 2022 & 2032F |
10 Croatia Billiard Cues Market - Competitive Landscape |
10.1 Croatia Billiard Cues Market Revenue Share, By Companies, 2025 |
10.2 Croatia Billiard Cues Market Competitive Benchmarking, By Operating and Technical Parameters |
11 Company Profiles |
12 Recommendations | 13 Disclaimer |
Global Go To Market Strategy - 2030
Export potential enables firms to identify high-growth global markets with greater confidence by combining advanced trade intelligence with a structured quantitative methodology. The framework analyzes emerging demand trends and country-level import patterns while integrating macroeconomic and trade datasets such as GDP and population forecasts, bilateral import–export flows, tariff structures, elasticity differentials between developed and developing economies, geographic distance, and import demand projections. Using weighted trade values from 2020–2024 as the base period to project country-to-country export potential for 2030, these inputs are operationalized through calculated drivers such as gravity model parameters, tariff impact factors, and projected GDP per-capita growth. Through an analysis of hidden potentials, demand hotspots, and market conditions that are most favorable to success, this method enables firms to focus on target countries, maximize returns, and global expansion with data, backed by accuracy.
By factoring in the projected importer demand gap that is currently unmet and could be potential opportunity, it identifies the potential for the Exporter (Country) among 190 countries, against the general trade analysis, which identifies the biggest importer or exporter.
To discover high-growth global markets and optimize your business strategy:
Click Here
Pricing
- Single User License$ 1,995
- Department License$ 2,400
- Site License$ 3,120
- Global License$ 3,795

Leadership Perspectives from Industry Events
Search
Thought Leadership and Analyst Meet


Our Clients
6WResearch In News
- India Export Attractiveness Tracker 2026
- India Air Conditioner Market Set for Strong Rebound in 2026 After Weather-Led Correction and GST-Driven Recovery: 6Wresearch
- ADAS in India: How Automatic Emergency Braking, Blind Spot Detection & Driver Monitoring are Transforming Road Safety
- Doha a strategic location for EV manufacturing hub: IPA Qatar
- Demand for luxury TVs surging in the GCC, says Samsung
- Empowering Growth: The Thriving Journey of Bangladesh’s Cable Industry
Latest Reports
- Nicaragua RPG Gaming Market (2026-2032)
- New Zealand RPG Gaming Market (2026-2032)
- Netherlands RPG Gaming Market (2026-2032)
- Nauru RPG Gaming Market (2026-2032)
- Namibia RPG Gaming Market (2026-2032)
- Mozambique RPG Gaming Market (2026-2032)
- Montenegro RPG Gaming Market (2026-2032)
- Mongolia RPG Gaming Market (2026-2032)
- Monaco RPG Gaming Market (2026-2032)
- Micronesia RPG Gaming Market (2026-2032)
Industry Events and Analyst Meet

EV India Expo 2026

HIMTEX 2026

India Refining Summit 2026

India EV Show 2026

EV tech India Expo 2026
Whitepaper
- Middle East & Africa Commercial Security Market Click here to view more.
- Middle East & Africa Fire Safety Systems & Equipment Market Click here to view more.
- GCC Drone Market Click here to view more.
- Middle East Lighting Fixture Market Click here to view more.
- GCC Physical & Perimeter Security Market Click here to view more.