Croatia Braze Alloys Market (2026-2032) | Size & Revenue, Segmentation, Share, Growth, Companies, Forecast, Industry, Outlook, Value, Competitive Landscape, Analysis, Trends
Market Forecast By Base Metal (Primary, Secondary), By Process (Copper, Gold, Aluminum, Silver, Nickel, Others) And Competitive Landscape
| Product Code: ETC6846543 | Publication Date: Sep 2024 | Updated Date: Apr 2026 | Product Type: Market Research Report | |
| Publisher: 6Wresearch | Author: Sumit Sagar | No. of Pages: 75 | No. of Figures: 35 | No. of Tables: 20 |
Croatia Braze Alloys Market Size (2020-2030)
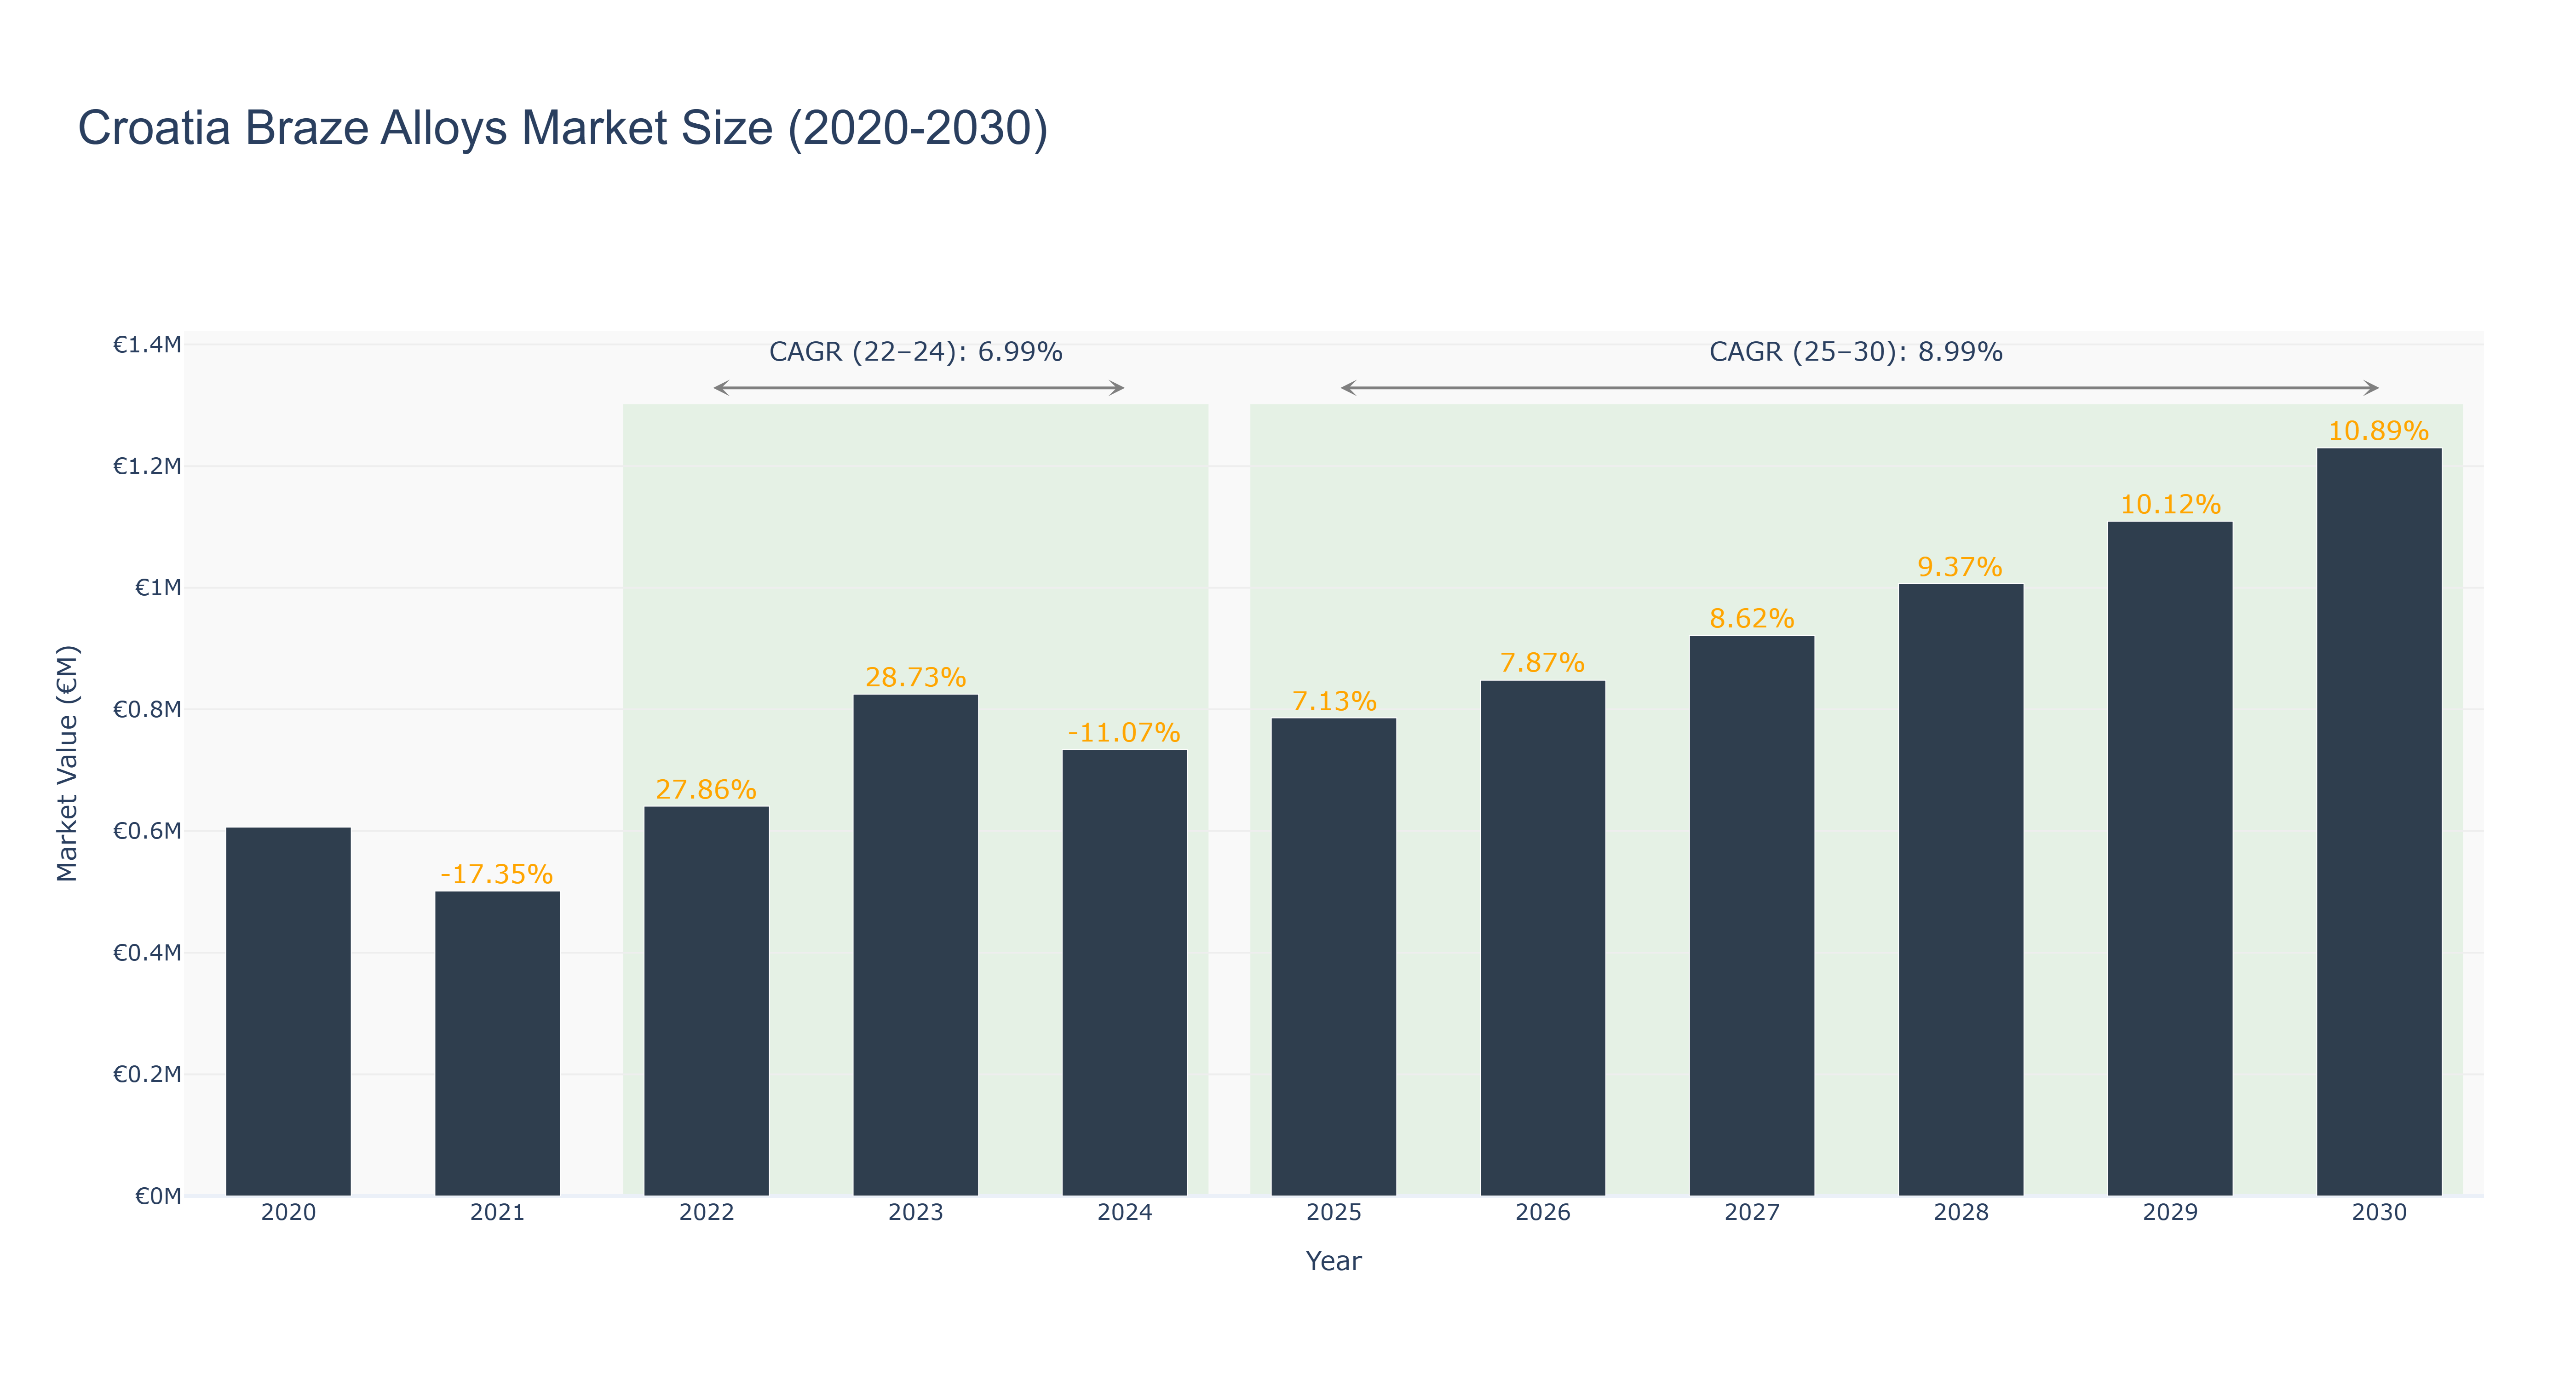
Croatia's Braze Alloys Market witnessed a peak market size of €1.23 million in 2030 with a steady growth trajectory. The market size declined from €0.61 million in 2020 to €0.73 million in 2024, attributed to economic fluctuations and market uncertainties during that period. However, from 2025 to 2030, the market is forecasted to grow significantly, reaching €1.23 million in 2030, showcasing a promising CAGR of 8.99%. The market's growth can be attributed to increasing demand for braze alloys in various industries and technological advancements driving innovation. Recent developments in Croatia's manufacturing sector, focusing on enhancing product quality and expanding market reach, are set to further boost the Braze Alloys Market in the coming years.
Croatia Braze Alloys Market: Production & Trade Performance (2019-2025)
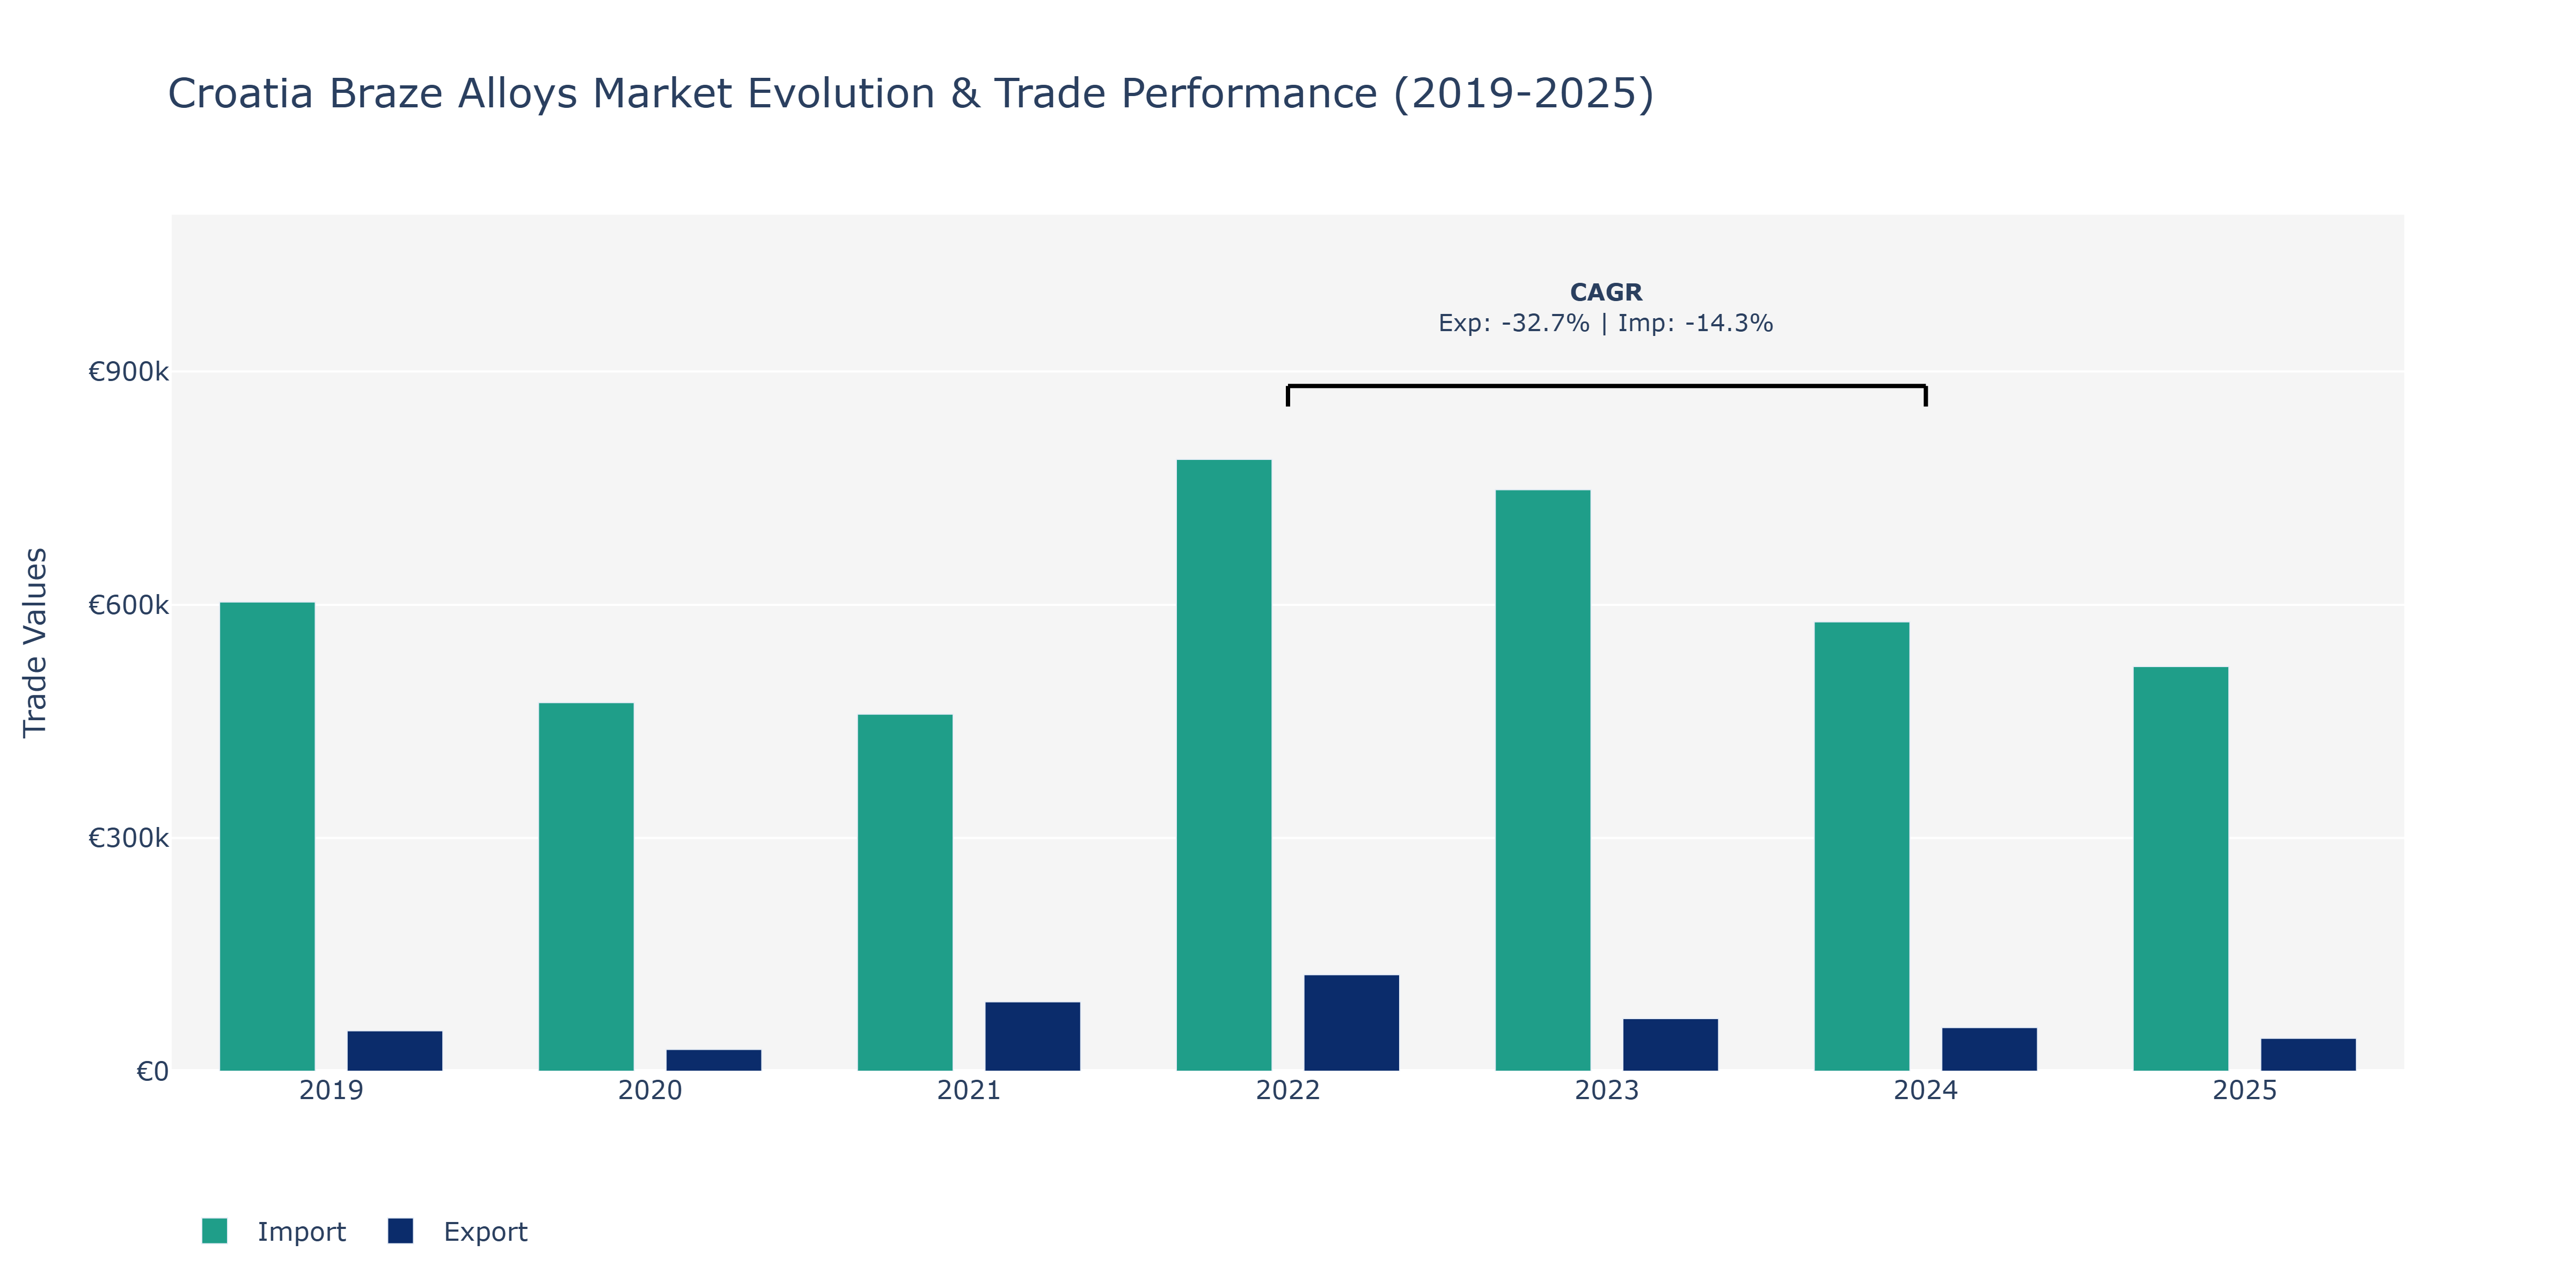
In the Croatia Braze Alloys Market, exports experienced a fluctuating trend over the years, starting at €52.01 thousand in 2019 and reaching a peak of €124.14 thousand in 2022 before declining to €42.21 thousand in 2025. This decline could be attributed to various factors such as changes in global demand, economic conditions, or shifts in market competitiveness. On the other hand, imports followed a similar pattern, with a peak of €786.99 thousand in 2022, a noticeable drop from the previous year's €903.55 thousand. The decline continued until 2025, with imports at €520.45 thousand. Such fluctuations could be influenced by raw material prices, international trade policies, or technological advancements affecting the market landscape. The observed trends highlight the market's sensitivity to external factors and the need for strategic planning to navigate uncertainties and maintain competitiveness.
Key Highlights of the Report:
- Croatia Braze Alloys Market Outlook
- Market Size of Croatia Braze Alloys Market, 2025
- Forecast of Croatia Braze Alloys Market, 2032
- Historical Data and Forecast of Croatia Braze Alloys Revenues & Volume for the Period 2022 - 2032
- Croatia Braze Alloys Market Trend Evolution
- Croatia Braze Alloys Market Drivers and Challenges
- Croatia Braze Alloys Price Trends
- Croatia Braze Alloys Porter's Five Forces
- Croatia Braze Alloys Industry Life Cycle
- Historical Data and Forecast of Croatia Braze Alloys Market Revenues & Volume By Base Metal for the Period 2022 - 2032
- Historical Data and Forecast of Croatia Braze Alloys Market Revenues & Volume By Primary for the Period 2022 - 2032
- Historical Data and Forecast of Croatia Braze Alloys Market Revenues & Volume By Secondary for the Period 2022 - 2032
- Historical Data and Forecast of Croatia Braze Alloys Market Revenues & Volume By Process for the Period 2022 - 2032
- Historical Data and Forecast of Croatia Braze Alloys Market Revenues & Volume By Copper for the Period 2022 - 2032
- Historical Data and Forecast of Croatia Braze Alloys Market Revenues & Volume By Gold for the Period 2022 - 2032
- Historical Data and Forecast of Croatia Braze Alloys Market Revenues & Volume By Aluminum for the Period 2022 - 2032
- Historical Data and Forecast of Croatia Braze Alloys Market Revenues & Volume By Silver for the Period 2022 - 2032
- Historical Data and Forecast of Croatia Braze Alloys Market Revenues & Volume By Nickel for the Period 2022 - 2032
- Historical Data and Forecast of Croatia Braze Alloys Market Revenues & Volume By Others for the Period 2022 - 2032
- Croatia Braze Alloys Import Export Trade Statistics
- Market Opportunity Assessment By Base Metal
- Market Opportunity Assessment By Process
- Croatia Braze Alloys Top Companies Market Share
- Croatia Braze Alloys Competitive Benchmarking By Technical and Operational Parameters
- Croatia Braze Alloys Company Profiles
- Croatia Braze Alloys Key Strategic Recommendations
Frequently Asked Questions About the Market Study (FAQs):
6Wresearch actively monitors the Croatia Braze Alloys Market and publishes its comprehensive annual report, highlighting emerging trends, growth drivers, revenue analysis, and forecast outlook. Our insights help businesses to make data-backed strategic decisions with ongoing market dynamics. Our analysts track relevent industries related to the Croatia Braze Alloys Market, allowing our clients with actionable intelligence and reliable forecasts tailored to emerging regional needs.
Yes, we provide customisation as per your requirements. To learn more, feel free to contact us on sales@6wresearch.com
1 Executive Summary |
2 Introduction |
2.1 Key Highlights of the Report |
2.2 Report Description |
2.3 Market Scope & Segmentation |
2.4 Research Methodology |
2.5 Assumptions |
3 Croatia Braze Alloys Market Overview |
3.1 Croatia Country Macro Economic Indicators |
3.2 Croatia Braze Alloys Market Revenues & Volume, 2022 & 2032F |
3.3 Croatia Braze Alloys Market - Industry Life Cycle |
3.4 Croatia Braze Alloys Market - Porter's Five Forces |
3.5 Croatia Braze Alloys Market Revenues & Volume Share, By Base Metal, 2022 & 2032F |
3.6 Croatia Braze Alloys Market Revenues & Volume Share, By Process, 2022 & 2032F |
4 Croatia Braze Alloys Market Dynamics |
4.1 Impact Analysis |
4.2 Market Drivers |
4.2.1 Increasing demand for brazing alloys in automotive and aerospace industries for manufacturing and repair applications. |
4.2.2 Growth in the HVAC (Heating, Ventilation, and Air Conditioning) sector, where brazing alloys are used extensively. |
4.2.3 Technological advancements leading to the development of new and improved brazing alloys with enhanced properties. |
4.3 Market Restraints |
4.3.1 Fluctuating raw material prices impacting the production cost of brazing alloys. |
4.3.2 Intense competition from substitute materials such as welding and soldering techniques. |
4.3.3 Stringent regulations and environmental concerns regarding the use of certain brazing alloy compositions. |
5 Croatia Braze Alloys Market Trends |
6 Croatia Braze Alloys Market, By Types |
6.1 Croatia Braze Alloys Market, By Base Metal |
6.1.1 Overview and Analysis |
6.1.2 Croatia Braze Alloys Market Revenues & Volume, By Base Metal, 2022 - 2032F |
6.1.3 Croatia Braze Alloys Market Revenues & Volume, By Primary, 2022 - 2032F |
6.1.4 Croatia Braze Alloys Market Revenues & Volume, By Secondary, 2022 - 2032F |
6.2 Croatia Braze Alloys Market, By Process |
6.2.1 Overview and Analysis |
6.2.2 Croatia Braze Alloys Market Revenues & Volume, By Copper, 2022 - 2032F |
6.2.3 Croatia Braze Alloys Market Revenues & Volume, By Gold, 2022 - 2032F |
6.2.4 Croatia Braze Alloys Market Revenues & Volume, By Aluminum, 2022 - 2032F |
6.2.5 Croatia Braze Alloys Market Revenues & Volume, By Silver, 2022 - 2032F |
6.2.6 Croatia Braze Alloys Market Revenues & Volume, By Nickel, 2022 - 2032F |
6.2.7 Croatia Braze Alloys Market Revenues & Volume, By Others, 2022 - 2032F |
7 Croatia Braze Alloys Market Import-Export Trade Statistics |
7.1 Croatia Braze Alloys Market Export to Major Countries |
7.2 Croatia Braze Alloys Market Imports from Major Countries |
8 Croatia Braze Alloys Market Key Performance Indicators |
8.1 Research and development investment in new brazing alloy formulations. |
8.2 Adoption rate of brazing alloys in emerging industries like renewable energy and electronics. |
8.3 Number of patents filed for innovative brazing alloy technologies. |
8.4 Percentage of brazing alloy waste recycled or disposed of sustainably. |
8.5 Customer satisfaction ratings and feedback on the performance of brazing alloy products. |
9 Croatia Braze Alloys Market - Opportunity Assessment |
9.1 Croatia Braze Alloys Market Opportunity Assessment, By Base Metal, 2022 & 2032F |
9.2 Croatia Braze Alloys Market Opportunity Assessment, By Process, 2022 & 2032F |
10 Croatia Braze Alloys Market - Competitive Landscape |
10.1 Croatia Braze Alloys Market Revenue Share, By Companies, 2025 |
10.2 Croatia Braze Alloys Market Competitive Benchmarking, By Operating and Technical Parameters |
11 Company Profiles |
12 Recommendations |
13 Disclaimer |
Global Go To Market Strategy - 2030
Export potential enables firms to identify high-growth global markets with greater confidence by combining advanced trade intelligence with a structured quantitative methodology. The framework analyzes emerging demand trends and country-level import patterns while integrating macroeconomic and trade datasets such as GDP and population forecasts, bilateral import–export flows, tariff structures, elasticity differentials between developed and developing economies, geographic distance, and import demand projections. Using weighted trade values from 2020–2024 as the base period to project country-to-country export potential for 2030, these inputs are operationalized through calculated drivers such as gravity model parameters, tariff impact factors, and projected GDP per-capita growth. Through an analysis of hidden potentials, demand hotspots, and market conditions that are most favorable to success, this method enables firms to focus on target countries, maximize returns, and global expansion with data, backed by accuracy.
By factoring in the projected importer demand gap that is currently unmet and could be potential opportunity, it identifies the potential for the Exporter (Country) among 190 countries, against the general trade analysis, which identifies the biggest importer or exporter.
To discover high-growth global markets and optimize your business strategy:
Click Here
Pricing
- Single User License$ 1,995
- Department License$ 2,400
- Site License$ 3,120
- Global License$ 3,795

Leadership Perspectives from Industry Events
Search
Thought Leadership and Analyst Meet


Our Clients
6WResearch In News
- India Export Attractiveness Tracker 2026
- India Air Conditioner Market Set for Strong Rebound in 2026 After Weather-Led Correction and GST-Driven Recovery: 6Wresearch
- ADAS in India: How Automatic Emergency Braking, Blind Spot Detection & Driver Monitoring are Transforming Road Safety
- Doha a strategic location for EV manufacturing hub: IPA Qatar
- Demand for luxury TVs surging in the GCC, says Samsung
- Empowering Growth: The Thriving Journey of Bangladesh’s Cable Industry
Latest Reports
- Nicaragua RPG Gaming Market (2026-2032)
- New Zealand RPG Gaming Market (2026-2032)
- Netherlands RPG Gaming Market (2026-2032)
- Nauru RPG Gaming Market (2026-2032)
- Namibia RPG Gaming Market (2026-2032)
- Mozambique RPG Gaming Market (2026-2032)
- Montenegro RPG Gaming Market (2026-2032)
- Mongolia RPG Gaming Market (2026-2032)
- Monaco RPG Gaming Market (2026-2032)
- Micronesia RPG Gaming Market (2026-2032)
Industry Events and Analyst Meet

EV India Expo 2026

HIMTEX 2026

India Refining Summit 2026

India EV Show 2026

EV tech India Expo 2026
Whitepaper
- Middle East & Africa Commercial Security Market Click here to view more.
- Middle East & Africa Fire Safety Systems & Equipment Market Click here to view more.
- GCC Drone Market Click here to view more.
- Middle East Lighting Fixture Market Click here to view more.
- GCC Physical & Perimeter Security Market Click here to view more.