Croatia Canned Sardines Market (2026-2032) | Analysis, Value, Outlook, Size, Trends, Share, Forecast, Industry, Companies, Segmentation, Growth & Revenue
Market Forecast By Processing (Oil, Sauce, Others), By Application (Households, Commercial), By Distribution Channel (Supermarkets and Hypermarkets, Convenience Stores, Specialty Stores, Online Sales Channel) And Competitive Landscape
| Product Code: ETC5170796 | Publication Date: Nov 2023 | Updated Date: Apr 2026 | Product Type: Market Research Report | |
| Publisher: 6Wresearch | Author: Shubham Padhi | No. of Pages: 60 | No. of Figures: 30 | No. of Tables: 5 |
Croatia Canned Sardines Market Size (2020-2030)
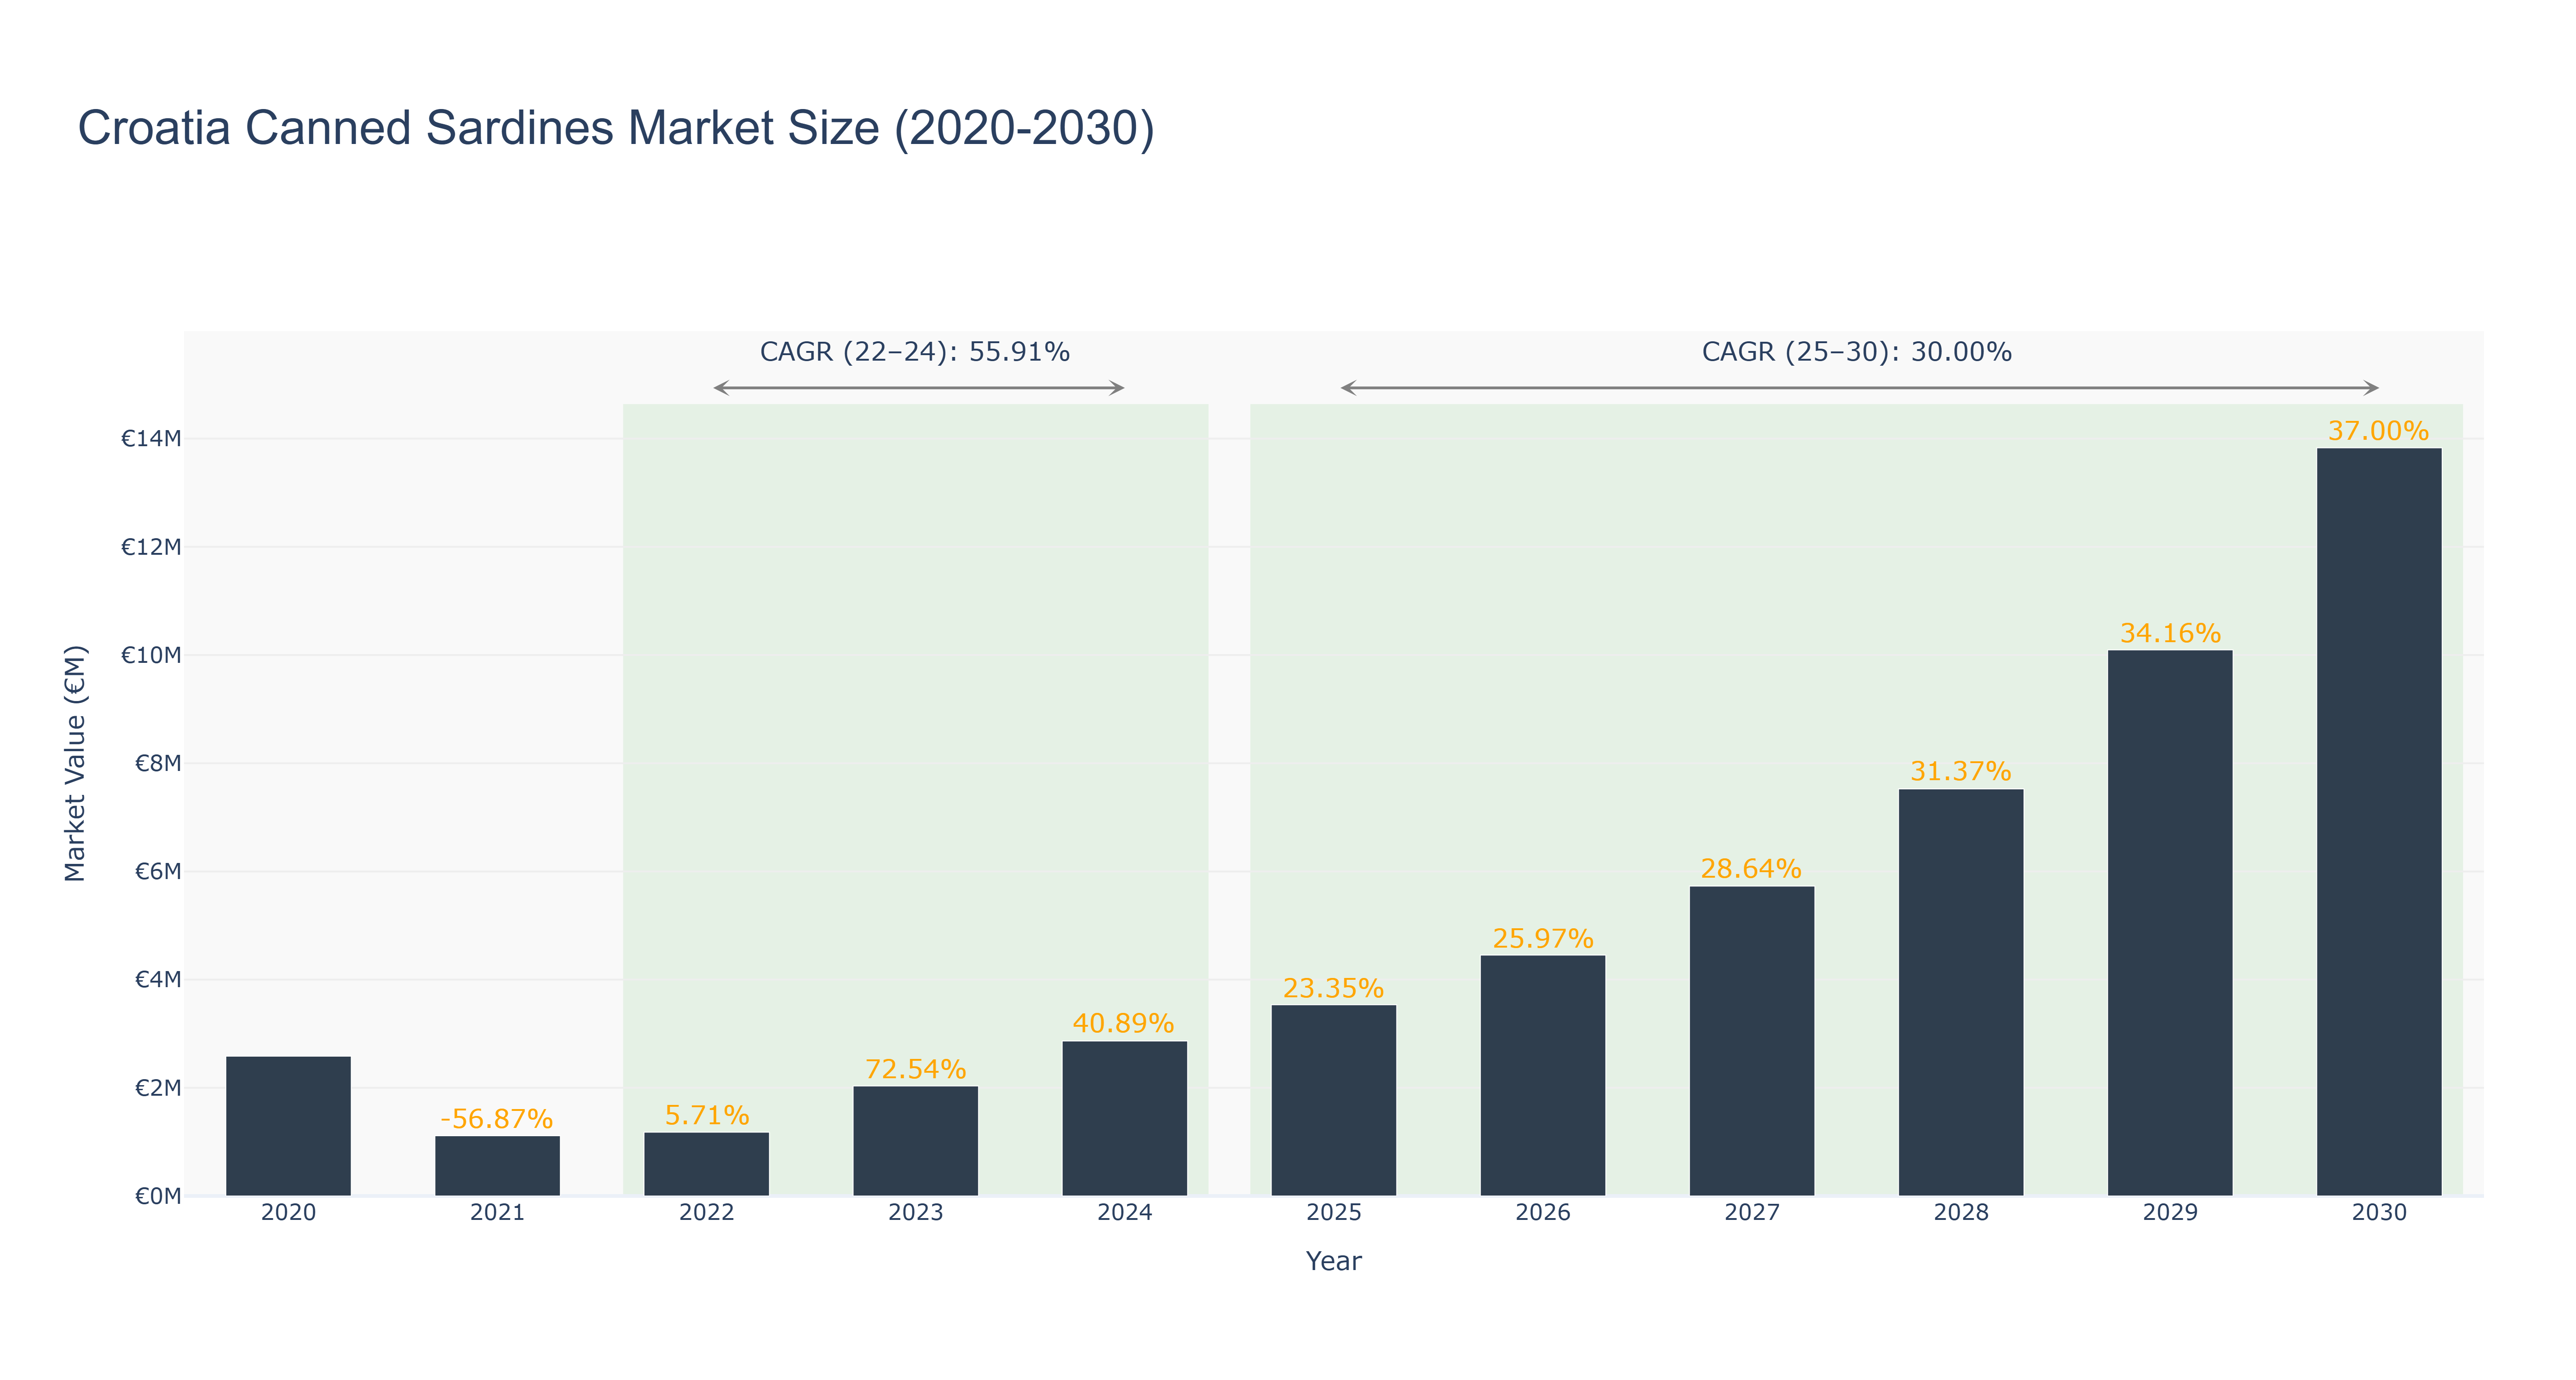
Croatia Canned Sardines Market has shown a fluctuating trend in recent years. The market peaked in 2030 with a size of €13.83 million, following a steady growth trajectory from 2020 to 2030. Notably, the market size experienced a significant decline from 2021 to 2021, which can be attributed to external factors impacting consumer preferences and economic conditions. The forecasted market size from 2025 to 2030 indicates a continued growth pattern, with a CAGR of 30.0% expected during this period. The CAGR (2022-24) of 55.91% reflects a period of rapid expansion, possibly driven by enhanced marketing strategies or product innovations. Looking ahead, recent developments in sustainable fishing practices and upcoming investments in modernizing sardine processing facilities are poised to further boost the market's growth in Croatia.
Croatia Canned Sardines Market: Production & Trade Performance (2019-2025)
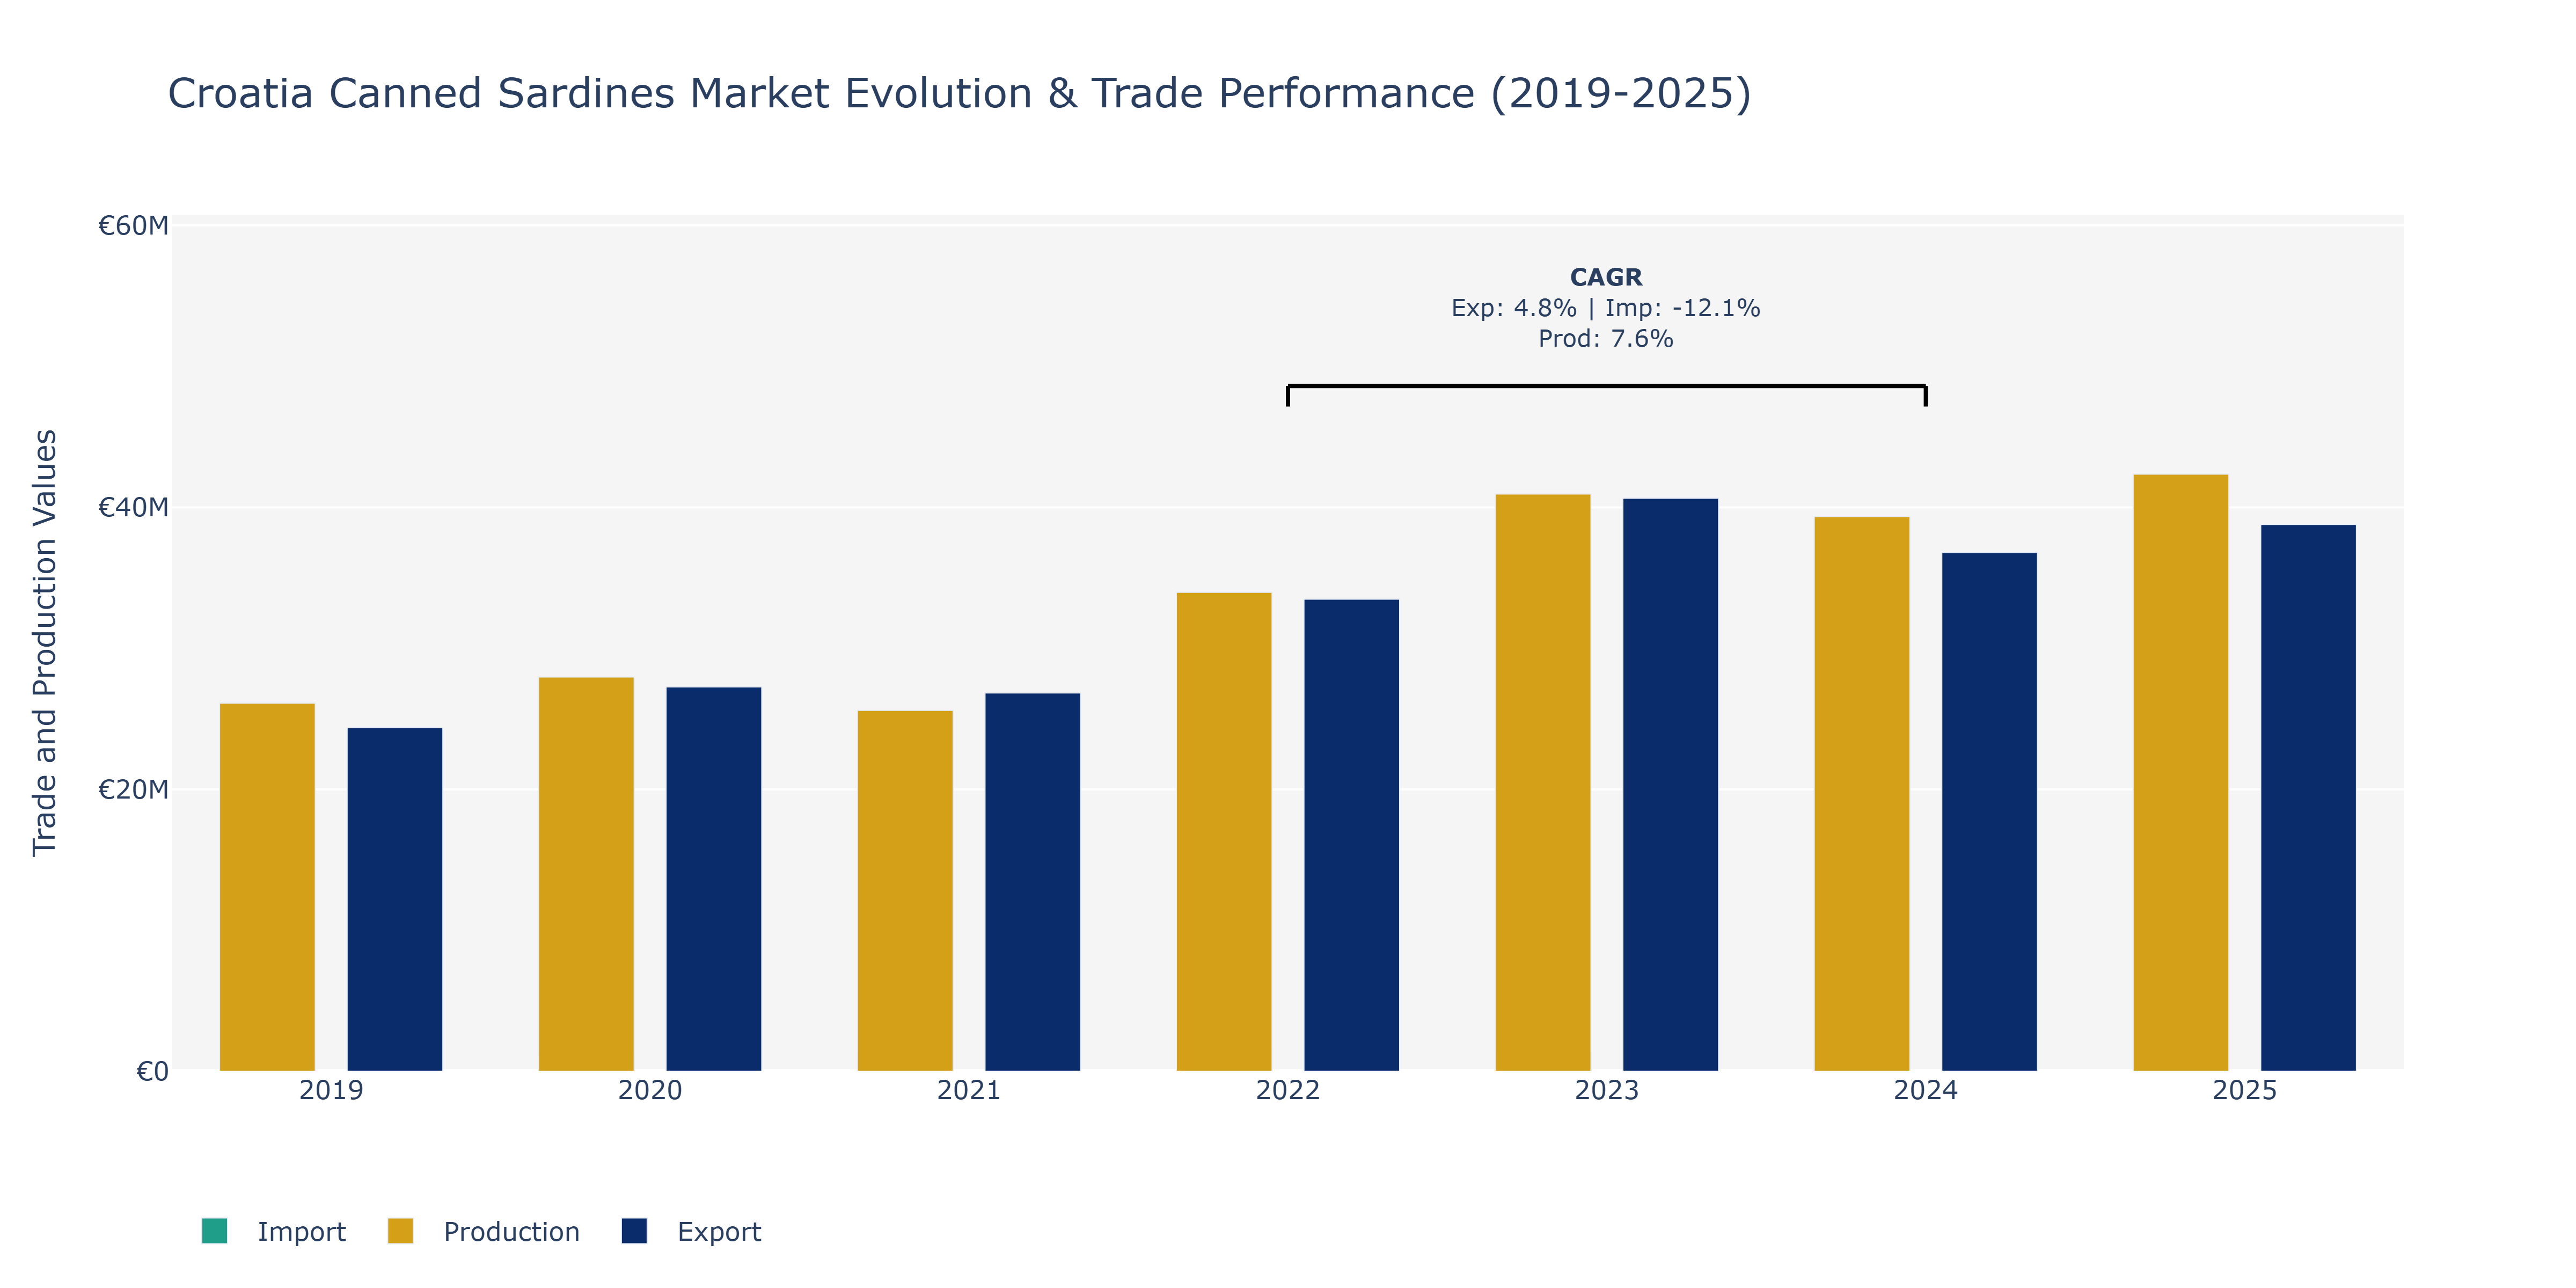
Between 2019 and 2025, Croatia's Canned Sardines Market saw fluctuations in exports, imports, and production. Exports grew steadily, from €24.37 million in 2019 to approximately €38.79 million in 2025, showcasing an upward trajectory with a peak in 2023. In contrast, imports fluctuated, reaching a low point in 2025 at around €1.05 billion after peaking in 2022. Production levels followed a similar trend to exports, peaking in 2025 at about €42.36 million. These fluctuations can be attributed to various factors, such as changing consumer preferences, global economic conditions affecting trade, and shifts in production capacities. The increase in production aligns with the rising demand for canned sardines due to their nutritional benefits and convenience, as consumers increasingly seek healthy and easy-to-prepare meal options. Additionally, export growth may have been driven by strategic market expansion initiatives and favorable trade agreements, while import fluctuations could be influenced by changes in sourcing strategies and price variations in international markets.
Key Highlights of the Report:
- Croatia Canned Sardines Market Outlook
- Market Size of Croatia Canned Sardines Market, 2025
- Forecast of Croatia Canned Sardines Market, 2032
- Historical Data and Forecast of Croatia Canned Sardines Revenues & Volume for the Period 2022 - 2032F
- Croatia Canned Sardines Market Trend Evolution
- Croatia Canned Sardines Market Drivers and Challenges
- Croatia Canned Sardines Price Trends
- Croatia Canned Sardines Porter`s Five Forces
- Croatia Canned Sardines Industry Life Cycle
- Historical Data and Forecast of Croatia Canned Sardines Market Revenues & Volume By Processing for the Period 2022 - 2032F
- Historical Data and Forecast of Croatia Canned Sardines Market Revenues & Volume By Oil for the Period 2022 - 2032F
- Historical Data and Forecast of Croatia Canned Sardines Market Revenues & Volume By Sauce for the Period 2022 - 2032F
- Historical Data and Forecast of Croatia Canned Sardines Market Revenues & Volume By Others for the Period 2022 - 2032F
- Historical Data and Forecast of Croatia Canned Sardines Market Revenues & Volume By Application for the Period 2022 - 2032F
- Historical Data and Forecast of Croatia Canned Sardines Market Revenues & Volume By Households for the Period 2022 - 2032F
- Historical Data and Forecast of Croatia Canned Sardines Market Revenues & Volume By Commercial for the Period 2022 - 2032F
- Historical Data and Forecast of Croatia Canned Sardines Market Revenues & Volume By Distribution Channel for the Period 2022 - 2032F
- Historical Data and Forecast of Croatia Canned Sardines Market Revenues & Volume By Supermarkets and Hypermarkets for the Period 2022 - 2032F
- Historical Data and Forecast of Croatia Canned Sardines Market Revenues & Volume By Convenience Stores for the Period 2022 - 2032F
- Historical Data and Forecast of Croatia Canned Sardines Market Revenues & Volume By Specialty Stores for the Period 2022 - 2032F
- Historical Data and Forecast of Croatia Canned Sardines Market Revenues & Volume By Online Sales Channel for the Period 2022 - 2032F
- Croatia Canned Sardines Import Export Trade Statistics
- Market Opportunity Assessment By Processing
- Market Opportunity Assessment By Application
- Market Opportunity Assessment By Distribution Channel
- Croatia Canned Sardines Top Companies Market Share
- Croatia Canned Sardines Competitive Benchmarking By Technical and Operational Parameters
- Croatia Canned Sardines Company Profiles
- Croatia Canned Sardines Key Strategic Recommendations
Frequently Asked Questions About the Market Study (FAQs):
6Wresearch actively monitors the Croatia Canned Sardines Market and publishes its comprehensive annual report, highlighting emerging trends, growth drivers, revenue analysis, and forecast outlook. Our insights help businesses to make data-backed strategic decisions with ongoing market dynamics. Our analysts track relevent industries related to the Croatia Canned Sardines Market, allowing our clients with actionable intelligence and reliable forecasts tailored to emerging regional needs.
Yes, we provide customisation as per your requirements. To learn more, feel free to contact us on sales@6wresearch.com
1 Executive Summary |
2 Introduction |
2.1 Key Highlights of the Report |
2.2 Report Description |
2.3 Market Scope & Segmentation |
2.4 Research Methodology |
2.5 Assumptions |
3 Croatia Canned Sardines Market Overview |
3.1 Croatia Country Macro Economic Indicators |
3.2 Croatia Canned Sardines Market Revenues & Volume, 2022 & 2032F |
3.3 Croatia Canned Sardines Market - Industry Life Cycle |
3.4 Croatia Canned Sardines Market - Porter's Five Forces |
3.5 Croatia Canned Sardines Market Revenues & Volume Share, By Processing, 2022 & 2032F |
3.6 Croatia Canned Sardines Market Revenues & Volume Share, By Application, 2022 & 2032F |
3.7 Croatia Canned Sardines Market Revenues & Volume Share, By Distribution Channel, 2022 & 2032F |
4 Croatia Canned Sardines Market Dynamics |
4.1 Impact Analysis |
4.2 Market Drivers |
4.2.1 Increasing awareness about the health benefits of consuming sardines |
4.2.2 Growing demand for convenient and ready-to-eat seafood products |
4.2.3 Rising popularity of Mediterranean cuisine in Croatia |
4.3 Market Restraints |
4.3.1 Seasonal fluctuations in sardine availability and pricing |
4.3.2 Competition from other canned seafood products in the market |
4.3.3 Consumer concerns about sustainability and overfishing practices |
5 Croatia Canned Sardines Market Trends |
6 Croatia Canned Sardines Market Segmentations |
6.1 Croatia Canned Sardines Market, By Processing |
6.1.1 Overview and Analysis |
6.1.2 Croatia Canned Sardines Market Revenues & Volume, By Oil, 2022 - 2032F |
6.1.3 Croatia Canned Sardines Market Revenues & Volume, By Sauce, 2022 - 2032F |
6.1.4 Croatia Canned Sardines Market Revenues & Volume, By Others, 2022 - 2032F |
6.2 Croatia Canned Sardines Market, By Application |
6.2.1 Overview and Analysis |
6.2.2 Croatia Canned Sardines Market Revenues & Volume, By Households, 2022 - 2032F |
6.2.3 Croatia Canned Sardines Market Revenues & Volume, By Commercial, 2022 - 2032F |
6.3 Croatia Canned Sardines Market, By Distribution Channel |
6.3.1 Overview and Analysis |
6.3.2 Croatia Canned Sardines Market Revenues & Volume, By Supermarkets and Hypermarkets, 2022 - 2032F |
6.3.3 Croatia Canned Sardines Market Revenues & Volume, By Convenience Stores, 2022 - 2032F |
6.3.4 Croatia Canned Sardines Market Revenues & Volume, By Specialty Stores, 2022 - 2032F |
6.3.5 Croatia Canned Sardines Market Revenues & Volume, By Online Sales Channel, 2022 - 2032F |
7 Croatia Canned Sardines Market Import-Export Trade Statistics |
7.1 Croatia Canned Sardines Market Export to Major Countries |
7.2 Croatia Canned Sardines Market Imports from Major Countries |
8 Croatia Canned Sardines Market Key Performance Indicators |
8.1 Percentage of households consuming canned sardines |
8.2 Number of new product launches in the canned seafood category |
8.3 Average consumer spending on canned sardines per capita |
9 Croatia Canned Sardines Market - Opportunity Assessment |
9.1 Croatia Canned Sardines Market Opportunity Assessment, By Processing, 2022 & 2032F |
9.2 Croatia Canned Sardines Market Opportunity Assessment, By Application, 2022 & 2032F |
9.3 Croatia Canned Sardines Market Opportunity Assessment, By Distribution Channel, 2022 & 2032F |
10 Croatia Canned Sardines Market - Competitive Landscape |
10.1 Croatia Canned Sardines Market Revenue Share, By Companies, 2025 |
10.2 Croatia Canned Sardines Market Competitive Benchmarking, By Operating and Technical Parameters |
11 Company Profiles |
12 Recommendations | 13 Disclaimer |
Global Go To Market Strategy - 2030
Export potential enables firms to identify high-growth global markets with greater confidence by combining advanced trade intelligence with a structured quantitative methodology. The framework analyzes emerging demand trends and country-level import patterns while integrating macroeconomic and trade datasets such as GDP and population forecasts, bilateral import–export flows, tariff structures, elasticity differentials between developed and developing economies, geographic distance, and import demand projections. Using weighted trade values from 2020–2024 as the base period to project country-to-country export potential for 2030, these inputs are operationalized through calculated drivers such as gravity model parameters, tariff impact factors, and projected GDP per-capita growth. Through an analysis of hidden potentials, demand hotspots, and market conditions that are most favorable to success, this method enables firms to focus on target countries, maximize returns, and global expansion with data, backed by accuracy.
By factoring in the projected importer demand gap that is currently unmet and could be potential opportunity, it identifies the potential for the Exporter (Country) among 190 countries, against the general trade analysis, which identifies the biggest importer or exporter.
To discover high-growth global markets and optimize your business strategy:
Click Here
Pricing
- Single User License$ 1,995
- Department License$ 2,400
- Site License$ 3,120
- Global License$ 3,795

Leadership Perspectives from Industry Events
Search
Thought Leadership and Analyst Meet


Our Clients
6WResearch In News
- India Export Attractiveness Tracker 2026
- India Air Conditioner Market Set for Strong Rebound in 2026 After Weather-Led Correction and GST-Driven Recovery: 6Wresearch
- ADAS in India: How Automatic Emergency Braking, Blind Spot Detection & Driver Monitoring are Transforming Road Safety
- Doha a strategic location for EV manufacturing hub: IPA Qatar
- Demand for luxury TVs surging in the GCC, says Samsung
- Empowering Growth: The Thriving Journey of Bangladesh’s Cable Industry
Latest Reports
- Nicaragua RPG Gaming Market (2026-2032)
- New Zealand RPG Gaming Market (2026-2032)
- Netherlands RPG Gaming Market (2026-2032)
- Nauru RPG Gaming Market (2026-2032)
- Namibia RPG Gaming Market (2026-2032)
- Mozambique RPG Gaming Market (2026-2032)
- Montenegro RPG Gaming Market (2026-2032)
- Mongolia RPG Gaming Market (2026-2032)
- Monaco RPG Gaming Market (2026-2032)
- Micronesia RPG Gaming Market (2026-2032)
Industry Events and Analyst Meet

EV India Expo 2026

HIMTEX 2026

India Refining Summit 2026

India EV Show 2026

EV tech India Expo 2026
Whitepaper
- Middle East & Africa Commercial Security Market Click here to view more.
- Middle East & Africa Fire Safety Systems & Equipment Market Click here to view more.
- GCC Drone Market Click here to view more.
- Middle East Lighting Fixture Market Click here to view more.
- GCC Physical & Perimeter Security Market Click here to view more.