Croatia Cheese Culture Market (2026-2032) | Analysis, Industry, Segmentation, Competitive Landscape, Forecast, Growth, Share, Outlook, Size & Revenue, Companies, Trends, Value
Market Forecast By Product (Cheddar, Continental, Pasta, Filata/Mozzarella, Cottage, Propionic, Soft, Grana), By Type (Mesophilic Culture, Thermophilic Culture, Starter Culture, Non Starter Culture, Probiotics), By Category (Fresh Cheese, Soft Cheese, Hard Cheese), By Cultures (Ripening, Protective Cultures, Kosher), By Application (Strains, Cultures Compounding), By Sales Channel (Specialty Store, Direct Store, Third Party Online, Other Sales Channel) And Competitive Landscape
| Product Code: ETC6847513 | Publication Date: Sep 2024 | Updated Date: Apr 2026 | Product Type: Market Research Report | |
| Publisher: 6Wresearch | Author: Sumit Sagar | No. of Pages: 75 | No. of Figures: 35 | No. of Tables: 20 |
Croatia Cheese Culture Market Size (2020-2030)
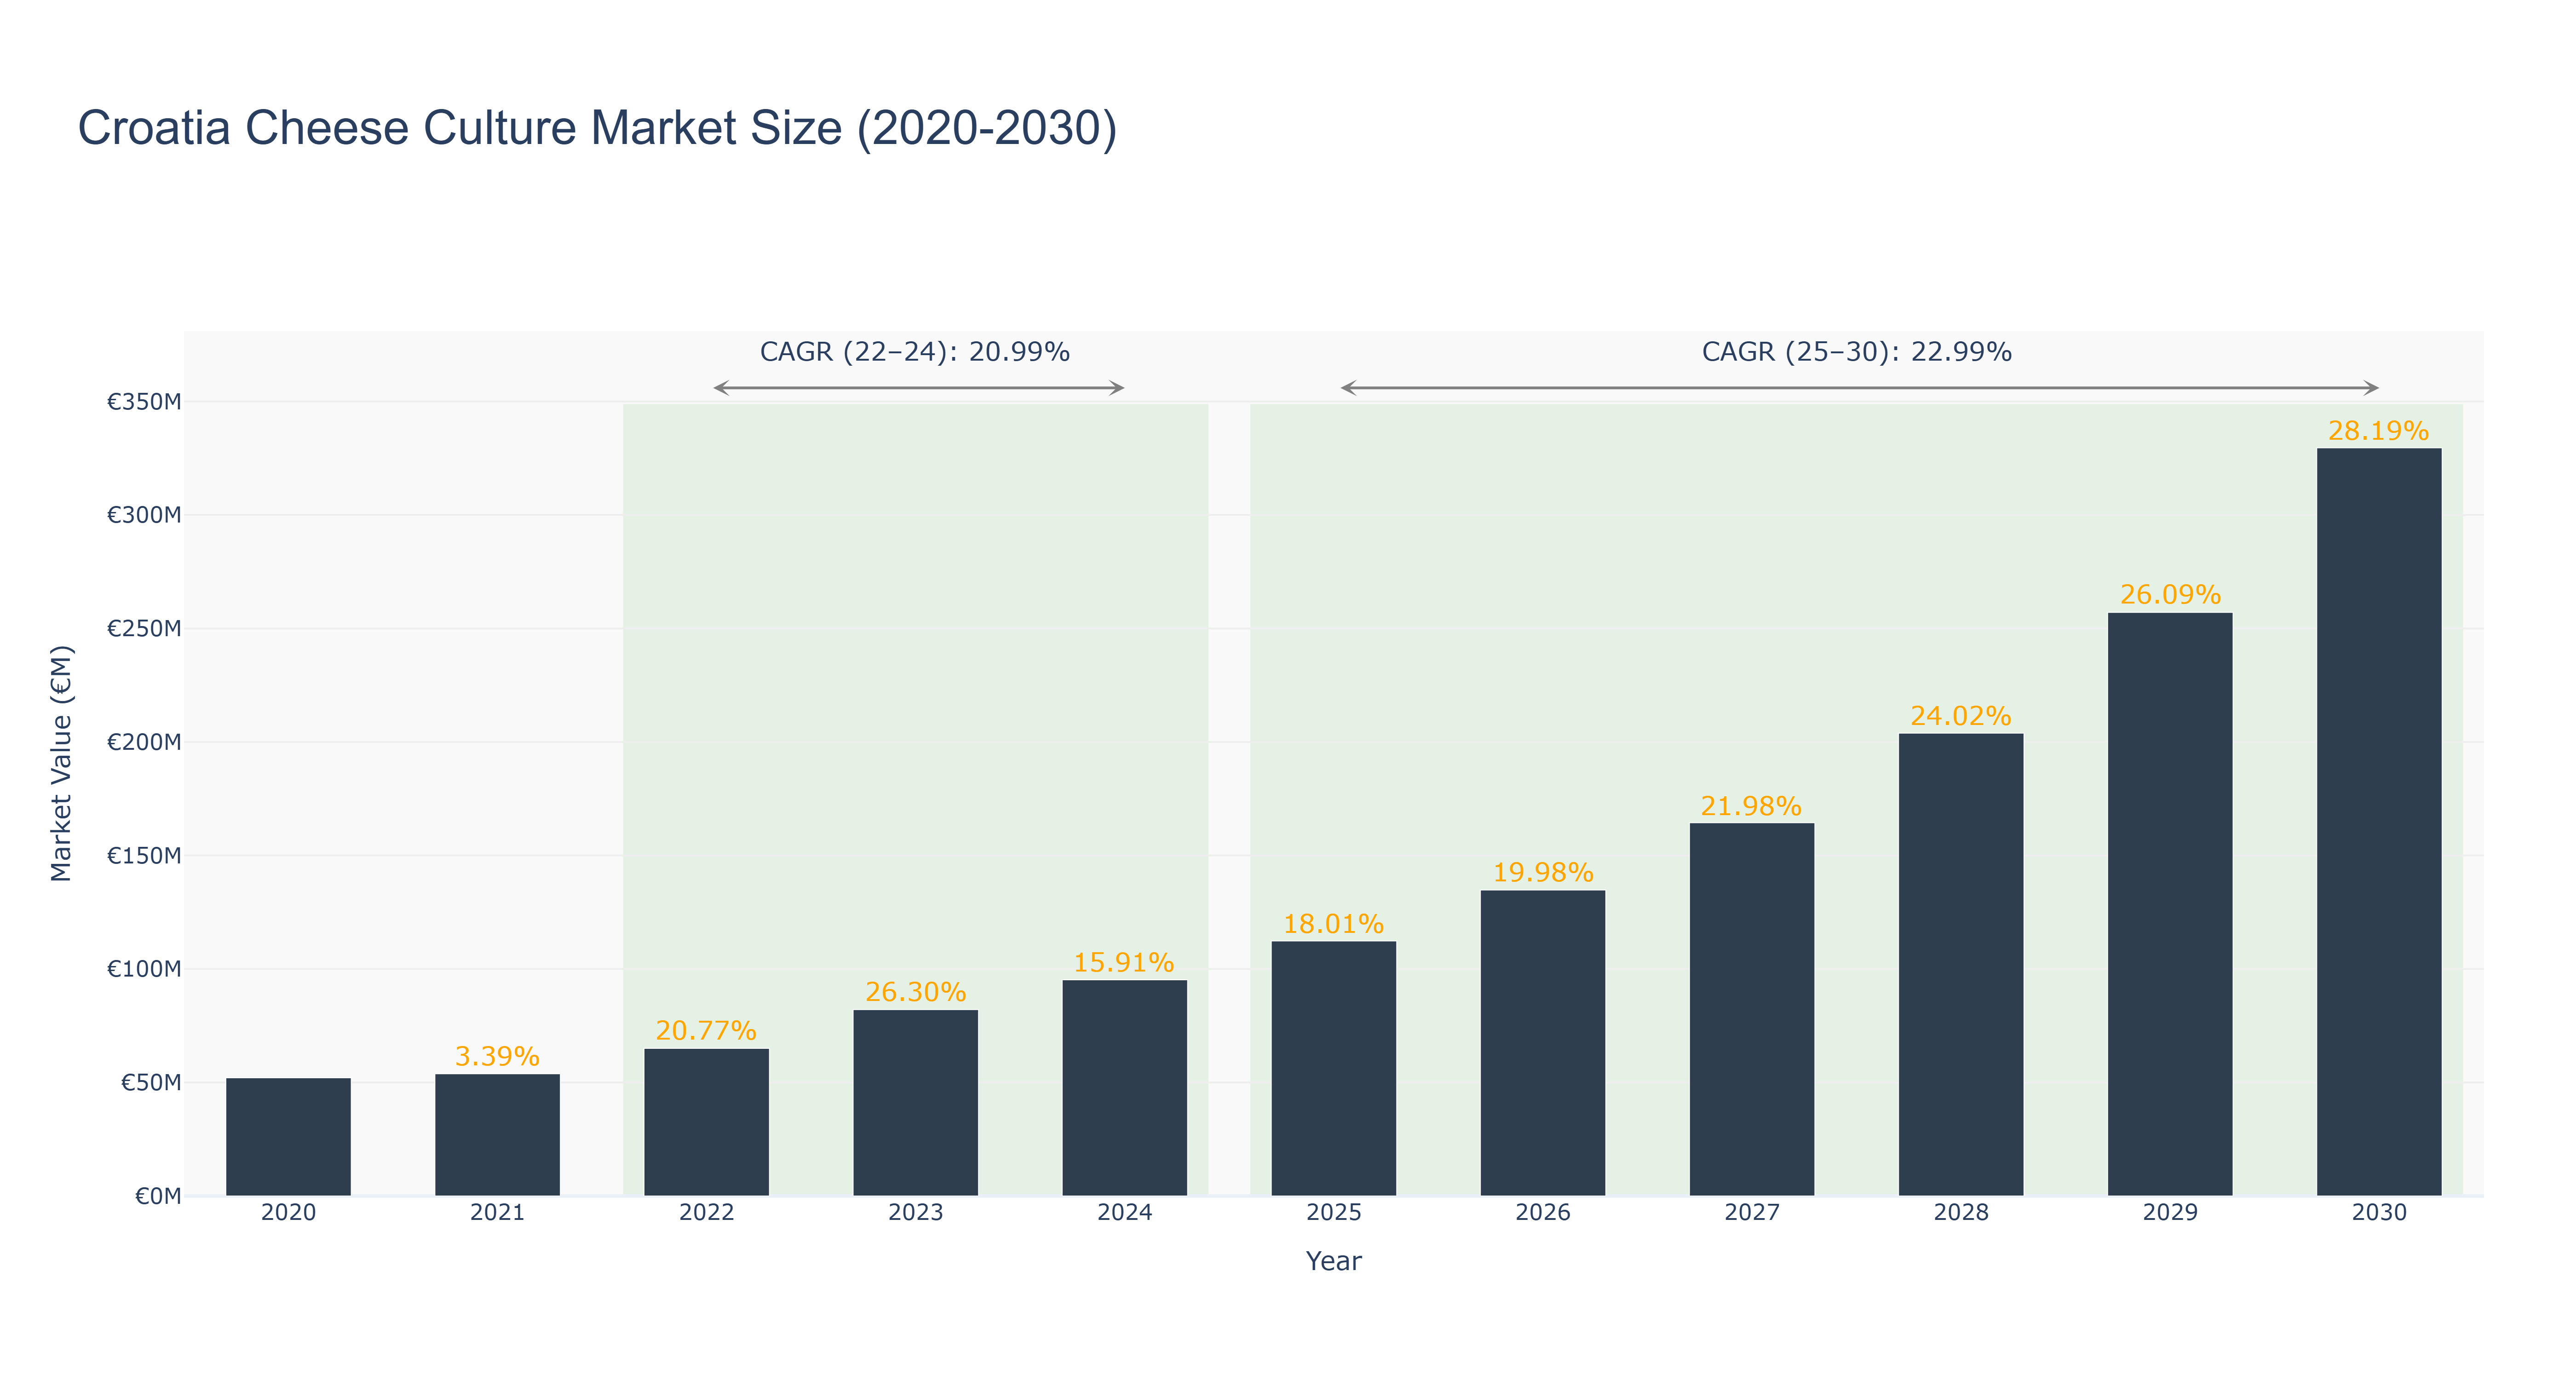
The Croatia Cheese Culture Market has demonstrated significant growth, peaking at a market size of €95.22 million in 2024, following a robust increase from €65.04 million in 2022 and €53.85 million in 2021. The actual period from 2022 to 2024 reflects a strong CAGR of 20.99%, driven by rising consumer preferences for artisanal and locally produced cheeses, alongside increased exports. Looking ahead, the forecasted period from 2025 to 2030 anticipates a market size reaching €329.61 million by 2030, supported by a projected CAGR of 22.99%. Key growth drivers include expanding food tourism, innovations in cheese production, and the ongoing trend towards health-conscious eating. This upward trajectory may also be bolstered by government initiatives aimed at promoting the dairy sector, further enhancing the market's potential in the coming years.
Croatia Cheese Culture Market: Production & Trade Performance (2019-2025)
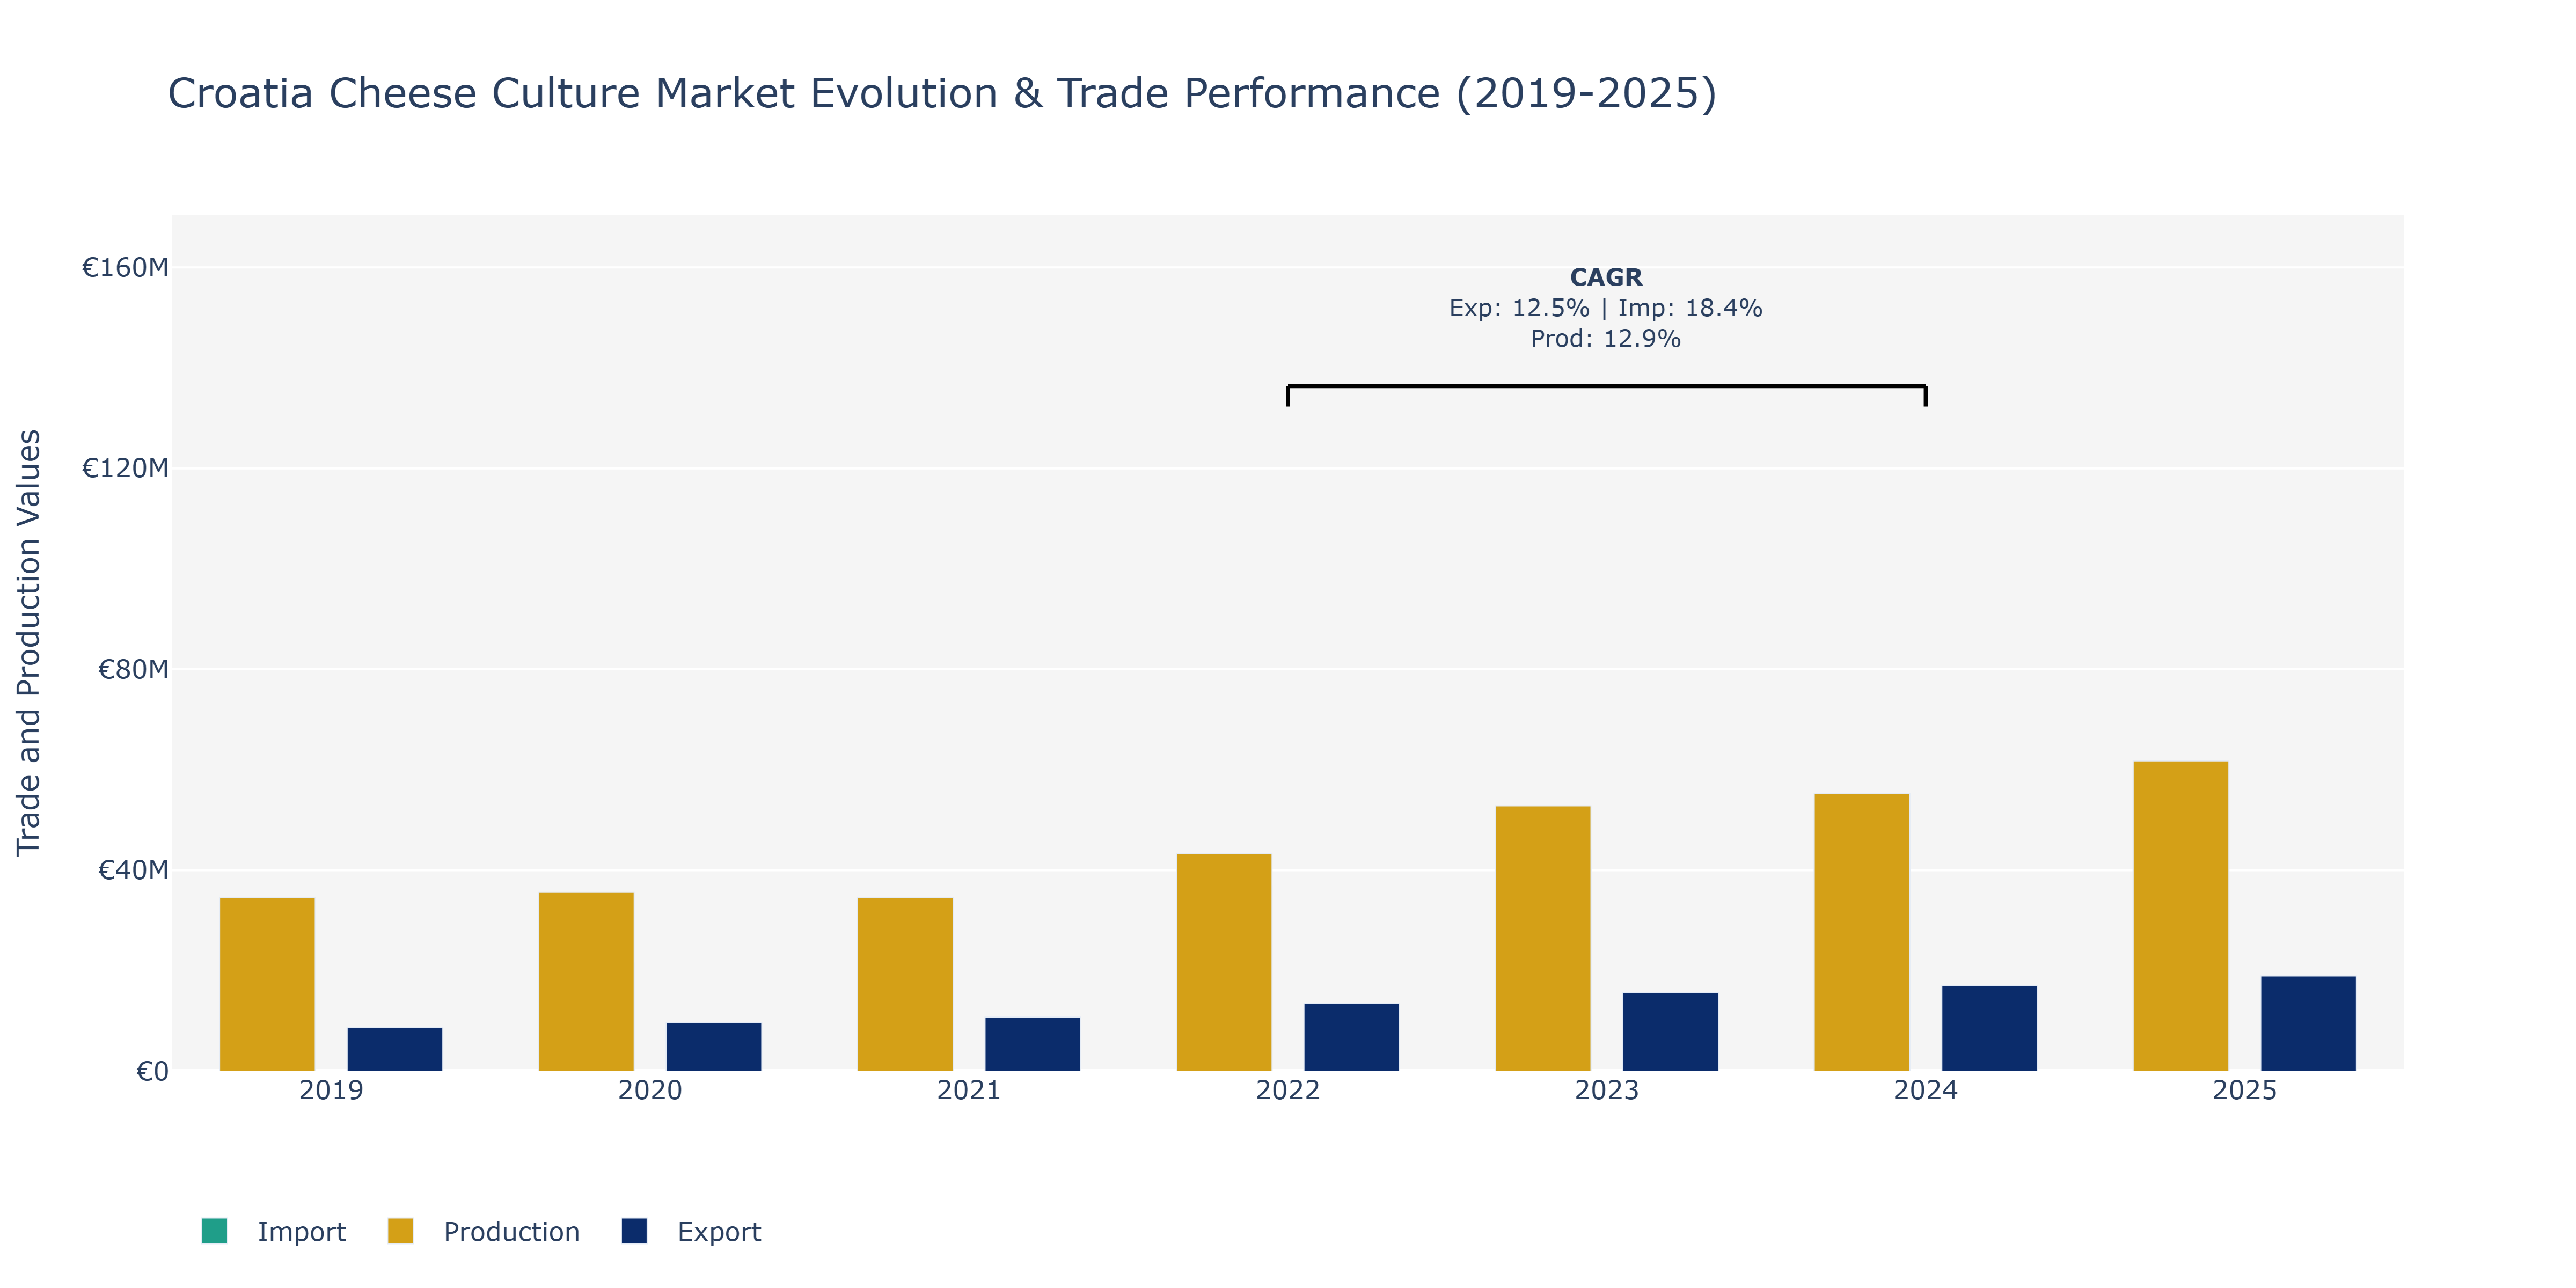
Between 2019 and 2025, Croatia's Cheese Culture Market saw noteworthy movements in Exports, Imports, and Production. Exports grew steadily from €8.71 million in 2019 to around €18.96 million in 2025, indicating a growing demand for Croatian cheese products globally. Imports followed a similar trend, rising from €22.04 million in 2019 to approximately €60.01 million in 2025, showing an increasing appetite for foreign cheese varieties within the country. Production levels fluctuated, reaching a peak of €61.77 billion in 2025 after a slight dip in 2021. These fluctuations in production could be attributed to factors such as changing consumer preferences, advancements in cheese-making technology, and market competition driving producers to enhance efficiency and product quality. The rising exports can be linked to Croatia's focus on promoting its unique cheese offerings in international markets and expanding its export networks. Similarly, the surge in imports may reflect the growing popularity of international cheese varieties among Croatian consumers, influenced by global culinary trends and a more diverse consumer base seeking new flavors.
Key Highlights of the Report:
- Croatia Cheese Culture Market Outlook
- Market Size of Croatia Cheese Culture Market, 2025
- Forecast of Croatia Cheese Culture Market, 2032
- Historical Data and Forecast of Croatia Cheese Culture Revenues & Volume for the Period 2022 - 2032
- Croatia Cheese Culture Market Trend Evolution
- Croatia Cheese Culture Market Drivers and Challenges
- Croatia Cheese Culture Price Trends
- Croatia Cheese Culture Porter's Five Forces
- Croatia Cheese Culture Industry Life Cycle
- Historical Data and Forecast of Croatia Cheese Culture Market Revenues & Volume By Product for the Period 2022 - 2032
- Historical Data and Forecast of Croatia Cheese Culture Market Revenues & Volume By Cheddar for the Period 2022 - 2032
- Historical Data and Forecast of Croatia Cheese Culture Market Revenues & Volume By Continental for the Period 2022 - 2032
- Historical Data and Forecast of Croatia Cheese Culture Market Revenues & Volume By Pasta for the Period 2022 - 2032
- Historical Data and Forecast of Croatia Cheese Culture Market Revenues & Volume By Filata/Mozzarella for the Period 2022 - 2032
- Historical Data and Forecast of Croatia Cheese Culture Market Revenues & Volume By Cottage for the Period 2022 - 2032
- Historical Data and Forecast of Croatia Cheese Culture Market Revenues & Volume By Propionic for the Period 2022 - 2032
- Historical Data and Forecast of Croatia Cheese Culture Market Revenues & Volume By Soft for the Period 2022 - 2032
- Historical Data and Forecast of Croatia Cheddar Cheese Culture Market Revenues & Volume By Grana for the Period 2022 - 2032
- Historical Data and Forecast of Croatia Cheese Culture Market Revenues & Volume By Type for the Period 2022 - 2032
- Historical Data and Forecast of Croatia Cheese Culture Market Revenues & Volume By Mesophilic Culture for the Period 2022 - 2032
- Historical Data and Forecast of Croatia Cheese Culture Market Revenues & Volume By Thermophilic Culture for the Period 2022 - 2032
- Historical Data and Forecast of Croatia Cheese Culture Market Revenues & Volume By Starter Culture for the Period 2022 - 2032
- Historical Data and Forecast of Croatia Cheese Culture Market Revenues & Volume By Non Starter Culture for the Period 2022 - 2032
- Historical Data and Forecast of Croatia Cheese Culture Market Revenues & Volume By Probiotics for the Period 2022 - 2032
- Historical Data and Forecast of Croatia Cheese Culture Market Revenues & Volume By Category for the Period 2022 - 2032
- Historical Data and Forecast of Croatia Cheese Culture Market Revenues & Volume By Fresh Cheese for the Period 2022 - 2032
- Historical Data and Forecast of Croatia Cheese Culture Market Revenues & Volume By Soft Cheese for the Period 2022 - 2032
- Historical Data and Forecast of Croatia Cheese Culture Market Revenues & Volume By Hard Cheese for the Period 2022 - 2032
- Historical Data and Forecast of Croatia Cheese Culture Market Revenues & Volume By Cultures for the Period 2022 - 2032
- Historical Data and Forecast of Croatia Cheese Culture Market Revenues & Volume By Ripening for the Period 2022 - 2032
- Historical Data and Forecast of Croatia Cheese Culture Market Revenues & Volume By Protective Cultures for the Period 2022 - 2032
- Historical Data and Forecast of Croatia Cheese Culture Market Revenues & Volume By Kosher for the Period 2022 - 2032
- Historical Data and Forecast of Croatia Cheese Culture Market Revenues & Volume By Application for the Period 2022 - 2032
- Historical Data and Forecast of Croatia Cheese Culture Market Revenues & Volume By Strains for the Period 2022 - 2032
- Historical Data and Forecast of Croatia Cheese Culture Market Revenues & Volume By Cultures Compounding for the Period 2022 - 2032
- Historical Data and Forecast of Croatia Cheese Culture Market Revenues & Volume By Sales Channel for the Period 2022 - 2032
- Historical Data and Forecast of Croatia Cheese Culture Market Revenues & Volume By Specialty Store for the Period 2022 - 2032
- Historical Data and Forecast of Croatia Cheese Culture Market Revenues & Volume By Direct Store for the Period 2022 - 2032
- Historical Data and Forecast of Croatia Cheese Culture Market Revenues & Volume By Third Party Online for the Period 2022 - 2032
- Historical Data and Forecast of Croatia Cheese Culture Market Revenues & Volume By Other Sales Channel for the Period 2022 - 2032
- Croatia Cheese Culture Import Export Trade Statistics
- Market Opportunity Assessment By Product
- Market Opportunity Assessment By Type
- Market Opportunity Assessment By Category
- Market Opportunity Assessment By Cultures
- Market Opportunity Assessment By Application
- Market Opportunity Assessment By Sales Channel
- Croatia Cheese Culture Top Companies Market Share
- Croatia Cheese Culture Competitive Benchmarking By Technical and Operational Parameters
- Croatia Cheese Culture Company Profiles
- Croatia Cheese Culture Key Strategic Recommendations
Frequently Asked Questions About the Market Study (FAQs):
6Wresearch actively monitors the Croatia Cheese Culture Market and publishes its comprehensive annual report, highlighting emerging trends, growth drivers, revenue analysis, and forecast outlook. Our insights help businesses to make data-backed strategic decisions with ongoing market dynamics. Our analysts track relevent industries related to the Croatia Cheese Culture Market, allowing our clients with actionable intelligence and reliable forecasts tailored to emerging regional needs.
Yes, we provide customisation as per your requirements. To learn more, feel free to contact us on sales@6wresearch.com
1 Executive Summary |
2 Introduction |
2.1 Key Highlights of the Report |
2.2 Report Description |
2.3 Market Scope & Segmentation |
2.4 Research Methodology |
2.5 Assumptions |
3 Croatia Cheese Culture Market Overview |
3.1 Croatia Country Macro Economic Indicators |
3.2 Croatia Cheese Culture Market Revenues & Volume, 2022 & 2032F |
3.3 Croatia Cheese Culture Market - Industry Life Cycle |
3.4 Croatia Cheese Culture Market - Porter's Five Forces |
3.5 Croatia Cheese Culture Market Revenues & Volume Share, By Product, 2022 & 2032F |
3.6 Croatia Cheese Culture Market Revenues & Volume Share, By Type, 2022 & 2032F |
3.7 Croatia Cheese Culture Market Revenues & Volume Share, By Category, 2022 & 2032F |
3.8 Croatia Cheese Culture Market Revenues & Volume Share, By Cultures, 2022 & 2032F |
3.9 Croatia Cheese Culture Market Revenues & Volume Share, By Application, 2022 & 2032F |
3.10 Croatia Cheese Culture Market Revenues & Volume Share, By Sales Channel, 2022 & 2032F |
4 Croatia Cheese Culture Market Dynamics |
4.1 Impact Analysis |
4.2 Market Drivers |
4.2.1 Increasing consumer awareness about the health benefits of cheese consumption |
4.2.2 Growing demand for artisanal and organic cheese products |
4.2.3 Rising popularity of cheese tastings and culinary experiences in Croatia |
4.3 Market Restraints |
4.3.1 Fluctuating milk prices impacting cheese production costs |
4.3.2 Competition from imported cheeses affecting local market share |
4.3.3 Seasonality of milk production leading to supply chain challenges for cheese production |
5 Croatia Cheese Culture Market Trends |
6 Croatia Cheese Culture Market, By Types |
6.1 Croatia Cheese Culture Market, By Product |
6.1.1 Overview and Analysis |
6.1.2 Croatia Cheese Culture Market Revenues & Volume, By Product, 2022 - 2032F |
6.1.3 Croatia Cheese Culture Market Revenues & Volume, By Cheddar, 2022 - 2032F |
6.1.4 Croatia Cheese Culture Market Revenues & Volume, By Continental, 2022 - 2032F |
6.1.5 Croatia Cheese Culture Market Revenues & Volume, By Pasta, 2022 - 2032F |
6.1.6 Croatia Cheese Culture Market Revenues & Volume, By Filata/Mozzarella, 2022 - 2032F |
6.1.7 Croatia Cheese Culture Market Revenues & Volume, By Cottage, 2022 - 2032F |
6.1.8 Croatia Cheese Culture Market Revenues & Volume, By Propionic, 2022 - 2032F |
6.1.9 Croatia Cheese Culture Market Revenues & Volume, By Grana, 2022 - 2032F |
6.1.10 Croatia Cheese Culture Market Revenues & Volume, By Grana, 2022 - 2032F |
6.2 Croatia Cheese Culture Market, By Type |
6.2.1 Overview and Analysis |
6.2.2 Croatia Cheese Culture Market Revenues & Volume, By Mesophilic Culture, 2022 - 2032F |
6.2.3 Croatia Cheese Culture Market Revenues & Volume, By Thermophilic Culture, 2022 - 2032F |
6.2.4 Croatia Cheese Culture Market Revenues & Volume, By Starter Culture, 2022 - 2032F |
6.2.5 Croatia Cheese Culture Market Revenues & Volume, By Non Starter Culture, 2022 - 2032F |
6.2.6 Croatia Cheese Culture Market Revenues & Volume, By Probiotics, 2022 - 2032F |
6.3 Croatia Cheese Culture Market, By Category |
6.3.1 Overview and Analysis |
6.3.2 Croatia Cheese Culture Market Revenues & Volume, By Fresh Cheese, 2022 - 2032F |
6.3.3 Croatia Cheese Culture Market Revenues & Volume, By Soft Cheese, 2022 - 2032F |
6.3.4 Croatia Cheese Culture Market Revenues & Volume, By Hard Cheese, 2022 - 2032F |
6.4 Croatia Cheese Culture Market, By Cultures |
6.4.1 Overview and Analysis |
6.4.2 Croatia Cheese Culture Market Revenues & Volume, By Ripening, 2022 - 2032F |
6.4.3 Croatia Cheese Culture Market Revenues & Volume, By Protective Cultures, 2022 - 2032F |
6.4.4 Croatia Cheese Culture Market Revenues & Volume, By Kosher, 2022 - 2032F |
6.5 Croatia Cheese Culture Market, By Application |
6.5.1 Overview and Analysis |
6.5.2 Croatia Cheese Culture Market Revenues & Volume, By Strains, 2022 - 2032F |
6.5.3 Croatia Cheese Culture Market Revenues & Volume, By Cultures Compounding, 2022 - 2032F |
6.6 Croatia Cheese Culture Market, By Sales Channel |
6.6.1 Overview and Analysis |
6.6.2 Croatia Cheese Culture Market Revenues & Volume, By Specialty Store, 2022 - 2032F |
6.6.3 Croatia Cheese Culture Market Revenues & Volume, By Direct Store, 2022 - 2032F |
6.6.4 Croatia Cheese Culture Market Revenues & Volume, By Third Party Online, 2022 - 2032F |
6.6.5 Croatia Cheese Culture Market Revenues & Volume, By Other Sales Channel, 2022 - 2032F |
7 Croatia Cheese Culture Market Import-Export Trade Statistics |
7.1 Croatia Cheese Culture Market Export to Major Countries |
7.2 Croatia Cheese Culture Market Imports from Major Countries |
8 Croatia Cheese Culture Market Key Performance Indicators |
8.1 Percentage growth in the number of cheese-related culinary events and festivals in Croatia |
8.2 Increase in the number of cheese producers obtaining organic certification |
8.3 Growth in the adoption of innovative packaging solutions for cheese products |
9 Croatia Cheese Culture Market - Opportunity Assessment |
9.1 Croatia Cheese Culture Market Opportunity Assessment, By Product, 2022 & 2032F |
9.2 Croatia Cheese Culture Market Opportunity Assessment, By Type, 2022 & 2032F |
9.3 Croatia Cheese Culture Market Opportunity Assessment, By Category, 2022 & 2032F |
9.4 Croatia Cheese Culture Market Opportunity Assessment, By Cultures, 2022 & 2032F |
9.5 Croatia Cheese Culture Market Opportunity Assessment, By Application, 2022 & 2032F |
9.6 Croatia Cheese Culture Market Opportunity Assessment, By Sales Channel, 2022 & 2032F |
10 Croatia Cheese Culture Market - Competitive Landscape |
10.1 Croatia Cheese Culture Market Revenue Share, By Companies, 2025 |
10.2 Croatia Cheese Culture Market Competitive Benchmarking, By Operating and Technical Parameters |
11 Company Profiles |
12 Recommendations |
13 Disclaimer |
Global Go To Market Strategy - 2030
Export potential enables firms to identify high-growth global markets with greater confidence by combining advanced trade intelligence with a structured quantitative methodology. The framework analyzes emerging demand trends and country-level import patterns while integrating macroeconomic and trade datasets such as GDP and population forecasts, bilateral import–export flows, tariff structures, elasticity differentials between developed and developing economies, geographic distance, and import demand projections. Using weighted trade values from 2020–2024 as the base period to project country-to-country export potential for 2030, these inputs are operationalized through calculated drivers such as gravity model parameters, tariff impact factors, and projected GDP per-capita growth. Through an analysis of hidden potentials, demand hotspots, and market conditions that are most favorable to success, this method enables firms to focus on target countries, maximize returns, and global expansion with data, backed by accuracy.
By factoring in the projected importer demand gap that is currently unmet and could be potential opportunity, it identifies the potential for the Exporter (Country) among 190 countries, against the general trade analysis, which identifies the biggest importer or exporter.
To discover high-growth global markets and optimize your business strategy:
Click Here
Pricing
- Single User License$ 1,995
- Department License$ 2,400
- Site License$ 3,120
- Global License$ 3,795

Leadership Perspectives from Industry Events
Search
Thought Leadership and Analyst Meet


Our Clients
6WResearch In News
- India Export Attractiveness Tracker 2026
- India Air Conditioner Market Set for Strong Rebound in 2026 After Weather-Led Correction and GST-Driven Recovery: 6Wresearch
- ADAS in India: How Automatic Emergency Braking, Blind Spot Detection & Driver Monitoring are Transforming Road Safety
- Doha a strategic location for EV manufacturing hub: IPA Qatar
- Demand for luxury TVs surging in the GCC, says Samsung
- Empowering Growth: The Thriving Journey of Bangladesh’s Cable Industry
Latest Reports
- Nicaragua RPG Gaming Market (2026-2032)
- New Zealand RPG Gaming Market (2026-2032)
- Netherlands RPG Gaming Market (2026-2032)
- Nauru RPG Gaming Market (2026-2032)
- Namibia RPG Gaming Market (2026-2032)
- Mozambique RPG Gaming Market (2026-2032)
- Montenegro RPG Gaming Market (2026-2032)
- Mongolia RPG Gaming Market (2026-2032)
- Monaco RPG Gaming Market (2026-2032)
- Micronesia RPG Gaming Market (2026-2032)
Industry Events and Analyst Meet

EV India Expo 2026

HIMTEX 2026

India Refining Summit 2026

India EV Show 2026

EV tech India Expo 2026
Whitepaper
- Middle East & Africa Commercial Security Market Click here to view more.
- Middle East & Africa Fire Safety Systems & Equipment Market Click here to view more.
- GCC Drone Market Click here to view more.
- Middle East Lighting Fixture Market Click here to view more.
- GCC Physical & Perimeter Security Market Click here to view more.