Croatia Cheese Powder Market (2025-2031) | Analysis, Forecast, Revenue, Growth, Value, Trends, Outlook, Segmentation, Companies, Industry, Share & Size
Market Forecast By Product Type (Cheddar, Parmesan, Mozzarella, Other Product Types), By Application (Bakery and Confectionery, Sweet and Savory Snacks, Sauces, Dressings, and Dips and Condiments, Ready Meals, Other Applications) And Competitive Landscape
| Product Code: ETC4850000 | Publication Date: Nov 2023 | Updated Date: Oct 2025 | Product Type: Market Research Report | |
| Publisher: 6Wresearch | Author: Sachin Kumar Rai | No. of Pages: 60 | No. of Figures: 30 | No. of Tables: 5 |
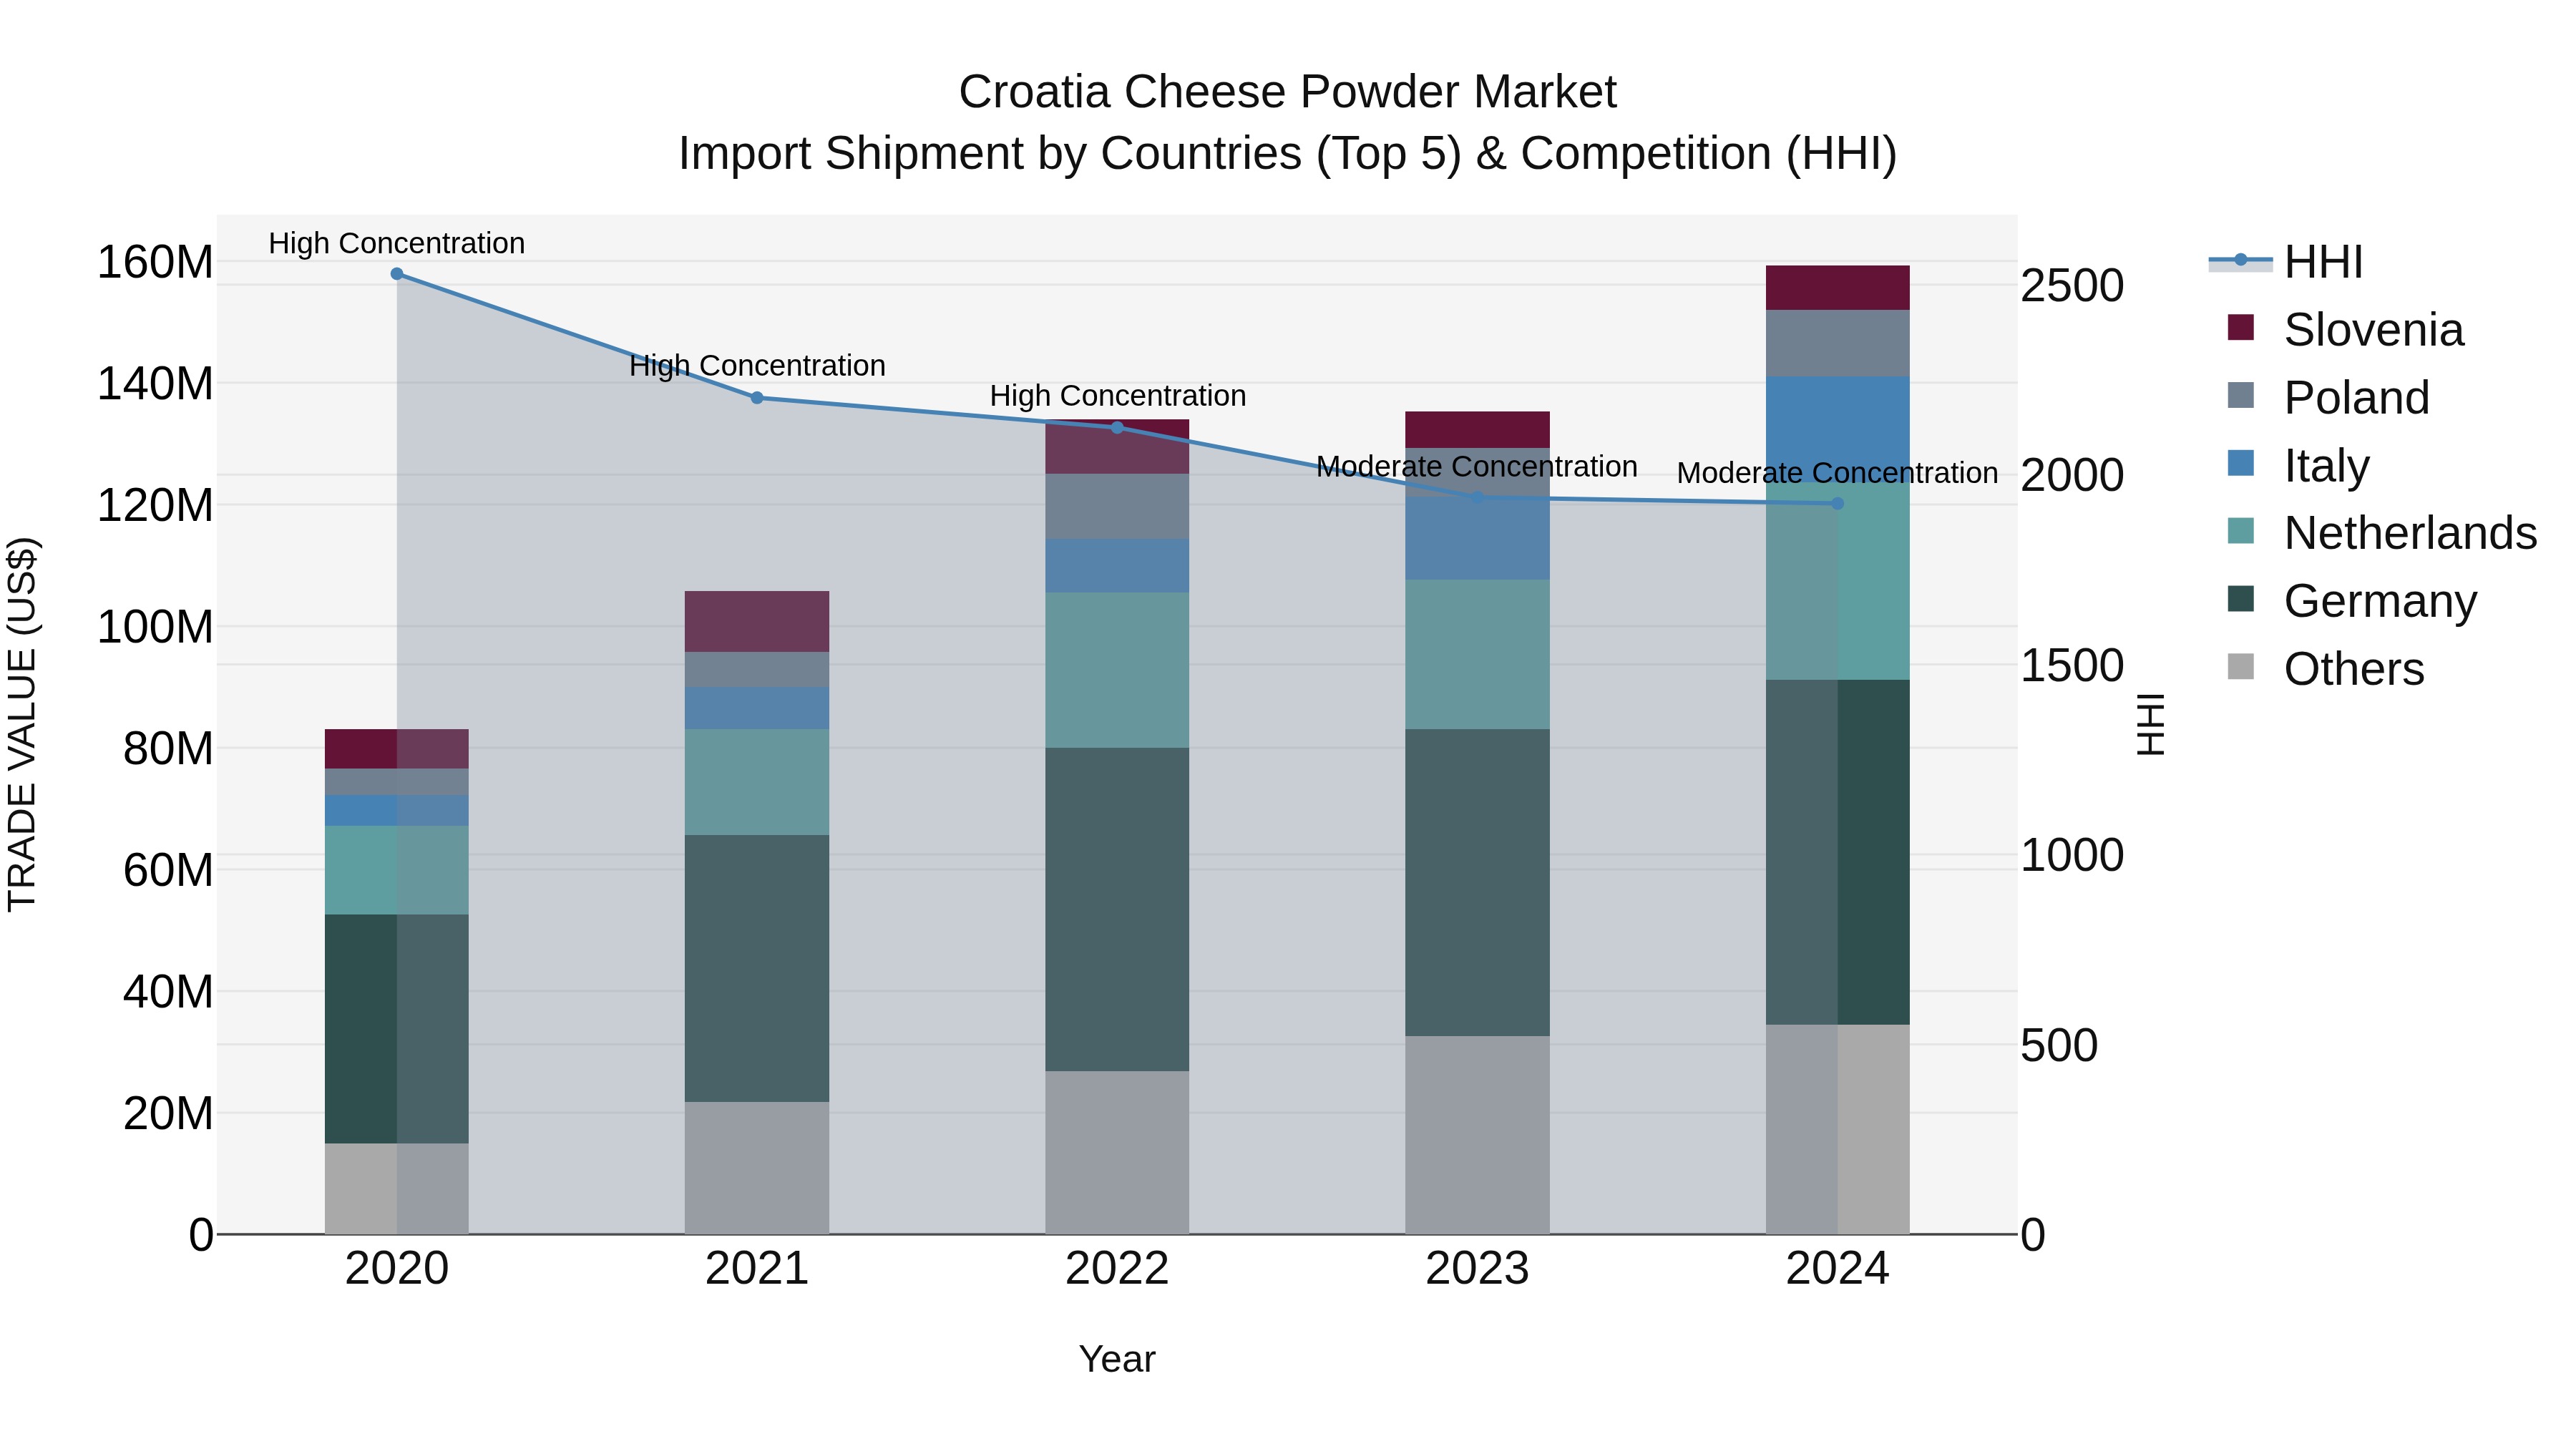
Croatia Cheese Powder Market Top 5 Importing Countries and Market Competition (HHI) Analysis
Croatia cheese powder import market continues to show robust growth, with top exporters like Germany, Netherlands, and Italy leading the way. The market concentration, as measured by the Herfindahl-Hirschman Index (HHI), remained at a moderate level in 2024, indicating a healthy level of competition. The impressive compound annual growth rate (CAGR) of 17.69% from 2020 to 2024 underscores the increasing demand for cheese powder in Croatia. The growth rate of 17.74% from 2023 to 2024 suggests a sustained momentum in the market, making it an attractive opportunity for both domestic and international suppliers.
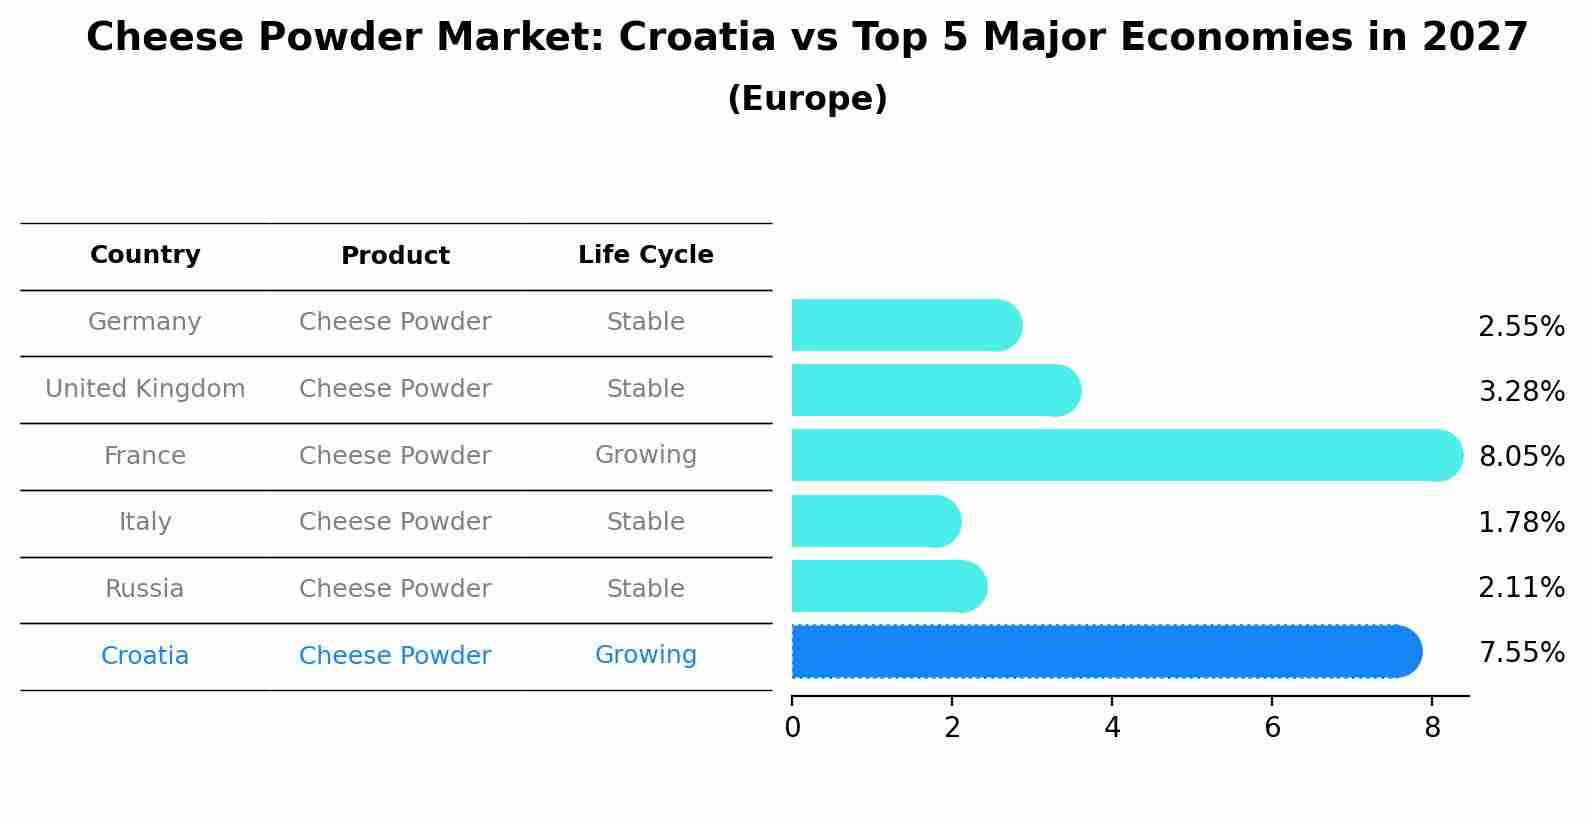
Cheese Powder Market: Croatia vs Top 5 Major Economies in 2027 (Europe)
The Cheese Powder market in Croatia is projected to grow at a growing growth rate of 7.55% by 2027, highlighting the country's increasing focus on advanced technologies within the Europe region, where Germany holds the dominant position, followed closely by United Kingdom, France, Italy and Russia, shaping overall regional demand.
Croatia Cheese Powder Market Overview
The cheese powder market in Croatia is driven by its use in the food processing industry, particularly in snacks, sauces, and ready-made meals. Cheese powder offers the flavor of real cheese with longer shelf life and easier storage, making it a popular ingredient in processed foods. The demand for convenience food is expected to fuel further growth in this market.
Drivers of the market
The cheese powder market in Croatia is driven by the demand for convenient and versatile cheese products used in snacks, seasonings, and processed foods. Cheese powder offers a long shelf life and ease of use, supporting its adoption in the food industry and contributing to market growth.
Challenges of the market
The cheese powder market in Croatia encounters challenges related to production costs and market demand. Cheese powder production involves specialized processes and materials that can be costly. Additionally, market demand for cheese powder can be influenced by economic conditions and changing consumer preferences. Managing production costs while meeting market demand and maintaining product quality are key challenges for this market.
Government Policy of the market
The cheese powder market in Croatia is affected by regulations on food safety and product quality. The government enforces EU directives for the production and labeling of cheese powder, ensuring that it meets safety standards and provides accurate nutritional information.
Key Highlights of the Report:
- Croatia Cheese Powder Market Outlook
- Market Size of Croatia Cheese Powder Market, 2024
- Forecast of Croatia Cheese Powder Market, 2031
- Historical Data and Forecast of Croatia Cheese Powder Revenues & Volume for the Period 2021-2031
- Croatia Cheese Powder Market Trend Evolution
- Croatia Cheese Powder Market Drivers and Challenges
- Croatia Cheese Powder Price Trends
- Croatia Cheese Powder Porter`s Five Forces
- Croatia Cheese Powder Industry Life Cycle
- Historical Data and Forecast of Croatia Cheese Powder Market Revenues & Volume By Product Type for the Period 2021-2031
- Historical Data and Forecast of Croatia Cheese Powder Market Revenues & Volume By Cheddar for the Period 2021-2031
- Historical Data and Forecast of Croatia Cheese Powder Market Revenues & Volume By Parmesan for the Period 2021-2031
- Historical Data and Forecast of Croatia Cheese Powder Market Revenues & Volume By Mozzarella for the Period 2021-2031
- Historical Data and Forecast of Croatia Cheese Powder Market Revenues & Volume By Other Product Types for the Period 2021-2031
- Historical Data and Forecast of Croatia Cheese Powder Market Revenues & Volume By Application for the Period 2021-2031
- Historical Data and Forecast of Croatia Cheese Powder Market Revenues & Volume By Bakery and Confectionery for the Period 2021-2031
- Historical Data and Forecast of Croatia Cheese Powder Market Revenues & Volume By Sweet and Savory Snacks for the Period 2021-2031
- Historical Data and Forecast of Croatia Cheese Powder Market Revenues & Volume By Sauces, Dressings, and Dips and Condiments for the Period 2021-2031
- Historical Data and Forecast of Croatia Cheese Powder Market Revenues & Volume By Ready Meals for the Period 2021-2031
- Historical Data and Forecast of Croatia Cheese Powder Market Revenues & Volume By Other Applications for the Period 2021-2031
- Croatia Cheese Powder Import Export Trade Statistics
- Market Opportunity Assessment By Product Type
- Market Opportunity Assessment By Application
- Croatia Cheese Powder Top Companies Market Share
- Croatia Cheese Powder Competitive Benchmarking By Technical and Operational Parameters
- Croatia Cheese Powder Company Profiles
- Croatia Cheese Powder Key Strategic Recommendations
Frequently Asked Questions About the Market Study (FAQs):
6Wresearch actively monitors the Croatia Cheese Powder Market and publishes its comprehensive annual report, highlighting emerging trends, growth drivers, revenue analysis, and forecast outlook. Our insights help businesses to make data-backed strategic decisions with ongoing market dynamics. Our analysts track relevent industries related to the Croatia Cheese Powder Market, allowing our clients with actionable intelligence and reliable forecasts tailored to emerging regional needs.
Yes, we provide customisation as per your requirements. To learn more, feel free to contact us on sales@6wresearch.com
1 Executive Summary |
2 Introduction |
2.1 Key Highlights of the Report |
2.2 Report Description |
2.3 Market Scope & Segmentation |
2.4 Research Methodology |
2.5 Assumptions |
3 Croatia Cheese Powder Market Overview |
3.1 Croatia Country Macro Economic Indicators |
3.2 Croatia Cheese Powder Market Revenues & Volume, 2021 & 2031F |
3.3 Croatia Cheese Powder Market - Industry Life Cycle |
3.4 Croatia Cheese Powder Market - Porter's Five Forces |
3.5 Croatia Cheese Powder Market Revenues & Volume Share, By Product Type, 2021 & 2031F |
3.6 Croatia Cheese Powder Market Revenues & Volume Share, By Application, 2021 & 2031F |
4 Croatia Cheese Powder Market Dynamics |
4.1 Impact Analysis |
4.2 Market Drivers |
4.2.1 Increasing demand for convenience food products |
4.2.2 Growth in the food processing industry |
4.2.3 Rising consumer preference for ready-to-eat and packaged foods |
4.3 Market Restraints |
4.3.1 Fluctuating prices of raw materials |
4.3.2 Stringent regulations and quality standards |
4.3.3 Competition from substitute products |
5 Croatia Cheese Powder Market Trends |
6 Croatia Cheese Powder Market Segmentations |
6.1 Croatia Cheese Powder Market, By Product Type |
6.1.1 Overview and Analysis |
6.1.2 Croatia Cheese Powder Market Revenues & Volume, By Cheddar, 2021-2031F |
6.1.3 Croatia Cheese Powder Market Revenues & Volume, By Parmesan, 2021-2031F |
6.1.4 Croatia Cheese Powder Market Revenues & Volume, By Mozzarella, 2021-2031F |
6.1.5 Croatia Cheese Powder Market Revenues & Volume, By Other Product Types, 2021-2031F |
6.2 Croatia Cheese Powder Market, By Application |
6.2.1 Overview and Analysis |
6.2.2 Croatia Cheese Powder Market Revenues & Volume, By Bakery and Confectionery, 2021-2031F |
6.2.3 Croatia Cheese Powder Market Revenues & Volume, By Sweet and Savory Snacks, 2021-2031F |
6.2.4 Croatia Cheese Powder Market Revenues & Volume, By Sauces, Dressings, and Dips and Condiments, 2021-2031F |
6.2.5 Croatia Cheese Powder Market Revenues & Volume, By Ready Meals, 2021-2031F |
6.2.6 Croatia Cheese Powder Market Revenues & Volume, By Other Applications, 2021-2031F |
7 Croatia Cheese Powder Market Import-Export Trade Statistics |
7.1 Croatia Cheese Powder Market Export to Major Countries |
7.2 Croatia Cheese Powder Market Imports from Major Countries |
8 Croatia Cheese Powder Market Key Performance Indicators |
8.1 Average selling price of cheese powder in Croatia |
8.2 Number of new product launches in the cheese powder market |
8.3 Consumer awareness and perception of cheese powder products |
8.4 Investment in research and development for cheese powder innovations |
8.5 Consumer satisfaction levels with cheese powder products |
9 Croatia Cheese Powder Market - Opportunity Assessment |
9.1 Croatia Cheese Powder Market Opportunity Assessment, By Product Type, 2021 & 2031F |
9.2 Croatia Cheese Powder Market Opportunity Assessment, By Application, 2021 & 2031F |
10 Croatia Cheese Powder Market - Competitive Landscape |
10.1 Croatia Cheese Powder Market Revenue Share, By Companies, 2024 |
10.2 Croatia Cheese Powder Market Competitive Benchmarking, By Operating and Technical Parameters |
11 Company Profiles |
12 Recommendations | 13 Disclaimer |
Global Go To Market Strategy - 2030
Export potential enables firms to identify high-growth global markets with greater confidence by combining advanced trade intelligence with a structured quantitative methodology. The framework analyzes emerging demand trends and country-level import patterns while integrating macroeconomic and trade datasets such as GDP and population forecasts, bilateral import–export flows, tariff structures, elasticity differentials between developed and developing economies, geographic distance, and import demand projections. Using weighted trade values from 2020–2024 as the base period to project country-to-country export potential for 2030, these inputs are operationalized through calculated drivers such as gravity model parameters, tariff impact factors, and projected GDP per-capita growth. Through an analysis of hidden potentials, demand hotspots, and market conditions that are most favorable to success, this method enables firms to focus on target countries, maximize returns, and global expansion with data, backed by accuracy.
By factoring in the projected importer demand gap that is currently unmet and could be potential opportunity, it identifies the potential for the Exporter (Country) among 190 countries, against the general trade analysis, which identifies the biggest importer or exporter.
To discover high-growth global markets and optimize your business strategy:
Click Here
Pricing
- Single User License$ 1,995
- Department License$ 2,400
- Site License$ 3,120
- Global License$ 3,795

Leadership Perspectives from Industry Events
Search
Thought Leadership and Analyst Meet


Our Clients
6WResearch In News
- India Export Attractiveness Tracker 2026
- India Air Conditioner Market Set for Strong Rebound in 2026 After Weather-Led Correction and GST-Driven Recovery: 6Wresearch
- ADAS in India: How Automatic Emergency Braking, Blind Spot Detection & Driver Monitoring are Transforming Road Safety
- Doha a strategic location for EV manufacturing hub: IPA Qatar
- Demand for luxury TVs surging in the GCC, says Samsung
- Empowering Growth: The Thriving Journey of Bangladesh’s Cable Industry
Latest Reports
- Nicaragua RPG Gaming Market (2026-2032)
- New Zealand RPG Gaming Market (2026-2032)
- Netherlands RPG Gaming Market (2026-2032)
- Nauru RPG Gaming Market (2026-2032)
- Namibia RPG Gaming Market (2026-2032)
- Mozambique RPG Gaming Market (2026-2032)
- Montenegro RPG Gaming Market (2026-2032)
- Mongolia RPG Gaming Market (2026-2032)
- Monaco RPG Gaming Market (2026-2032)
- Micronesia RPG Gaming Market (2026-2032)
Industry Events and Analyst Meet

EV India Expo 2026

HIMTEX 2026

India Refining Summit 2026

India EV Show 2026

EV tech India Expo 2026
Whitepaper
- Middle East & Africa Commercial Security Market Click here to view more.
- Middle East & Africa Fire Safety Systems & Equipment Market Click here to view more.
- GCC Drone Market Click here to view more.
- Middle East Lighting Fixture Market Click here to view more.
- GCC Physical & Perimeter Security Market Click here to view more.