Croatia Chocolate Couverture Market (2026-2032) | Industry, Consumer Insights, Drivers, Strategy, Challenges, Pricing Analysis, Size, Forecast, Segmentation, Growth, Companies, Revenue, Supply, Investment Trends, Trends, Value, Share, Competitive, Demand, Analysis, Restraints, Strategic Insights, Opportunities, Outlook, Segments, Competition
Market Forecast By Type (Dark Couverture Chocolate, Milk Couverture Chocolate, White Couverture Chocolate), By Application (Confectionery, Bakery, Ice Cream, Others), By Distribution Channel (Supermarkets/Hypermarkets, Specialty Stores, Online Retailers, Others) And Competitive Landscape
| Product Code: ETC11634581 | Publication Date: Apr 2025 | Updated Date: Apr 2026 | Product Type: Market Research Report | |
| Publisher: 6Wresearch | Author: Bhawna Singh | No. of Pages: 65 | No. of Figures: 34 | No. of Tables: 19 |
Croatia Chocolate Couverture Market Size (2020-2030)
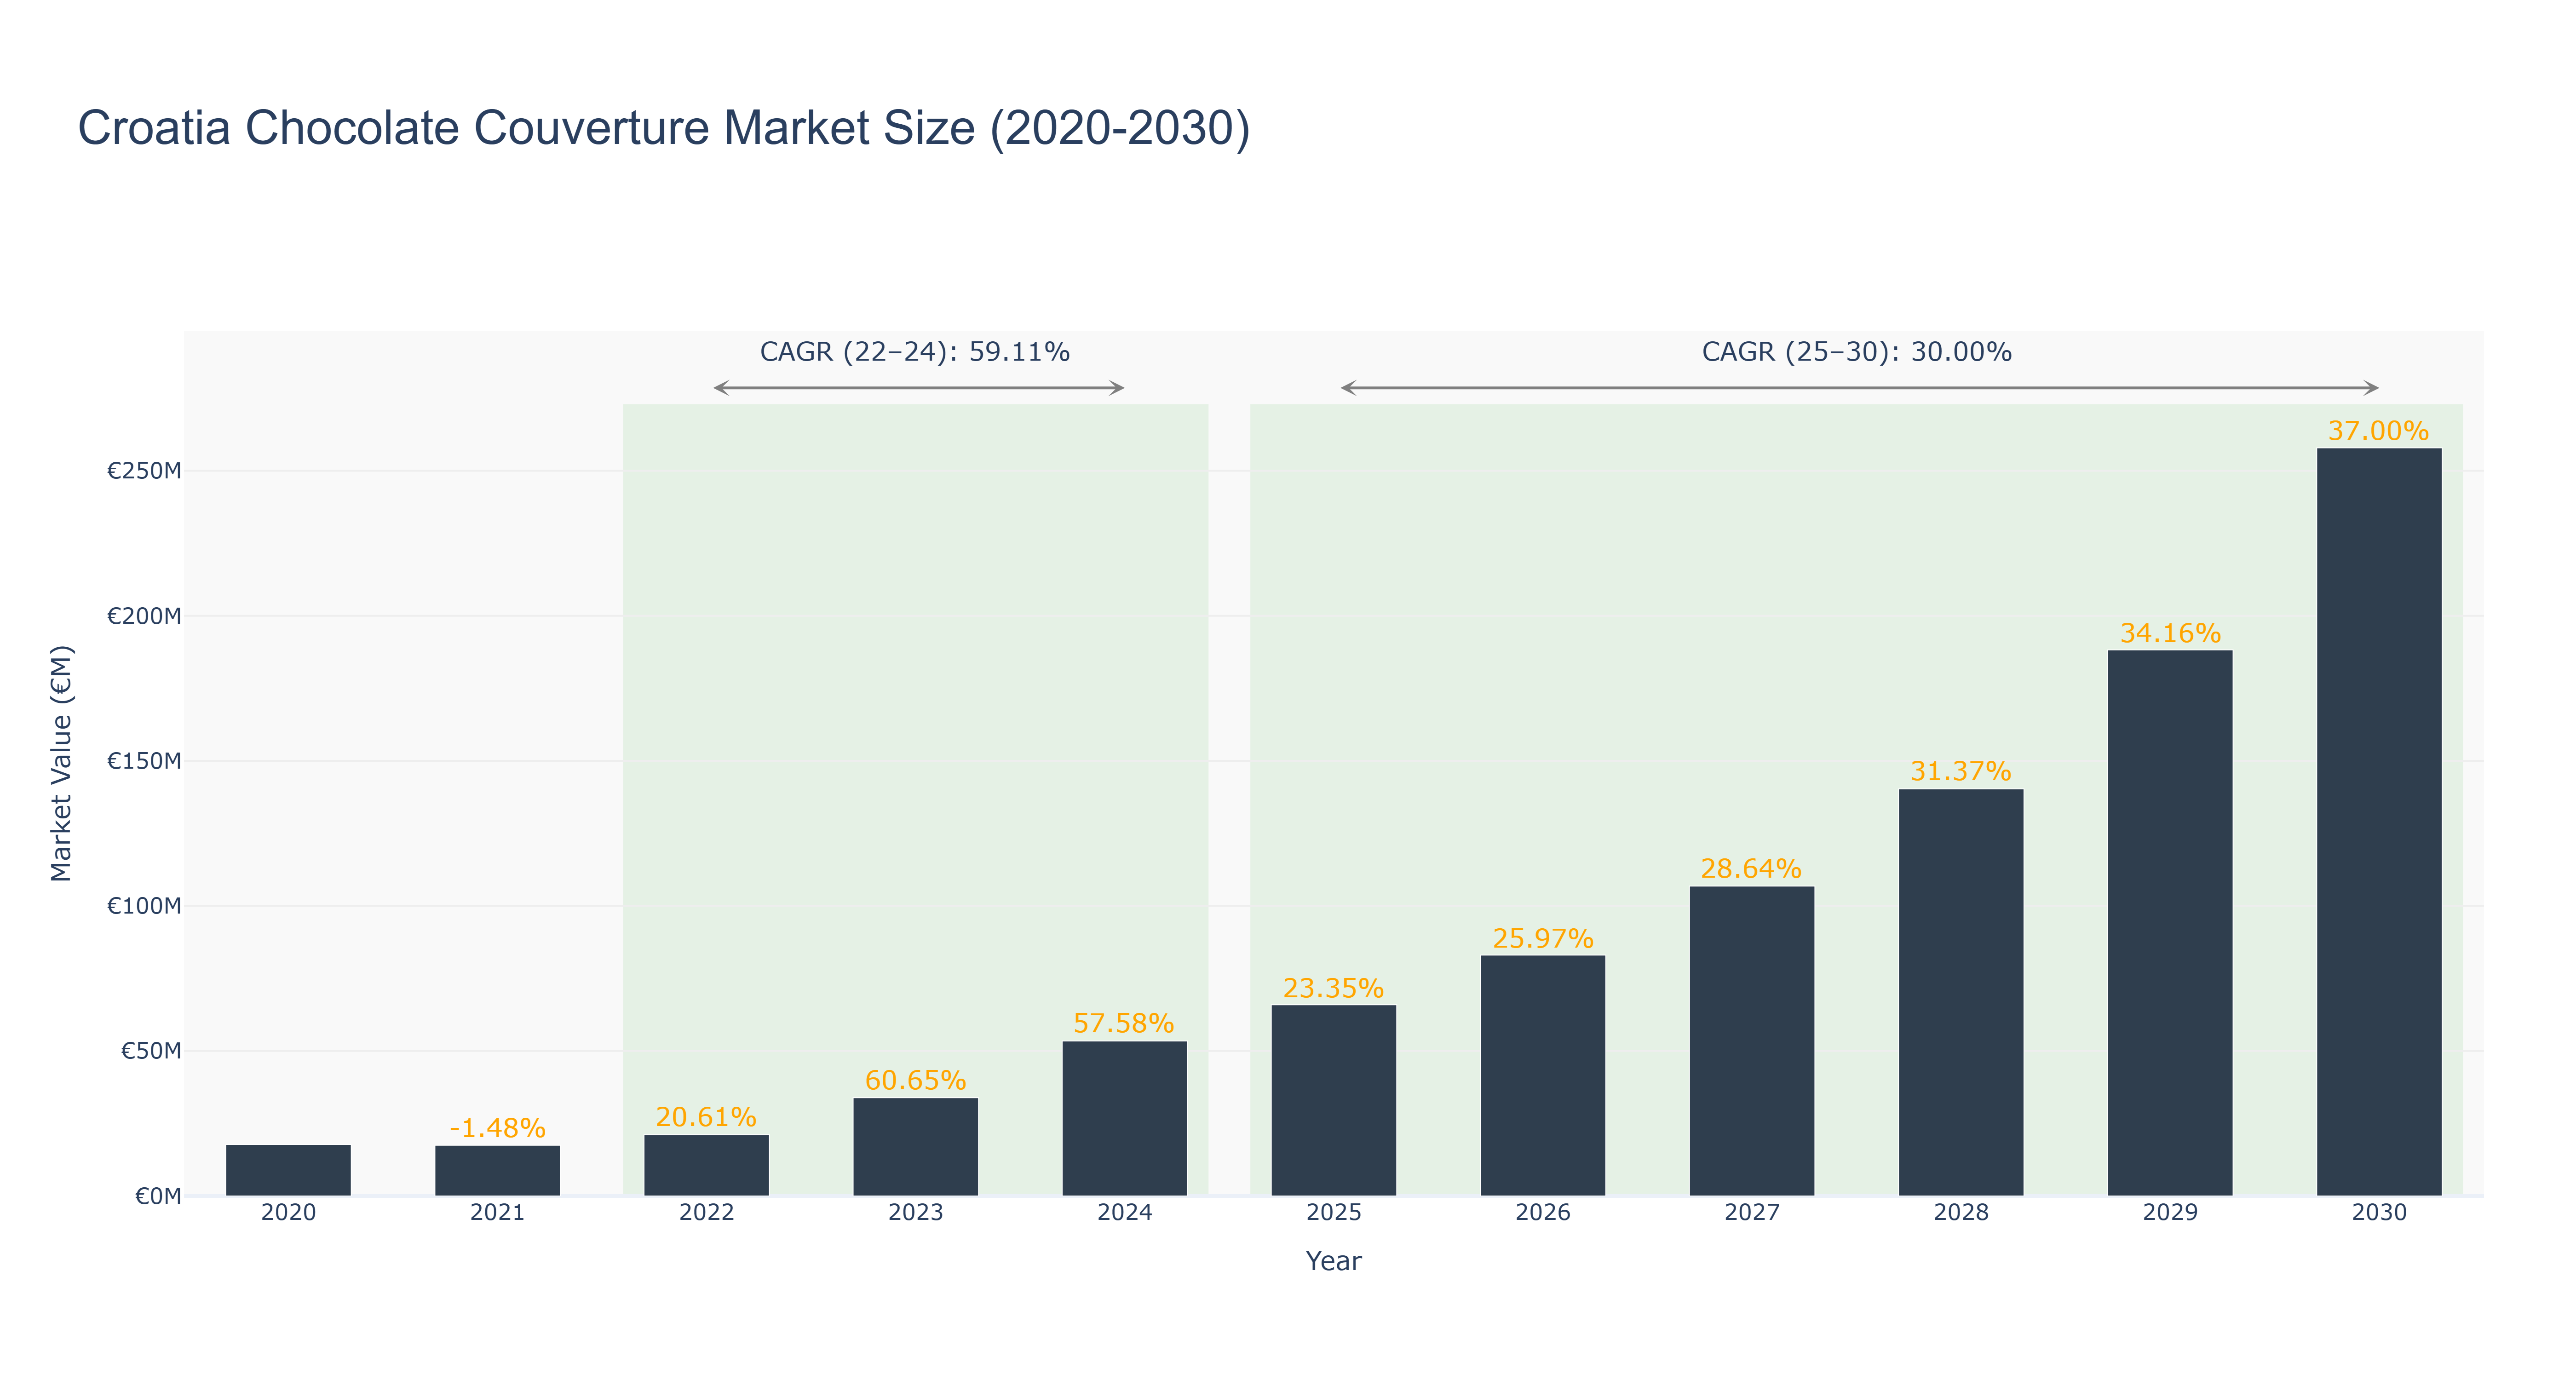
Croatia Chocolate Couverture Market has shown remarkable growth over the years. The market peaked at €257.92 million in 2030, with a notable increase in size from €17.76 million in 2020 to €53.43 million in 2024. The forecasted market size is expected to reach €188.26 million by 2029. The CAGR for 2022-24 stands at 59.11%, reflecting a period of rapid expansion, while the CAGR for 2025-30 is projected at 30.0%. The surge in demand for premium chocolate products, coupled with changing consumer preferences towards high-quality ingredients, has been a key driver for the market growth. Looking ahead, Croatia is set to introduce a new sustainable sourcing initiative in the chocolate industry, aiming to further enhance the market's competitiveness and sustainability in the global market.
Croatia Chocolate Couverture Market: Production & Trade Performance (2019-2025)
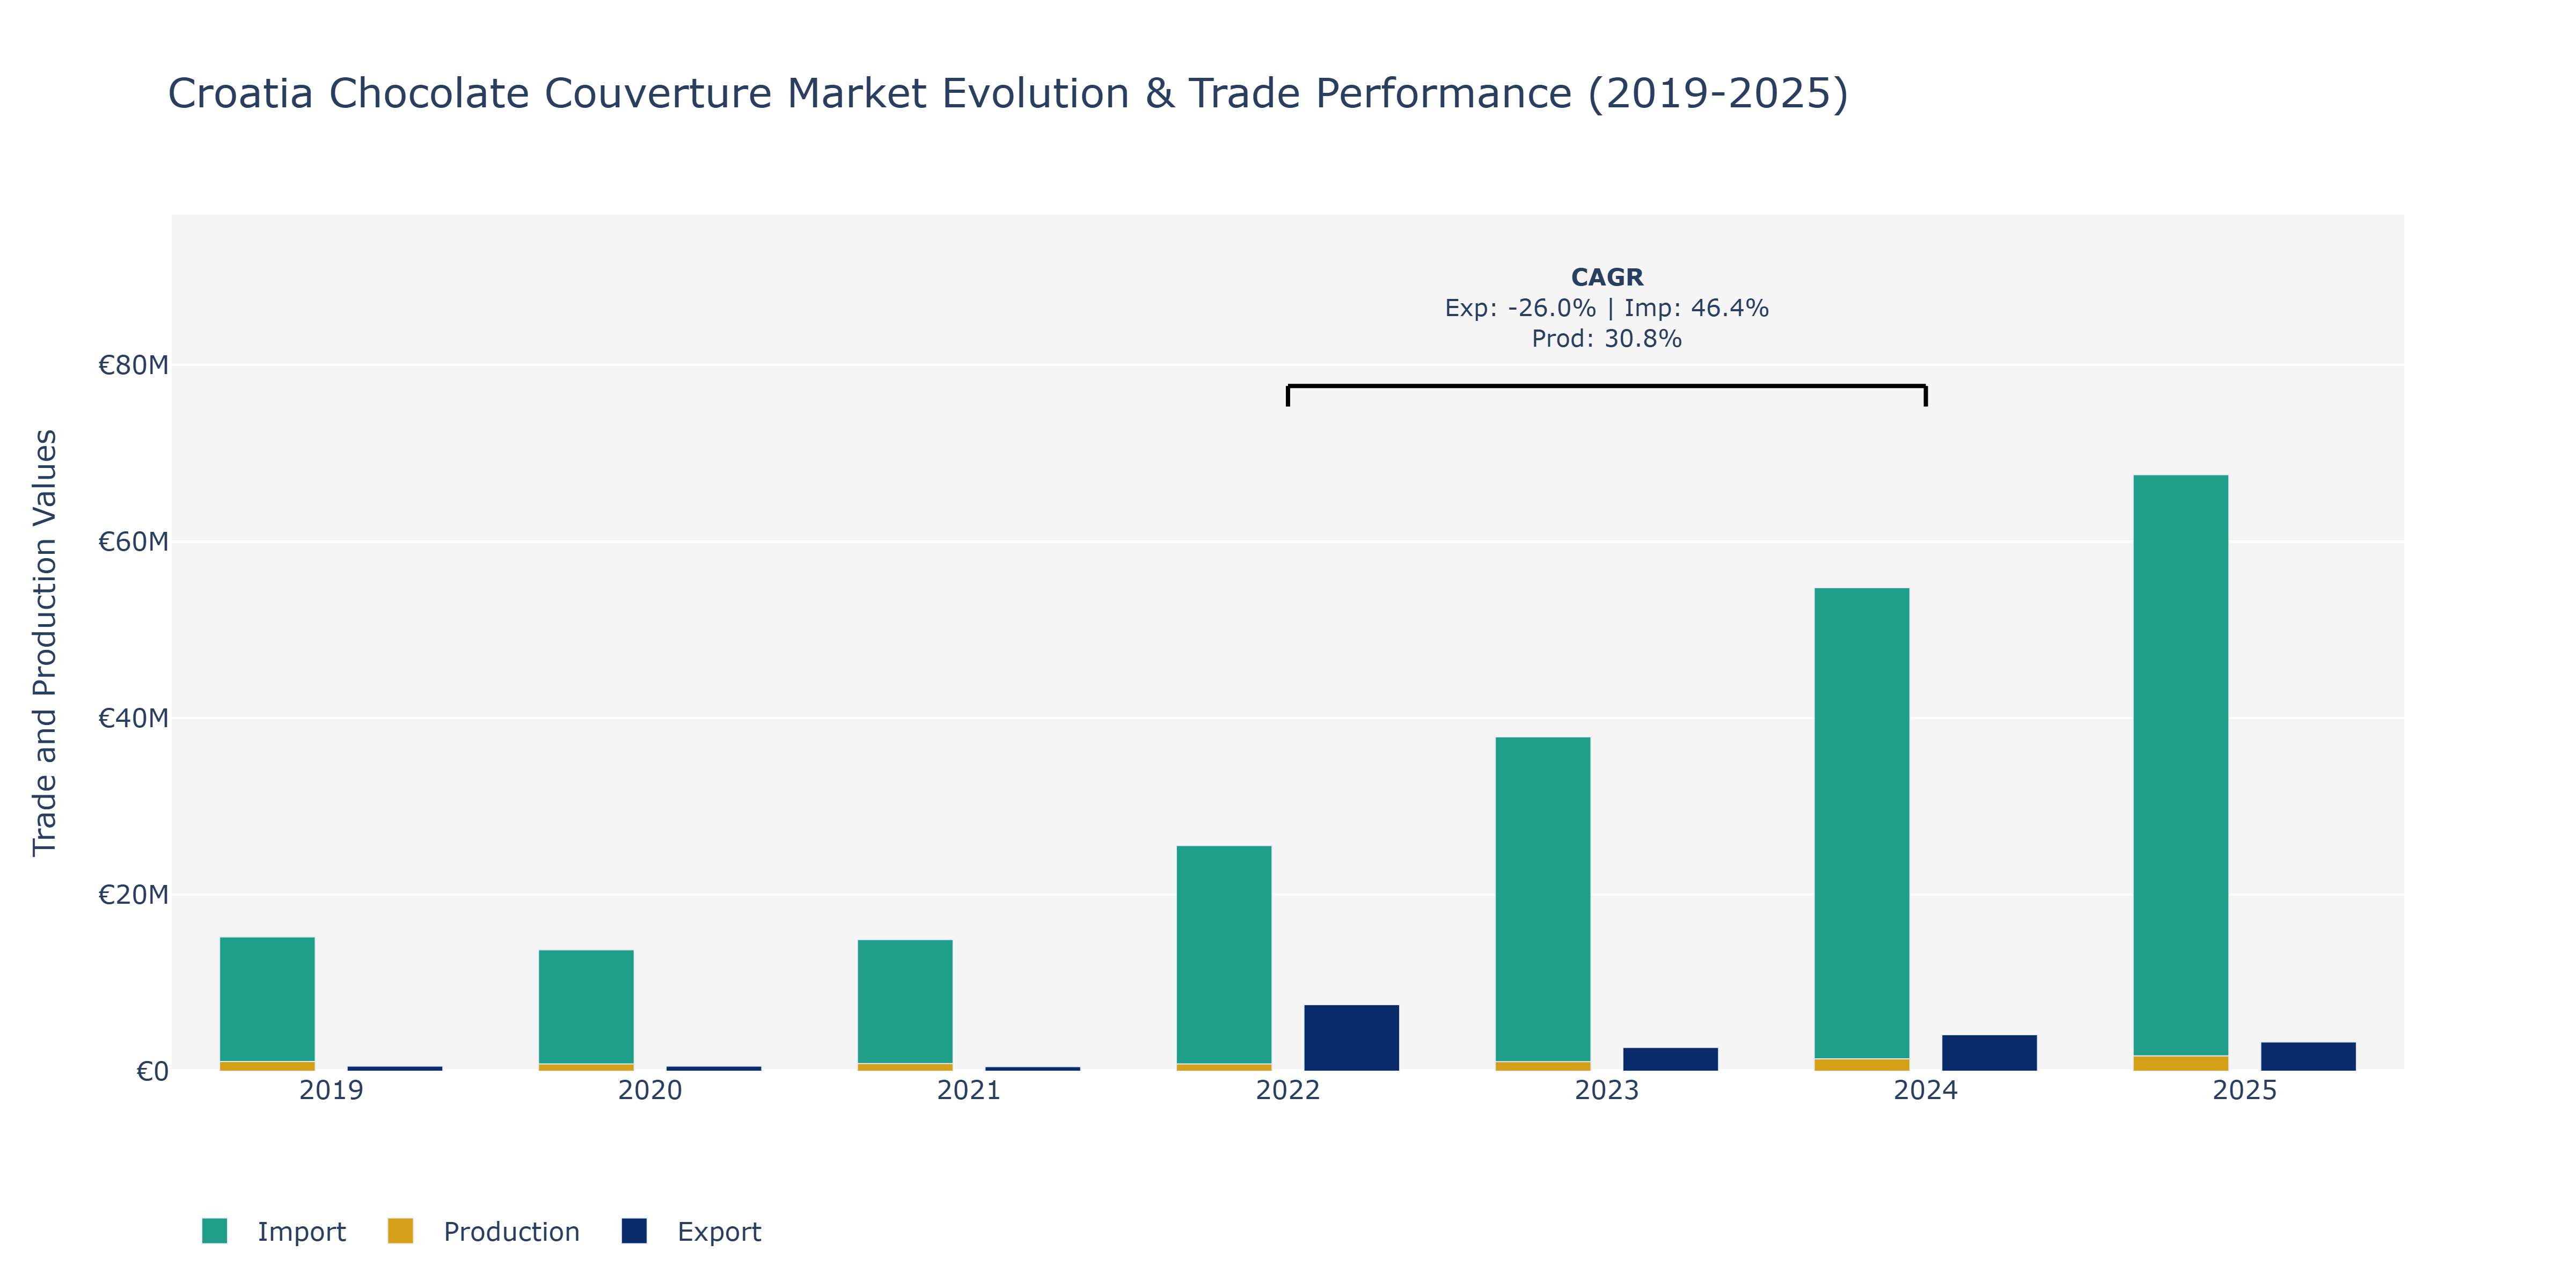
In the Croatia Chocolate Couverture Market, exports experienced fluctuations over the years, starting at €575.77 thousand in 2019, declining to €517.44 thousand in 2021, then significantly jumping to €7.54 million in 2022, before decreasing to €4.13 million in 2024, and finally stabilizing around €3.32 million in 2025. This erratic pattern could be attributed to shifts in global demand, changes in trade agreements, and competition dynamics. Imports, on the other hand, showed a steady increase from €15.21 million in 2019 to €54.79 million in 2024, with a peak at €67.58 million in 2025. This upward trend may reflect growing consumer preferences for foreign chocolate varieties and the need for raw materials. Production levels also varied, from €1.09 billion in 2019 to €872 million in 2021, peaking at €1.74 billion in 2025. The production spike could be linked to enhanced manufacturing capabilities, improved supply chain efficiency, and the pursuit of economies of scale in response to rising demand.
Key Highlights of the Report:
- Croatia Chocolate Couverture Market Outlook
- Market Size of Croatia Chocolate Couverture Market, 2025
- Forecast of Croatia Chocolate Couverture Market, 2032
- Historical Data and Forecast of Croatia Chocolate Couverture Revenues & Volume for the Period 2022 - 2032F
- Croatia Chocolate Couverture Market Trend Evolution
- Croatia Chocolate Couverture Market Drivers and Challenges
- Croatia Chocolate Couverture Price Trends
- Croatia Chocolate Couverture Porter's Five Forces
- Croatia Chocolate Couverture Industry Life Cycle
- Historical Data and Forecast of Croatia Chocolate Couverture Market Revenues & Volume By Type for the Period 2022 - 2032F
- Historical Data and Forecast of Croatia Chocolate Couverture Market Revenues & Volume By Dark Couverture Chocolate for the Period 2022 - 2032F
- Historical Data and Forecast of Croatia Chocolate Couverture Market Revenues & Volume By Milk Couverture Chocolate for the Period 2022 - 2032F
- Historical Data and Forecast of Croatia Chocolate Couverture Market Revenues & Volume By White Couverture Chocolate for the Period 2022 - 2032F
- Historical Data and Forecast of Croatia Chocolate Couverture Market Revenues & Volume By Application for the Period 2022 - 2032F
- Historical Data and Forecast of Croatia Chocolate Couverture Market Revenues & Volume By Confectionery for the Period 2022 - 2032F
- Historical Data and Forecast of Croatia Chocolate Couverture Market Revenues & Volume By Bakery for the Period 2022 - 2032F
- Historical Data and Forecast of Croatia Chocolate Couverture Market Revenues & Volume By Ice Cream for the Period 2022 - 2032F
- Historical Data and Forecast of Croatia Chocolate Couverture Market Revenues & Volume By Others for the Period 2022 - 2032F
- Historical Data and Forecast of Croatia Chocolate Couverture Market Revenues & Volume By Distribution Channel for the Period 2022 - 2032F
- Historical Data and Forecast of Croatia Chocolate Couverture Market Revenues & Volume By Supermarkets/Hypermarkets for the Period 2022 - 2032F
- Historical Data and Forecast of Croatia Chocolate Couverture Market Revenues & Volume By Specialty Stores for the Period 2022 - 2032F
- Historical Data and Forecast of Croatia Chocolate Couverture Market Revenues & Volume By Online Retailers for the Period 2022 - 2032F
- Historical Data and Forecast of Croatia Chocolate Couverture Market Revenues & Volume By Others for the Period 2022 - 2032F
- Croatia Chocolate Couverture Import Export Trade Statistics
- Market Opportunity Assessment By Type
- Market Opportunity Assessment By Application
- Market Opportunity Assessment By Distribution Channel
- Croatia Chocolate Couverture Top Companies Market Share
- Croatia Chocolate Couverture Competitive Benchmarking By Technical and Operational Parameters
- Croatia Chocolate Couverture Company Profiles
- Croatia Chocolate Couverture Key Strategic Recommendations
Frequently Asked Questions About the Market Study (FAQs):
6Wresearch actively monitors the Croatia Chocolate Couverture Market and publishes its comprehensive annual report, highlighting emerging trends, growth drivers, revenue analysis, and forecast outlook. Our insights help businesses to make data-backed strategic decisions with ongoing market dynamics. Our analysts track relevent industries related to the Croatia Chocolate Couverture Market, allowing our clients with actionable intelligence and reliable forecasts tailored to emerging regional needs.
Yes, we provide customisation as per your requirements. To learn more, feel free to contact us on sales@6wresearch.com
1 Executive Summary |
2 Introduction |
2.1 Key Highlights of the Report |
2.2 Report Description |
2.3 Market Scope & Segmentation |
2.4 Research Methodology |
2.5 Assumptions |
3 Croatia Chocolate Couverture Market Overview |
3.1 Croatia Country Macro Economic Indicators |
3.2 Croatia Chocolate Couverture Market Revenues & Volume, 2022 & 2032F |
3.3 Croatia Chocolate Couverture Market - Industry Life Cycle |
3.4 Croatia Chocolate Couverture Market - Porter's Five Forces |
3.5 Croatia Chocolate Couverture Market Revenues & Volume Share, By Type, 2022 & 2032F |
3.6 Croatia Chocolate Couverture Market Revenues & Volume Share, By Application, 2022 & 2032F |
3.7 Croatia Chocolate Couverture Market Revenues & Volume Share, By Distribution Channel, 2022 & 2032F |
4 Croatia Chocolate Couverture Market Dynamics |
4.1 Impact Analysis |
4.2 Market Drivers |
4.3 Market Restraints |
5 Croatia Chocolate Couverture Market Trends |
6 Croatia Chocolate Couverture Market, By Types |
6.1 Croatia Chocolate Couverture Market, By Type |
6.1.1 Overview and Analysis |
6.1.2 Croatia Chocolate Couverture Market Revenues & Volume, By Type, 2022 - 2032F |
6.1.3 Croatia Chocolate Couverture Market Revenues & Volume, By Dark Couverture Chocolate, 2022 - 2032F |
6.1.4 Croatia Chocolate Couverture Market Revenues & Volume, By Milk Couverture Chocolate, 2022 - 2032F |
6.1.5 Croatia Chocolate Couverture Market Revenues & Volume, By White Couverture Chocolate, 2022 - 2032F |
6.2 Croatia Chocolate Couverture Market, By Application |
6.2.1 Overview and Analysis |
6.2.2 Croatia Chocolate Couverture Market Revenues & Volume, By Confectionery, 2022 - 2032F |
6.2.3 Croatia Chocolate Couverture Market Revenues & Volume, By Bakery, 2022 - 2032F |
6.2.4 Croatia Chocolate Couverture Market Revenues & Volume, By Ice Cream, 2022 - 2032F |
6.2.5 Croatia Chocolate Couverture Market Revenues & Volume, By Others, 2022 - 2032F |
6.3 Croatia Chocolate Couverture Market, By Distribution Channel |
6.3.1 Overview and Analysis |
6.3.2 Croatia Chocolate Couverture Market Revenues & Volume, By Supermarkets/Hypermarkets, 2022 - 2032F |
6.3.3 Croatia Chocolate Couverture Market Revenues & Volume, By Specialty Stores, 2022 - 2032F |
6.3.4 Croatia Chocolate Couverture Market Revenues & Volume, By Online Retailers, 2022 - 2032F |
6.3.5 Croatia Chocolate Couverture Market Revenues & Volume, By Others, 2022 - 2032F |
7 Croatia Chocolate Couverture Market Import-Export Trade Statistics |
7.1 Croatia Chocolate Couverture Market Export to Major Countries |
7.2 Croatia Chocolate Couverture Market Imports from Major Countries |
8 Croatia Chocolate Couverture Market Key Performance Indicators |
9 Croatia Chocolate Couverture Market - Opportunity Assessment |
9.1 Croatia Chocolate Couverture Market Opportunity Assessment, By Type, 2022 & 2032F |
9.2 Croatia Chocolate Couverture Market Opportunity Assessment, By Application, 2022 & 2032F |
9.3 Croatia Chocolate Couverture Market Opportunity Assessment, By Distribution Channel, 2022 & 2032F |
10 Croatia Chocolate Couverture Market - Competitive Landscape |
10.1 Croatia Chocolate Couverture Market Revenue Share, By Companies, 2025 |
10.2 Croatia Chocolate Couverture Market Competitive Benchmarking, By Operating and Technical Parameters |
11 Company Profiles |
12 Recommendations |
13 Disclaimer |
Export potential assessment - trade Analytics for 2030
Export potential enables firms to identify high-growth global markets with greater confidence by combining advanced trade intelligence with a structured quantitative methodology. The framework analyzes emerging demand trends and country-level import patterns while integrating macroeconomic and trade datasets such as GDP and population forecasts, bilateral import–export flows, tariff structures, elasticity differentials between developed and developing economies, geographic distance, and import demand projections. Using weighted trade values from 2020–2024 as the base period to project country-to-country export potential for 2030, these inputs are operationalized through calculated drivers such as gravity model parameters, tariff impact factors, and projected GDP per-capita growth. Through an analysis of hidden potentials, demand hotspots, and market conditions that are most favorable to success, this method enables firms to focus on target countries, maximize returns, and global expansion with data, backed by accuracy.
By factoring in the projected importer demand gap that is currently unmet and could be potential opportunity, it identifies the potential for the Exporter (Country) among 190 countries, against the general trade analysis, which identifies the biggest importer or exporter.
To discover high-growth global markets and optimize your business strategy:
Click Here
Pricing
- Single User License$ 1,995
- Department License$ 2,400
- Site License$ 3,120
- Global License$ 3,795

Search
Thought Leadership and Analyst Meet


Our Clients
Latest Reports
- India Electromagnetic Bulk Flow Meter Market (2026-2032) | Analysis, Challenges, Strategic Insights, Supply, Forecast, Growth, Share, Consumer Insights, Competitive, Value, Outlook, Size & Demand,
- India Battery Powered Bulk Flow Meter Market (2026-2032) | Outlook, Analysis, Competitive Landscape, Growth, Size, Trends, Value, Revenue, Companies, Segmentation, Share & Forecast
- Bosnia and Herzegovina Fuel-Efficient Winglets Market (2026-2032) | Growth, Competition, Strategy, Restraints, Trends, Challenges, segmentation, Value, Outlook, Investment Opportunities, Analysis, Revenue, Companies, Insights, Pricing, Size, Drivers, Demand, Share, Forecast
- Canada Cloud CFD Market (2026-2032) | Size & Revenue, Industry, Growth, Competitive Landscape, Forecast, Segmentation, Value, Outlook, Trends, Share, Analysis, Companies
- Taiwan Food Delivery Platform Market (2026-2032) | Companies, Outlook, Analysis, Trends, Value, Revenue, Segmentation, Share, Forecast, Competitive Landscape, Growth, Size & Forecast
- United Kingdom (UK) Long-term Care Insurance Market (2026-2032) | Growth, Share, Consumer Insights, Drivers, Opportunities, Competition, Pricing Analysis, Segments, Restraints, Companies, Competitive, Value, Outlook, Size, Demand, Analysis, Challenges, Strategic Insights, Investment Trends, Revenue, Trends, Supply, Forecast
- United Kingdom (UK) Long Term Care Market (2026-2032) | Companies, Outlook, Analysis, Trends, Value, Revenue, Segmentation, Share, Forecast, Competitive Landscape, Growth, Size & Forecast
- Iraq Insulation and Waterproofing Market (2026-2032) | Outlook, Drivers, Growth, Size, Share, Industry, Revenue, Trends, Demand, Competitive, Strategic Insights, Opportunities, Segments, Companies, Challenges, Strategy, Consumer Insights, Analysis, Investment Trends, Value, Segmentation, Forecast, Restraints
- India Switchgear Market Outlook (2026-2032) | Size, Share, Trends, Growth, Revenue, Forecast, Analysis, Value, Outlook
- Pakistan Contraceptive Implants Market (2025-2031) | Demand, Growth, Size, Share, Industry, Pricing Analysis, Competitive, Strategic Insights, Strategy, Consumer Insights, Analysis, Investment Trends, Opportunities, Revenue, Segments, Value, Segmentation, Supply, Forecast, Restraints, Outlook, Competition, Drivers, Trends, Companies, Challenges
Industry Events and Analyst Meet

India EV Show 2026

EV tech India Expo 2026

Auto Tech Asia 2026

Battery Tech India 2026

Smart Production Solutions Guangzhou 2026
Whitepaper
- Middle East & Africa Commercial Security Market Click here to view more.
- Middle East & Africa Fire Safety Systems & Equipment Market Click here to view more.
- GCC Drone Market Click here to view more.
- Middle East Lighting Fixture Market Click here to view more.
- GCC Physical & Perimeter Security Market Click here to view more.
6WResearch In News
- Doha a strategic location for EV manufacturing hub: IPA Qatar
- Demand for luxury TVs surging in the GCC, says Samsung
- Empowering Growth: The Thriving Journey of Bangladesh’s Cable Industry
- Demand for luxury TVs surging in the GCC, says Samsung
- Video call with a traditional healer? Once unthinkable, it’s now common in South Africa
- Intelligent Buildings To Smooth GCC’s Path To Net Zero