Croatia Cocoa butter Market (2026-2032) | Revenue, Outlook, Value, Analysis, Industry, Size, Trends, Segmentation, Companies, Share, Forecast & Growth
Market Forecast By Types (organic, conventional, deodorized), By Form (solid, Liquid), By End-user (Food Industry, Pharmaceutical Industry, Aromatherapy, Cosmetics, Personal Care Industry), By Packaging (Tins, Cartons, Plastic Containers, Paper Containers, Others), By Distribution Channel (Direct Sales, Indirect Sales) And Competitive Landscape
| Product Code: ETC4711414 | Publication Date: Nov 2023 | Updated Date: Apr 2026 | Product Type: Market Research Report | |
| Publisher: 6Wresearch | Author: Shubham Padhi | No. of Pages: 60 | No. of Figures: 30 | No. of Tables: 5 |
Croatia Cocoa Butter Market Size (2020-2030)
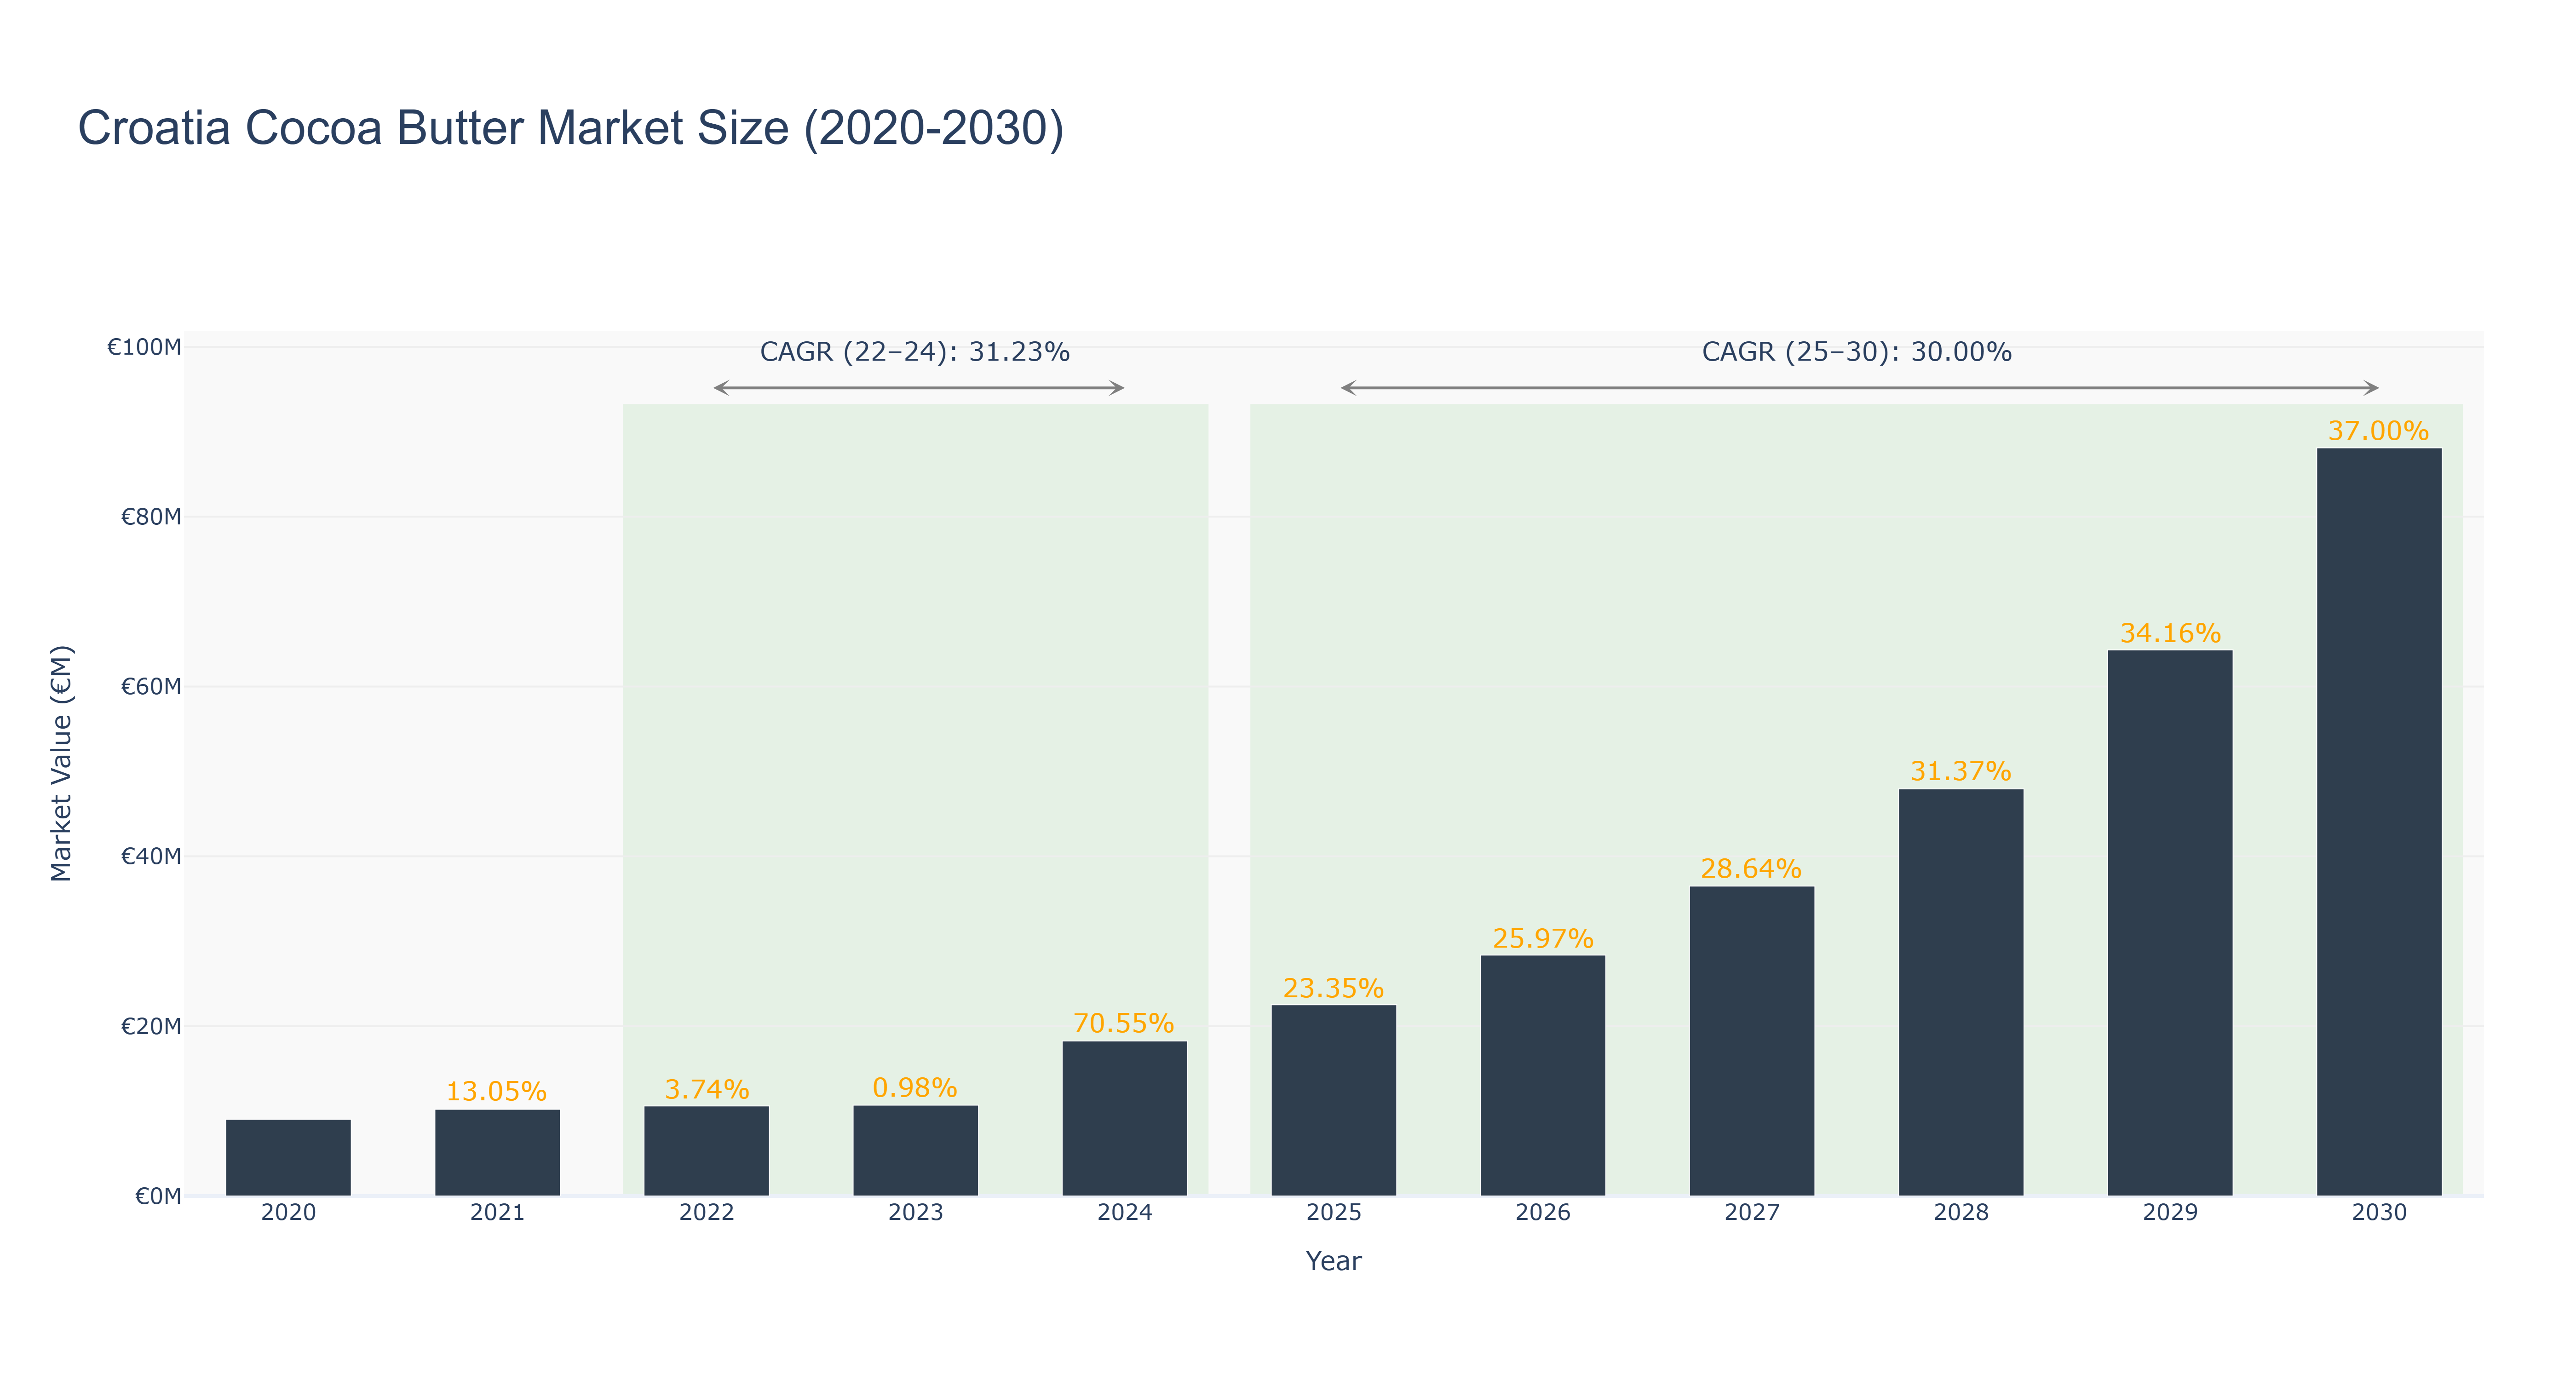
Croatia Cocoa Butter Market has shown a remarkable growth trajectory. The market size surged from €9.04 million in 2020 to €88.11 million in 2030, with a peak of €88.11 million in 2030. Notably, the market experienced significant growth spurts in 2024, expanding by 70.55%, and from 2025 to 2030, growing at a CAGR of 30.0%. The robust growth can be attributed to increasing consumer awareness of health benefits associated with cocoa butter, driving demand. Looking ahead, Croatia is set to witness a surge in cocoa butter market innovations, including sustainable sourcing practices and product diversification, ensuring sustained market growth. With a strong CAGR forecasted and industry drivers supporting the market, Croatia Cocoa Butter Market is poised for continued success in the coming years.
Croatia Cocoa Butter Market: Production & Trade Performance (2019-2025)
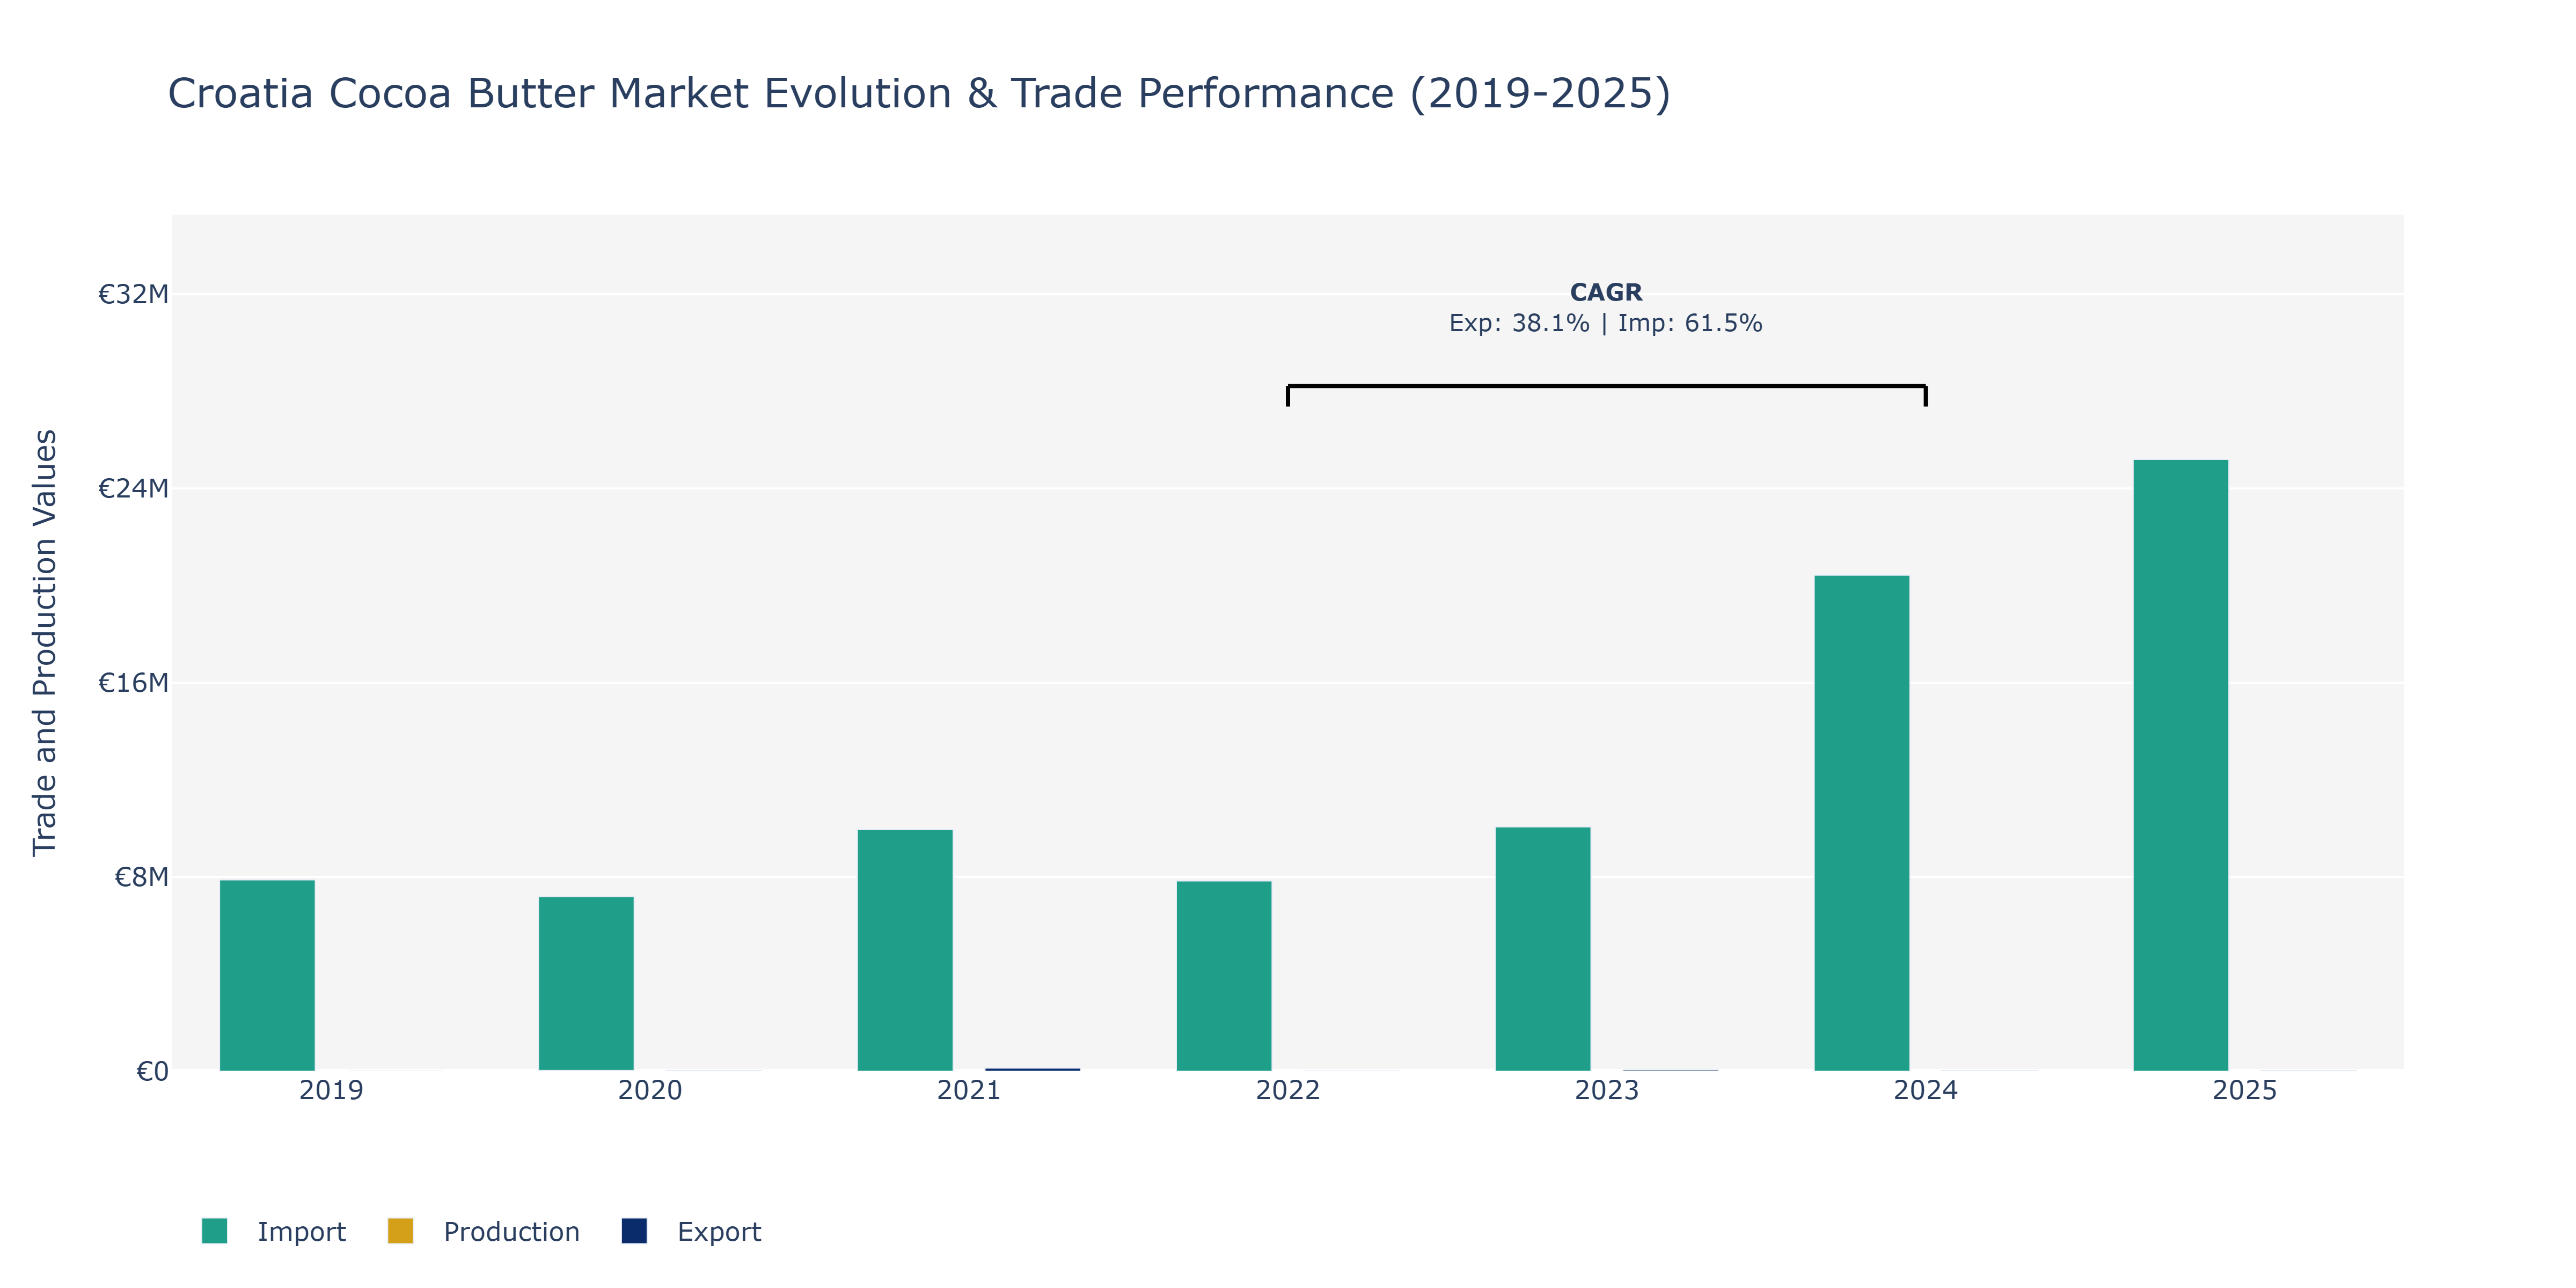
The Croatia Cocoa Butter Market exhibited notable fluctuations in Exports and Imports over the years. Exports saw a substantial increase from €6.52 thousand in 2019 to €125.49 thousand in 2021, peaking in that year. However, there was a decline in 2022 to €12.04 thousand before rebounding in 2023 to €55.74 thousand. Imports, on the other hand, experienced a consistent upward trend from €7.88 million in 2019 to €25.20 million in 2025, reaching its peak that year. Notably, Production value was available only for 2020 at €26.02 million. The surge in exports in 2021 could be attributed to increasing global demand for cocoa derivatives, while the rise in imports could be due to the country's dependence on imported raw materials for manufacturing. The fluctuations in these metrics underscore the market's sensitivity to international trade dynamics and consumer preferences.
Key Highlights of the Report:
- Croatia Cocoa butter Market Outlook
- Market Size of Croatia Cocoa butter Market, 2025
- Forecast of Croatia Cocoa butter Market, 2032
- Historical Data and Forecast of Croatia Cocoa butter Revenues & Volume for the Period 2022 - 2032F
- Croatia Cocoa butter Market Trend Evolution
- Croatia Cocoa butter Market Drivers and Challenges
- Croatia Cocoa butter Price Trends
- Croatia Cocoa butter Porter`s Five Forces
- Croatia Cocoa butter Industry Life Cycle
- Historical Data and Forecast of Croatia Cocoa butter Market Revenues & Volume By Types for the Period 2022 - 2032F
- Historical Data and Forecast of Croatia Cocoa butter Market Revenues & Volume By organic for the Period 2022 - 2032F
- Historical Data and Forecast of Croatia Cocoa butter Market Revenues & Volume By conventional for the Period 2022 - 2032F
- Historical Data and Forecast of Croatia Cocoa butter Market Revenues & Volume By deodorized for the Period 2022 - 2032F
- Historical Data and Forecast of Croatia Cocoa butter Market Revenues & Volume By Form for the Period 2022 - 2032F
- Historical Data and Forecast of Croatia Cocoa butter Market Revenues & Volume By solid for the Period 2022 - 2032F
- Historical Data and Forecast of Croatia Cocoa butter Market Revenues & Volume By Liquid for the Period 2022 - 2032F
- Historical Data and Forecast of Croatia Cocoa butter Market Revenues & Volume By End-user for the Period 2022 - 2032F
- Historical Data and Forecast of Croatia Cocoa butter Market Revenues & Volume By Food Industry for the Period 2022 - 2032F
- Historical Data and Forecast of Croatia Cocoa butter Market Revenues & Volume By Pharmaceutical Industry for the Period 2022 - 2032F
- Historical Data and Forecast of Croatia Cocoa butter Market Revenues & Volume By Aromatherapy for the Period 2022 - 2032F
- Historical Data and Forecast of Croatia Cocoa butter Market Revenues & Volume By Cosmetics for the Period 2022 - 2032F
- Historical Data and Forecast of Croatia Cocoa butter Market Revenues & Volume By Personal Care Industry for the Period 2022 - 2032F
- Historical Data and Forecast of Croatia Cocoa butter Market Revenues & Volume By Packaging for the Period 2022 - 2032F
- Historical Data and Forecast of Croatia Cocoa butter Market Revenues & Volume By Tins for the Period 2022 - 2032F
- Historical Data and Forecast of Croatia Cocoa butter Market Revenues & Volume By Cartons for the Period 2022 - 2032F
- Historical Data and Forecast of Croatia Cocoa butter Market Revenues & Volume By Plastic Containers for the Period 2022 - 2032F
- Historical Data and Forecast of Croatia Cocoa butter Market Revenues & Volume By Paper Containers for the Period 2022 - 2032F
- Historical Data and Forecast of Croatia Cocoa butter Market Revenues & Volume By Others for the Period 2022 - 2032F
- Historical Data and Forecast of Croatia Cocoa butter Market Revenues & Volume By Distribution Channel for the Period 2022 - 2032F
- Historical Data and Forecast of Croatia Cocoa butter Market Revenues & Volume By Direct Sales for the Period 2022 - 2032F
- Historical Data and Forecast of Croatia Cocoa butter Market Revenues & Volume By Indirect Sales for the Period 2022 - 2032F
- Croatia Cocoa butter Import Export Trade Statistics
- Market Opportunity Assessment By Types
- Market Opportunity Assessment By Form
- Market Opportunity Assessment By End-user
- Market Opportunity Assessment By Packaging
- Market Opportunity Assessment By Distribution Channel
- Croatia Cocoa butter Top Companies Market Share
- Croatia Cocoa butter Competitive Benchmarking By Technical and Operational Parameters
- Croatia Cocoa butter Company Profiles
- Croatia Cocoa butter Key Strategic Recommendations
Frequently Asked Questions About the Market Study (FAQs):
6Wresearch actively monitors the Croatia Cocoa butter Market and publishes its comprehensive annual report, highlighting emerging trends, growth drivers, revenue analysis, and forecast outlook. Our insights help businesses to make data-backed strategic decisions with ongoing market dynamics. Our analysts track relevent industries related to the Croatia Cocoa butter Market, allowing our clients with actionable intelligence and reliable forecasts tailored to emerging regional needs.
Yes, we provide customisation as per your requirements. To learn more, feel free to contact us on sales@6wresearch.com
1 Executive Summary |
2 Introduction |
2.1 Key Highlights of the Report |
2.2 Report Description |
2.3 Market Scope & Segmentation |
2.4 Research Methodology |
2.5 Assumptions |
3 Croatia Cocoa butter Market Overview |
3.1 Croatia Country Macro Economic Indicators |
3.2 Croatia Cocoa butter Market Revenues & Volume, 2022 & 2032F |
3.3 Croatia Cocoa butter Market - Industry Life Cycle |
3.4 Croatia Cocoa butter Market - Porter's Five Forces |
3.5 Croatia Cocoa butter Market Revenues & Volume Share Segmentations, 2022 & 2032F |
3.6 Croatia Cocoa butter Market Revenues & Volume Share, By Form, 2022 & 2032F |
3.7 Croatia Cocoa butter Market Revenues & Volume Share, By End-user, 2022 & 2032F |
3.8 Croatia Cocoa butter Market Revenues & Volume Share, By Packaging, 2022 & 2032F |
3.9 Croatia Cocoa butter Market Revenues & Volume Share, By Distribution Channel, 2022 & 2032F |
4 Croatia Cocoa butter Market Dynamics |
4.1 Impact Analysis |
4.2 Market Drivers |
4.2.1 Growing consumer awareness about the health benefits of cocoa butter |
4.2.2 Increasing demand for natural and organic cosmetic products containing cocoa butter |
4.2.3 Rising disposable income leading to higher spending on premium skincare products |
4.3 Market Restraints |
4.3.1 Fluctuating prices of raw cocoa beans impacting the production cost of cocoa butter |
4.3.2 Limited availability of high-quality cocoa beans in Croatia |
4.3.3 Competition from alternative plant-based butters in the skincare industry |
5 Croatia Cocoa butter Market Trends |
6 Croatia Cocoa butter Market Segmentations |
6.1 Croatia Cocoa butter Market Segmentations |
6.1.1 Overview and Analysis |
6.1.2 Croatia Cocoa butter Market Revenues & Volume, By organic, 2022 - 2032F |
6.1.3 Croatia Cocoa butter Market Revenues & Volume, By conventional, 2022 - 2032F |
6.1.4 Croatia Cocoa butter Market Revenues & Volume, By deodorized, 2022 - 2032F |
6.2 Croatia Cocoa butter Market, By Form |
6.2.1 Overview and Analysis |
6.2.2 Croatia Cocoa butter Market Revenues & Volume, By solid, 2022 - 2032F |
6.2.3 Croatia Cocoa butter Market Revenues & Volume, By Liquid, 2022 - 2032F |
6.3 Croatia Cocoa butter Market, By End-user |
6.3.1 Overview and Analysis |
6.3.2 Croatia Cocoa butter Market Revenues & Volume, By Food Industry, 2022 - 2032F |
6.3.3 Croatia Cocoa butter Market Revenues & Volume, By Pharmaceutical Industry, 2022 - 2032F |
6.3.4 Croatia Cocoa butter Market Revenues & Volume, By Aromatherapy, 2022 - 2032F |
6.3.5 Croatia Cocoa butter Market Revenues & Volume, By Cosmetics, 2022 - 2032F |
6.3.6 Croatia Cocoa butter Market Revenues & Volume, By Personal Care Industry, 2022 - 2032F |
6.4 Croatia Cocoa butter Market, By Packaging |
6.4.1 Overview and Analysis |
6.4.2 Croatia Cocoa butter Market Revenues & Volume, By Tins, 2022 - 2032F |
6.4.3 Croatia Cocoa butter Market Revenues & Volume, By Cartons, 2022 - 2032F |
6.4.4 Croatia Cocoa butter Market Revenues & Volume, By Plastic Containers, 2022 - 2032F |
6.4.5 Croatia Cocoa butter Market Revenues & Volume, By Paper Containers, 2022 - 2032F |
6.4.6 Croatia Cocoa butter Market Revenues & Volume, By Others, 2022 - 2032F |
6.5 Croatia Cocoa butter Market, By Distribution Channel |
6.5.1 Overview and Analysis |
6.5.2 Croatia Cocoa butter Market Revenues & Volume, By Direct Sales, 2022 - 2032F |
6.5.3 Croatia Cocoa butter Market Revenues & Volume, By Indirect Sales, 2022 - 2032F |
7 Croatia Cocoa butter Market Import-Export Trade Statistics |
7.1 Croatia Cocoa butter Market Export to Major Countries |
7.2 Croatia Cocoa butter Market Imports from Major Countries |
8 Croatia Cocoa butter Market Key Performance Indicators |
8.1 Percentage of consumers choosing natural and organic skincare products |
8.2 Average selling price of cocoa butter-based cosmetic products |
8.3 Number of new product launches containing cocoa butter in the skincare market |
9 Croatia Cocoa butter Market - Opportunity Assessment |
9.1 Croatia Cocoa butter Market Opportunity Assessment Segmentations, 2022 & 2032F |
9.2 Croatia Cocoa butter Market Opportunity Assessment, By Form, 2022 & 2032F |
9.3 Croatia Cocoa butter Market Opportunity Assessment, By End-user, 2022 & 2032F |
9.4 Croatia Cocoa butter Market Opportunity Assessment, By Packaging, 2022 & 2032F |
9.5 Croatia Cocoa butter Market Opportunity Assessment, By Distribution Channel, 2022 & 2032F |
10 Croatia Cocoa butter Market - Competitive Landscape |
10.1 Croatia Cocoa butter Market Revenue Share, By Companies, 2025 |
10.2 Croatia Cocoa butter Market Competitive Benchmarking, By Operating and Technical Parameters |
11 Company Profiles |
12 Recommendations | 13 Disclaimer |
Global Go To Market Strategy - 2030
Export potential enables firms to identify high-growth global markets with greater confidence by combining advanced trade intelligence with a structured quantitative methodology. The framework analyzes emerging demand trends and country-level import patterns while integrating macroeconomic and trade datasets such as GDP and population forecasts, bilateral import–export flows, tariff structures, elasticity differentials between developed and developing economies, geographic distance, and import demand projections. Using weighted trade values from 2020–2024 as the base period to project country-to-country export potential for 2030, these inputs are operationalized through calculated drivers such as gravity model parameters, tariff impact factors, and projected GDP per-capita growth. Through an analysis of hidden potentials, demand hotspots, and market conditions that are most favorable to success, this method enables firms to focus on target countries, maximize returns, and global expansion with data, backed by accuracy.
By factoring in the projected importer demand gap that is currently unmet and could be potential opportunity, it identifies the potential for the Exporter (Country) among 190 countries, against the general trade analysis, which identifies the biggest importer or exporter.
To discover high-growth global markets and optimize your business strategy:
Click Here
Pricing
- Single User License$ 1,995
- Department License$ 2,400
- Site License$ 3,120
- Global License$ 3,795

Leadership Perspectives from Industry Events
Search
Thought Leadership and Analyst Meet


Our Clients
6WResearch In News
- India Export Attractiveness Tracker 2026
- India Air Conditioner Market Set for Strong Rebound in 2026 After Weather-Led Correction and GST-Driven Recovery: 6Wresearch
- ADAS in India: How Automatic Emergency Braking, Blind Spot Detection & Driver Monitoring are Transforming Road Safety
- Doha a strategic location for EV manufacturing hub: IPA Qatar
- Demand for luxury TVs surging in the GCC, says Samsung
- Empowering Growth: The Thriving Journey of Bangladesh’s Cable Industry
Latest Reports
- Nicaragua RPG Gaming Market (2026-2032)
- New Zealand RPG Gaming Market (2026-2032)
- Netherlands RPG Gaming Market (2026-2032)
- Nauru RPG Gaming Market (2026-2032)
- Namibia RPG Gaming Market (2026-2032)
- Mozambique RPG Gaming Market (2026-2032)
- Montenegro RPG Gaming Market (2026-2032)
- Mongolia RPG Gaming Market (2026-2032)
- Monaco RPG Gaming Market (2026-2032)
- Micronesia RPG Gaming Market (2026-2032)
Industry Events and Analyst Meet

EV India Expo 2026

HIMTEX 2026

India Refining Summit 2026

India EV Show 2026

EV tech India Expo 2026
Whitepaper
- Middle East & Africa Commercial Security Market Click here to view more.
- Middle East & Africa Fire Safety Systems & Equipment Market Click here to view more.
- GCC Drone Market Click here to view more.
- Middle East Lighting Fixture Market Click here to view more.
- GCC Physical & Perimeter Security Market Click here to view more.