Croatia Coffee Pods Capsules Market (2026-2032) | Competitive, Industry, Analysis, Trends, Drivers, Size, Strategic Insights, Segments, Opportunities, Companies, Outlook, Consumer Insights, Demand, Value, Challenges, Revenue, Strategy, Supply, Investment Trends, Restraints, Share, Competition, Forecast, Growth, Pricing Analysis, Segmentation
Market Forecast By Material (Aluminum, Compostable, PBT Plastic), By Distribution Channel (Online, Offline) And Competitive Landscape
| Product Code: ETC11616149 | Publication Date: Apr 2025 | Updated Date: Apr 2026 | Product Type: Market Research Report | |
| Publisher: 6Wresearch | Author: Bhawna Singh | No. of Pages: 65 | No. of Figures: 34 | No. of Tables: 19 |
Croatia Coffee Pods Capsules Market Size (2020-2030)
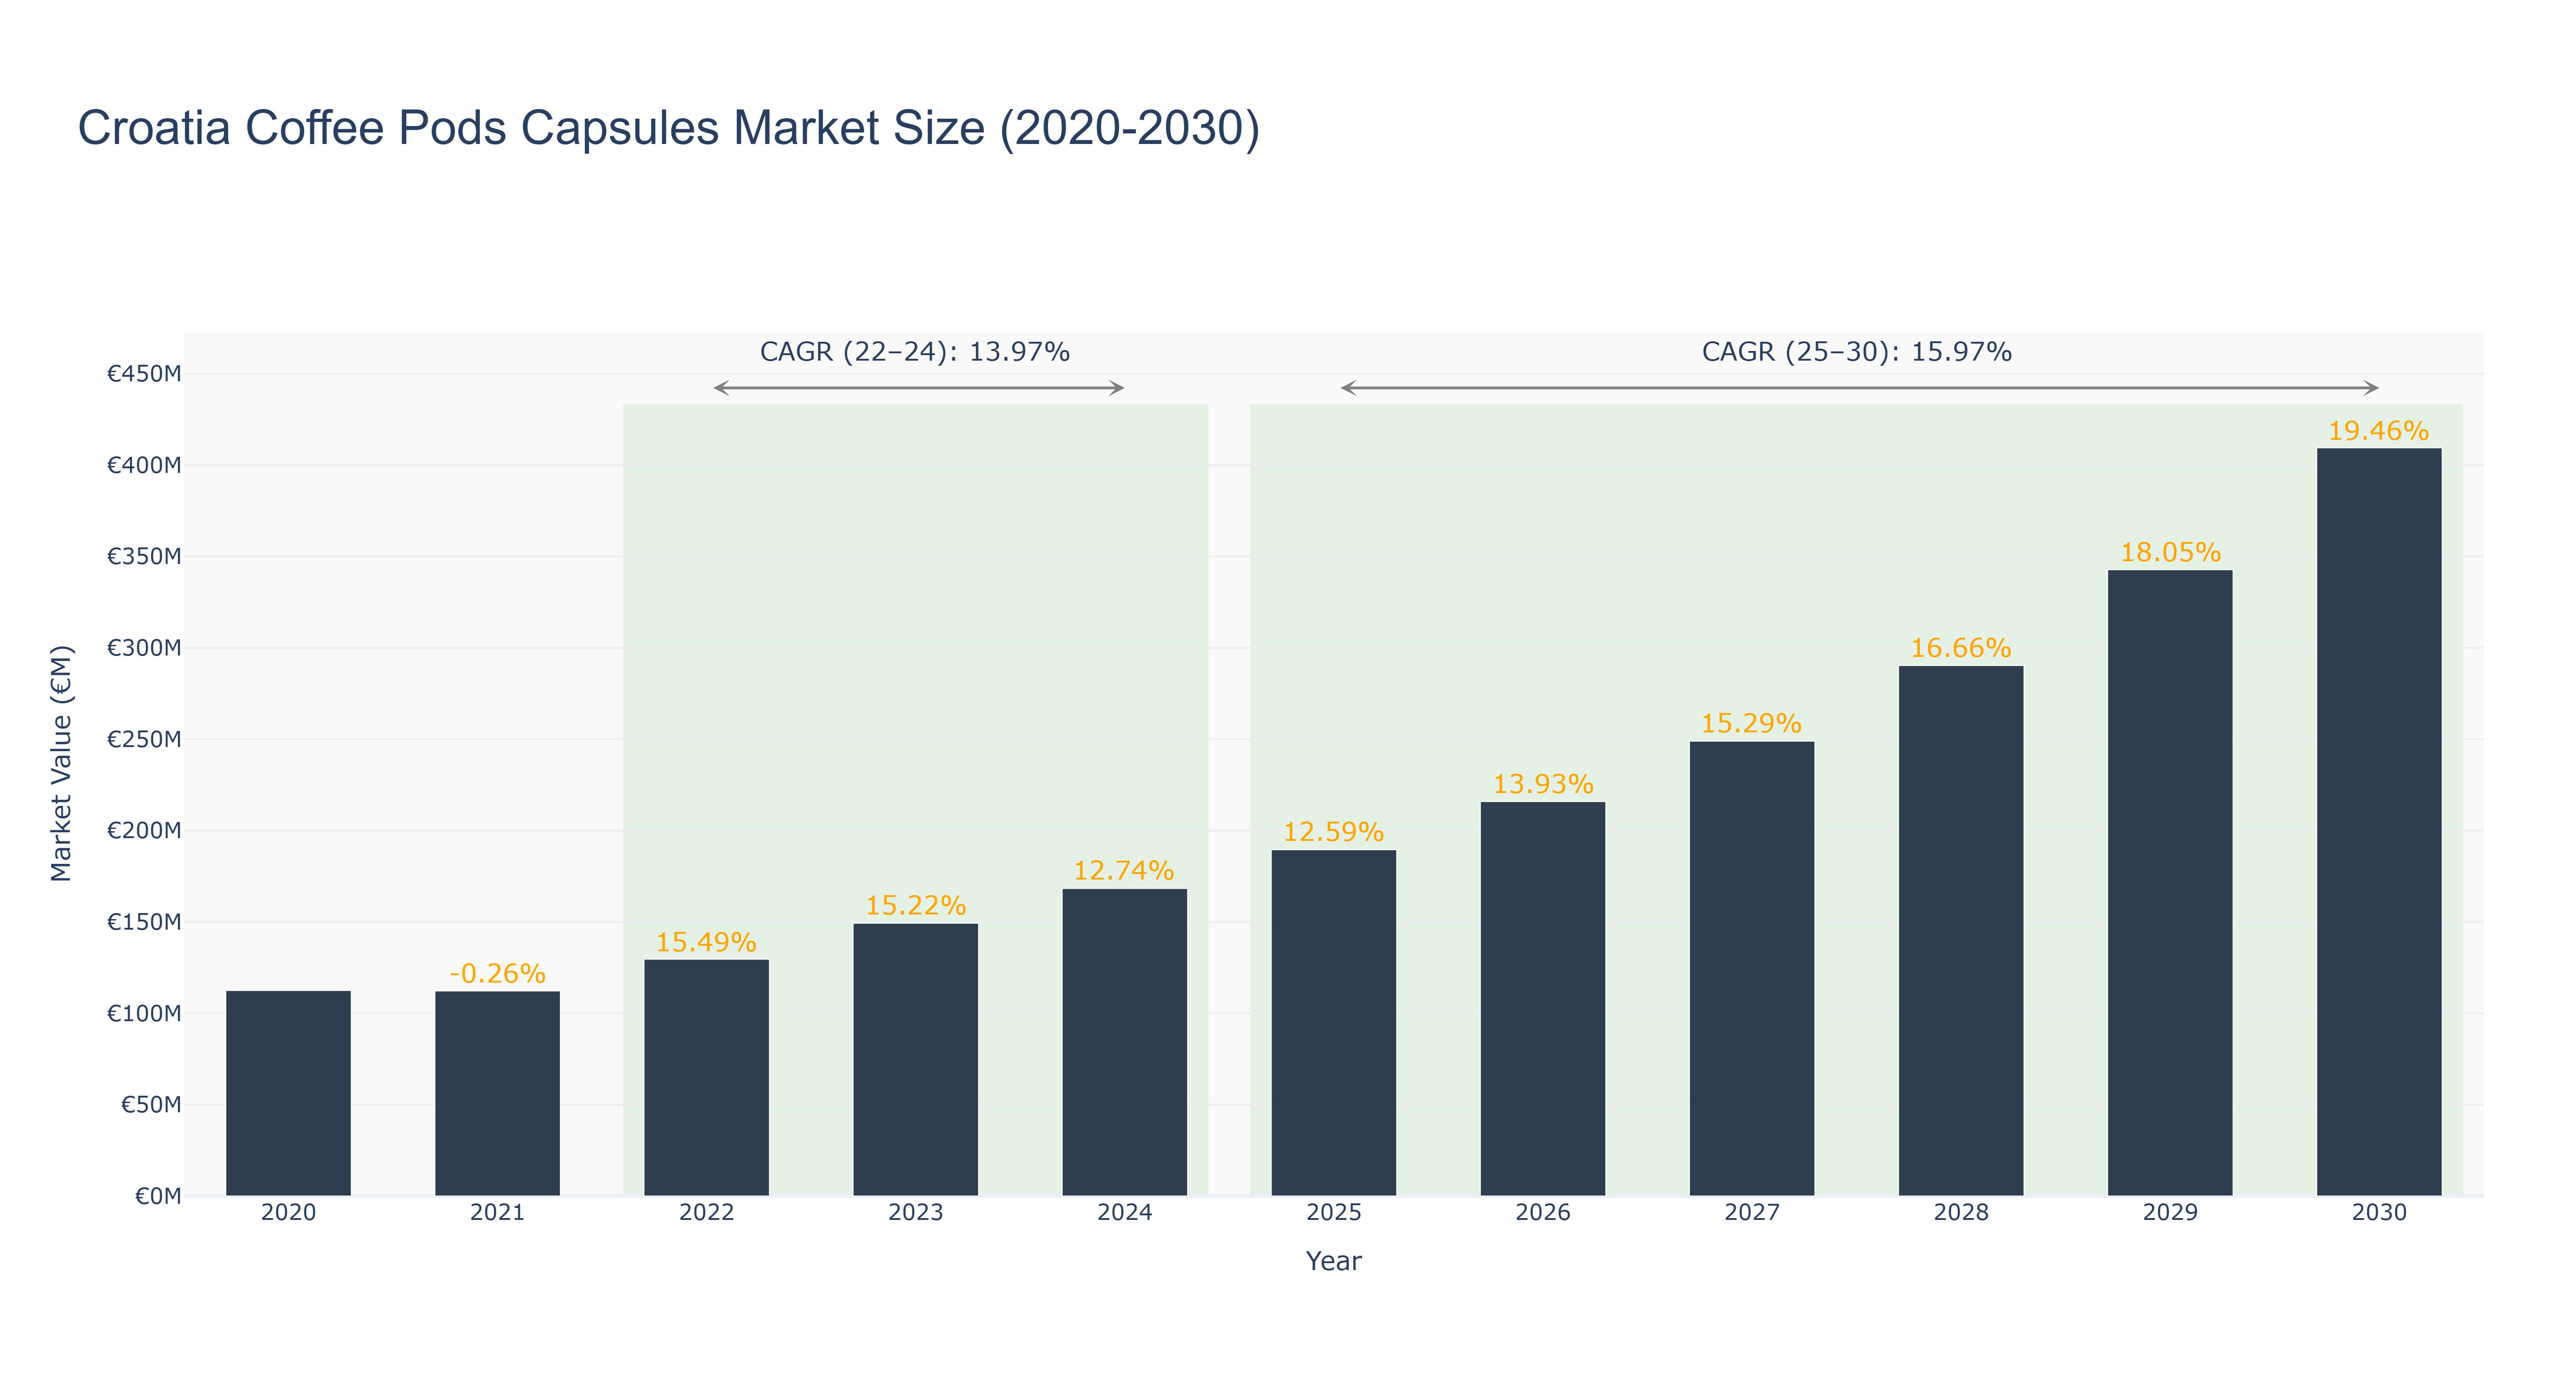
The Croatia Coffee Pods Capsules Market has shown a steady growth trajectory over the years. The peak market size was recorded in 2030 at €409.47 million. From 2020 to 2024, the market size increased from €112.49 million to €168.31 million, indicating a positive trend. The forecasted market size from 2025 to 2030 is expected to continue this growth, with a CAGR of 15.97%. The CAGR from 2022 to 2024 was 13.97%. The market's growth can be attributed to the increasing consumer preference for convenience and premium coffee products, driving the demand for coffee pods and capsules. Looking ahead, the market is likely to witness further expansion with the introduction of eco-friendly packaging solutions and innovative flavor offerings to cater to evolving consumer preferences.
Croatia Coffee Pods Capsules Market: Production & Trade Performance (2019-2025)
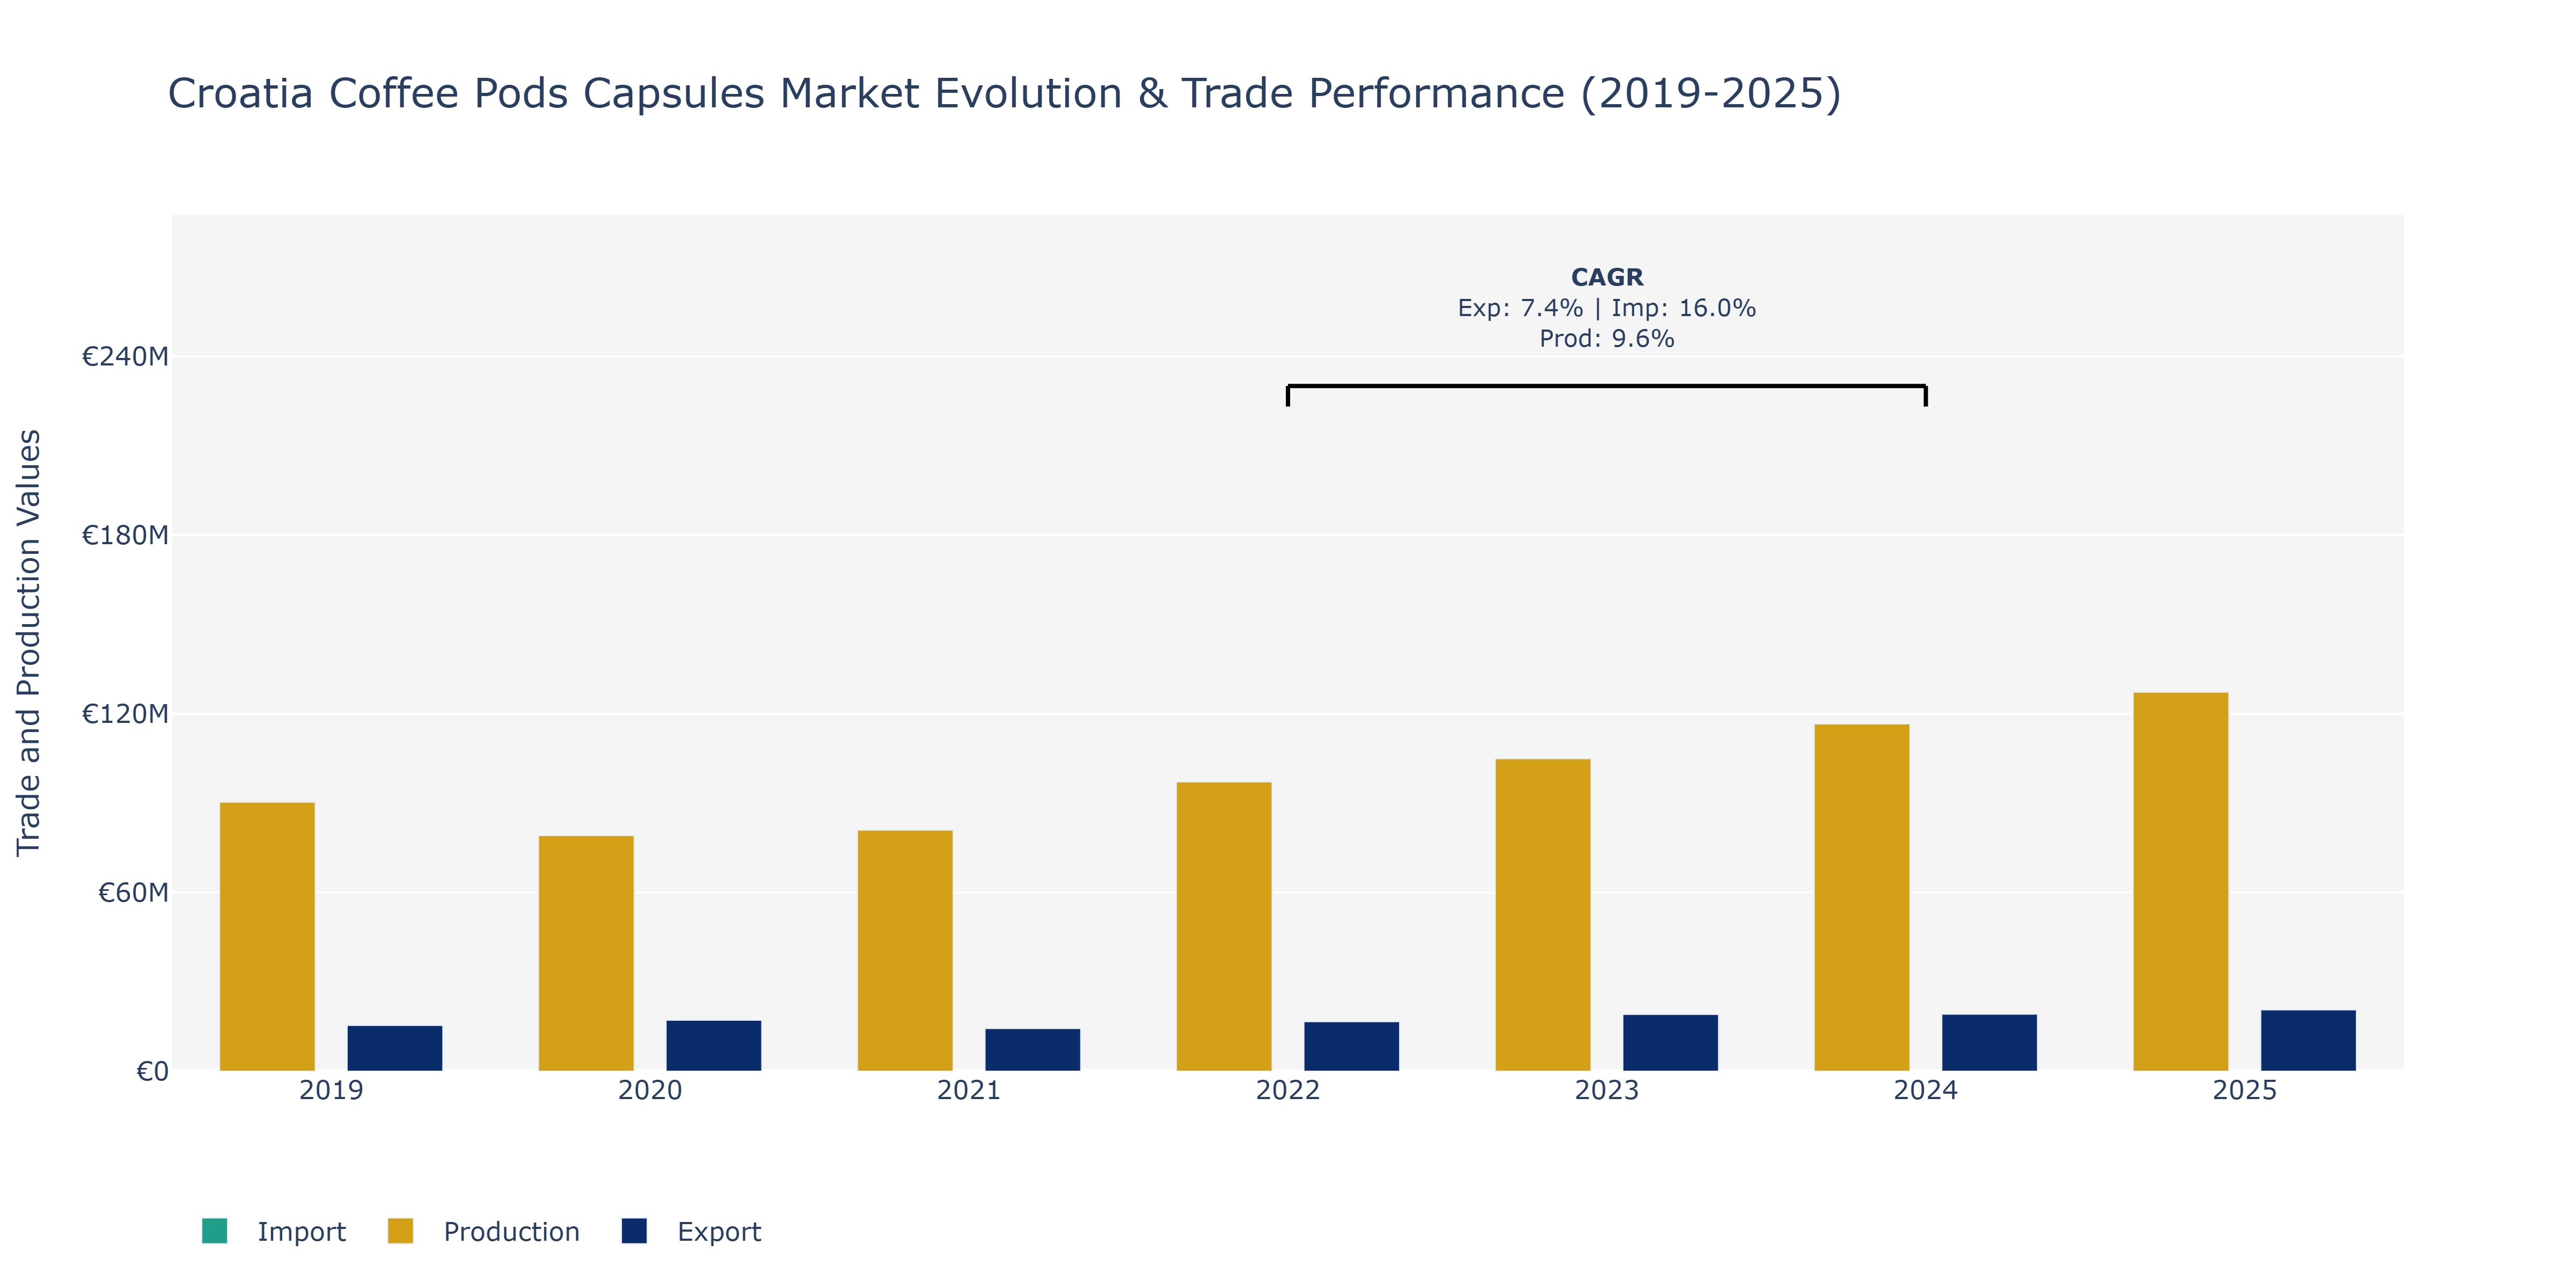
In the Croatia Coffee Pods Capsules Market, a noticeable fluctuation in key metrics is observed over the years. From 2019 to 2020, exports increased from €15.37 million to €17.14 million, showcasing a positive trend before a slight decline in 2021 to €14.31 million. However, the trend reversed in the following years, with exports steadily rising to peak at €20.59 million in 2025. Imports displayed a consistent upward trajectory, growing from €36.04 million in 2019 to €78.15 million in 2025, reflecting a growing demand for foreign coffee products. On the production front, there was a steady increase from €90.31 million in 2019 to €127.29 million in 2025, indicating a robust domestic manufacturing sector. The market's export growth may be attributed to increased international demand for Croatian coffee pods, potentially influenced by the country's reputation for quality coffee beans and innovative product offerings in the global market. The surge in imports could be linked to evolving consumer preferences for a diverse range of coffee pod flavors and varieties not readily available domestically, prompting higher import volumes. Additionally, the continuous expansion of the production sector could be a strategic response to both domestic and international market growth, with manufacturers scaling up to meet rising demand while ensuring product quality and innovation to stay competitive in the evolving market landscape.
Key Highlights of the Report:
- Croatia Coffee Pods Capsules Market Outlook
- Market Size of Croatia Coffee Pods Capsules Market, 2025
- Forecast of Croatia Coffee Pods Capsules Market, 2032
- Historical Data and Forecast of Croatia Coffee Pods Capsules Revenues & Volume for the Period 2022 - 2032F
- Croatia Coffee Pods Capsules Market Trend Evolution
- Croatia Coffee Pods Capsules Market Drivers and Challenges
- Croatia Coffee Pods Capsules Price Trends
- Croatia Coffee Pods Capsules Porter's Five Forces
- Croatia Coffee Pods Capsules Industry Life Cycle
- Historical Data and Forecast of Croatia Coffee Pods Capsules Market Revenues & Volume By Material for the Period 2022 - 2032F
- Historical Data and Forecast of Croatia Coffee Pods Capsules Market Revenues & Volume By Aluminum for the Period 2022 - 2032F
- Historical Data and Forecast of Croatia Coffee Pods Capsules Market Revenues & Volume By Compostable for the Period 2022 - 2032F
- Historical Data and Forecast of Croatia Coffee Pods Capsules Market Revenues & Volume By PBT Plastic for the Period 2022 - 2032F
- Historical Data and Forecast of Croatia Coffee Pods Capsules Market Revenues & Volume By Distribution Channel for the Period 2022 - 2032F
- Historical Data and Forecast of Croatia Coffee Pods Capsules Market Revenues & Volume By Online for the Period 2022 - 2032F
- Historical Data and Forecast of Croatia Coffee Pods Capsules Market Revenues & Volume By Offline for the Period 2022 - 2032F
- Croatia Coffee Pods Capsules Import Export Trade Statistics
- Market Opportunity Assessment By Material
- Market Opportunity Assessment By Distribution Channel
- Croatia Coffee Pods Capsules Top Companies Market Share
- Croatia Coffee Pods Capsules Competitive Benchmarking By Technical and Operational Parameters
- Croatia Coffee Pods Capsules Company Profiles
- Croatia Coffee Pods Capsules Key Strategic Recommendations
Frequently Asked Questions About the Market Study (FAQs):
6Wresearch actively monitors the Croatia Coffee Pods Capsules Market and publishes its comprehensive annual report, highlighting emerging trends, growth drivers, revenue analysis, and forecast outlook. Our insights help businesses to make data-backed strategic decisions with ongoing market dynamics. Our analysts track relevent industries related to the Croatia Coffee Pods Capsules Market, allowing our clients with actionable intelligence and reliable forecasts tailored to emerging regional needs.
Yes, we provide customisation as per your requirements. To learn more, feel free to contact us on sales@6wresearch.com
1 Executive Summary |
2 Introduction |
2.1 Key Highlights of the Report |
2.2 Report Description |
2.3 Market Scope & Segmentation |
2.4 Research Methodology |
2.5 Assumptions |
3 Croatia Coffee Pods Capsules Market Overview |
3.1 Croatia Country Macro Economic Indicators |
3.2 Croatia Coffee Pods Capsules Market Revenues & Volume, 2022 & 2032F |
3.3 Croatia Coffee Pods Capsules Market - Industry Life Cycle |
3.4 Croatia Coffee Pods Capsules Market - Porter's Five Forces |
3.5 Croatia Coffee Pods Capsules Market Revenues & Volume Share, By Material, 2022 & 2032F |
3.6 Croatia Coffee Pods Capsules Market Revenues & Volume Share, By Distribution Channel, 2022 & 2032F |
4 Croatia Coffee Pods Capsules Market Dynamics |
4.1 Impact Analysis |
4.2 Market Drivers |
4.2.1 Increasing consumer preference for convenience and on-the-go consumption |
4.2.2 Rising adoption of coffee culture and specialty coffee trends in Croatia |
4.2.3 Growing awareness about environmental sustainability leading to a shift towards eco-friendly coffee pod options |
4.3 Market Restraints |
4.3.1 Price sensitivity among consumers due to higher cost of coffee pods compared to traditional coffee brewing methods |
4.3.2 Competition from traditional coffee shops and cafes impacting the market growth |
4.3.3 Lack of awareness about the benefits and variety of coffee pod options available in the market |
5 Croatia Coffee Pods Capsules Market Trends |
6 Croatia Coffee Pods Capsules Market, By Types |
6.1 Croatia Coffee Pods Capsules Market, By Material |
6.1.1 Overview and Analysis |
6.1.2 Croatia Coffee Pods Capsules Market Revenues & Volume, By Material, 2022 - 2032F |
6.1.3 Croatia Coffee Pods Capsules Market Revenues & Volume, By Aluminum, 2022 - 2032F |
6.1.4 Croatia Coffee Pods Capsules Market Revenues & Volume, By Compostable, 2022 - 2032F |
6.1.5 Croatia Coffee Pods Capsules Market Revenues & Volume, By PBT Plastic, 2022 - 2032F |
6.2 Croatia Coffee Pods Capsules Market, By Distribution Channel |
6.2.1 Overview and Analysis |
6.2.2 Croatia Coffee Pods Capsules Market Revenues & Volume, By Online, 2022 - 2032F |
6.2.3 Croatia Coffee Pods Capsules Market Revenues & Volume, By Offline, 2022 - 2032F |
7 Croatia Coffee Pods Capsules Market Import-Export Trade Statistics |
7.1 Croatia Coffee Pods Capsules Market Export to Major Countries |
7.2 Croatia Coffee Pods Capsules Market Imports from Major Countries |
8 Croatia Coffee Pods Capsules Market Key Performance Indicators |
8.1 Percentage of organic or sustainably sourced coffee pods in the market |
8.2 Consumer engagement with coffee pod brands on social media platforms |
8.3 Number of new product launches and innovations in the coffee pods market |
8.4 Average time spent by consumers on online coffee pod purchasing platforms |
8.5 Percentage of repeat purchases by customers for coffee pod products |
9 Croatia Coffee Pods Capsules Market - Opportunity Assessment |
9.1 Croatia Coffee Pods Capsules Market Opportunity Assessment, By Material, 2022 & 2032F |
9.2 Croatia Coffee Pods Capsules Market Opportunity Assessment, By Distribution Channel, 2022 & 2032F |
10 Croatia Coffee Pods Capsules Market - Competitive Landscape |
10.1 Croatia Coffee Pods Capsules Market Revenue Share, By Companies, 2025 |
10.2 Croatia Coffee Pods Capsules Market Competitive Benchmarking, By Operating and Technical Parameters |
11 Company Profiles |
12 Recommendations |
13 Disclaimer |
Global Go To Market Strategy - 2030
Export potential enables firms to identify high-growth global markets with greater confidence by combining advanced trade intelligence with a structured quantitative methodology. The framework analyzes emerging demand trends and country-level import patterns while integrating macroeconomic and trade datasets such as GDP and population forecasts, bilateral import–export flows, tariff structures, elasticity differentials between developed and developing economies, geographic distance, and import demand projections. Using weighted trade values from 2020–2024 as the base period to project country-to-country export potential for 2030, these inputs are operationalized through calculated drivers such as gravity model parameters, tariff impact factors, and projected GDP per-capita growth. Through an analysis of hidden potentials, demand hotspots, and market conditions that are most favorable to success, this method enables firms to focus on target countries, maximize returns, and global expansion with data, backed by accuracy.
By factoring in the projected importer demand gap that is currently unmet and could be potential opportunity, it identifies the potential for the Exporter (Country) among 190 countries, against the general trade analysis, which identifies the biggest importer or exporter.
To discover high-growth global markets and optimize your business strategy:
Click Here
Pricing
- Single User License$ 1,995
- Department License$ 2,400
- Site License$ 3,120
- Global License$ 3,795

Leadership Perspectives from Industry Events
Search
Thought Leadership and Analyst Meet


Our Clients
6WResearch In News
- Doha a strategic location for EV manufacturing hub: IPA Qatar
- Demand for luxury TVs surging in the GCC, says Samsung
- Empowering Growth: The Thriving Journey of Bangladesh’s Cable Industry
- Demand for luxury TVs surging in the GCC, says Samsung
- Video call with a traditional healer? Once unthinkable, it’s now common in South Africa
- Intelligent Buildings To Smooth GCC’s Path To Net Zero
Latest Reports
- New Zealand Aseptic Manufacturing Market (2026-2032)
- Netherlands Aseptic Manufacturing Market (2026-2032)
- Nauru Aseptic Manufacturing Market (2026-2032)
- Namibia Aseptic Manufacturing Market (2026-2032)
- Mozambique Aseptic Manufacturing Market (2026-2032)
- Montenegro Aseptic Manufacturing Market (2026-2032)
- Mongolia Aseptic Manufacturing Market (2026-2032)
- Monaco Aseptic Manufacturing Market (2026-2032)
- Micronesia Aseptic Manufacturing Market (2026-2032)
- Mauritius Aseptic Manufacturing Market (2026-2032)
Industry Events and Analyst Meet

HIMTEX 2026

India Refining Summit 2026

India EV Show 2026

EV tech India Expo 2026

Auto Tech Asia 2026
Whitepaper
- Middle East & Africa Commercial Security Market Click here to view more.
- Middle East & Africa Fire Safety Systems & Equipment Market Click here to view more.
- GCC Drone Market Click here to view more.
- Middle East Lighting Fixture Market Click here to view more.
- GCC Physical & Perimeter Security Market Click here to view more.