Croatia Cryogenic Valve Market (2025-2031) | Trends, Industry, Share, Segmentation, Forecast, Revenue, Value, Size, Companies, Growth, Outlook & Analysis
Market Forecast By Gas (LNG, Oxygen, Nitrogen), By Type (Globe, Gate, Ball), By End-User (Energy & Power, Food, Chemicals) And Competitive Landscape
| Product Code: ETC5775528 | Publication Date: Nov 2023 | Updated Date: Oct 2025 | Product Type: Market Research Report | |
| Publisher: 6Wresearch | Author: Sumit Sagar | No. of Pages: 60 | No. of Figures: 30 | No. of Tables: 5 |
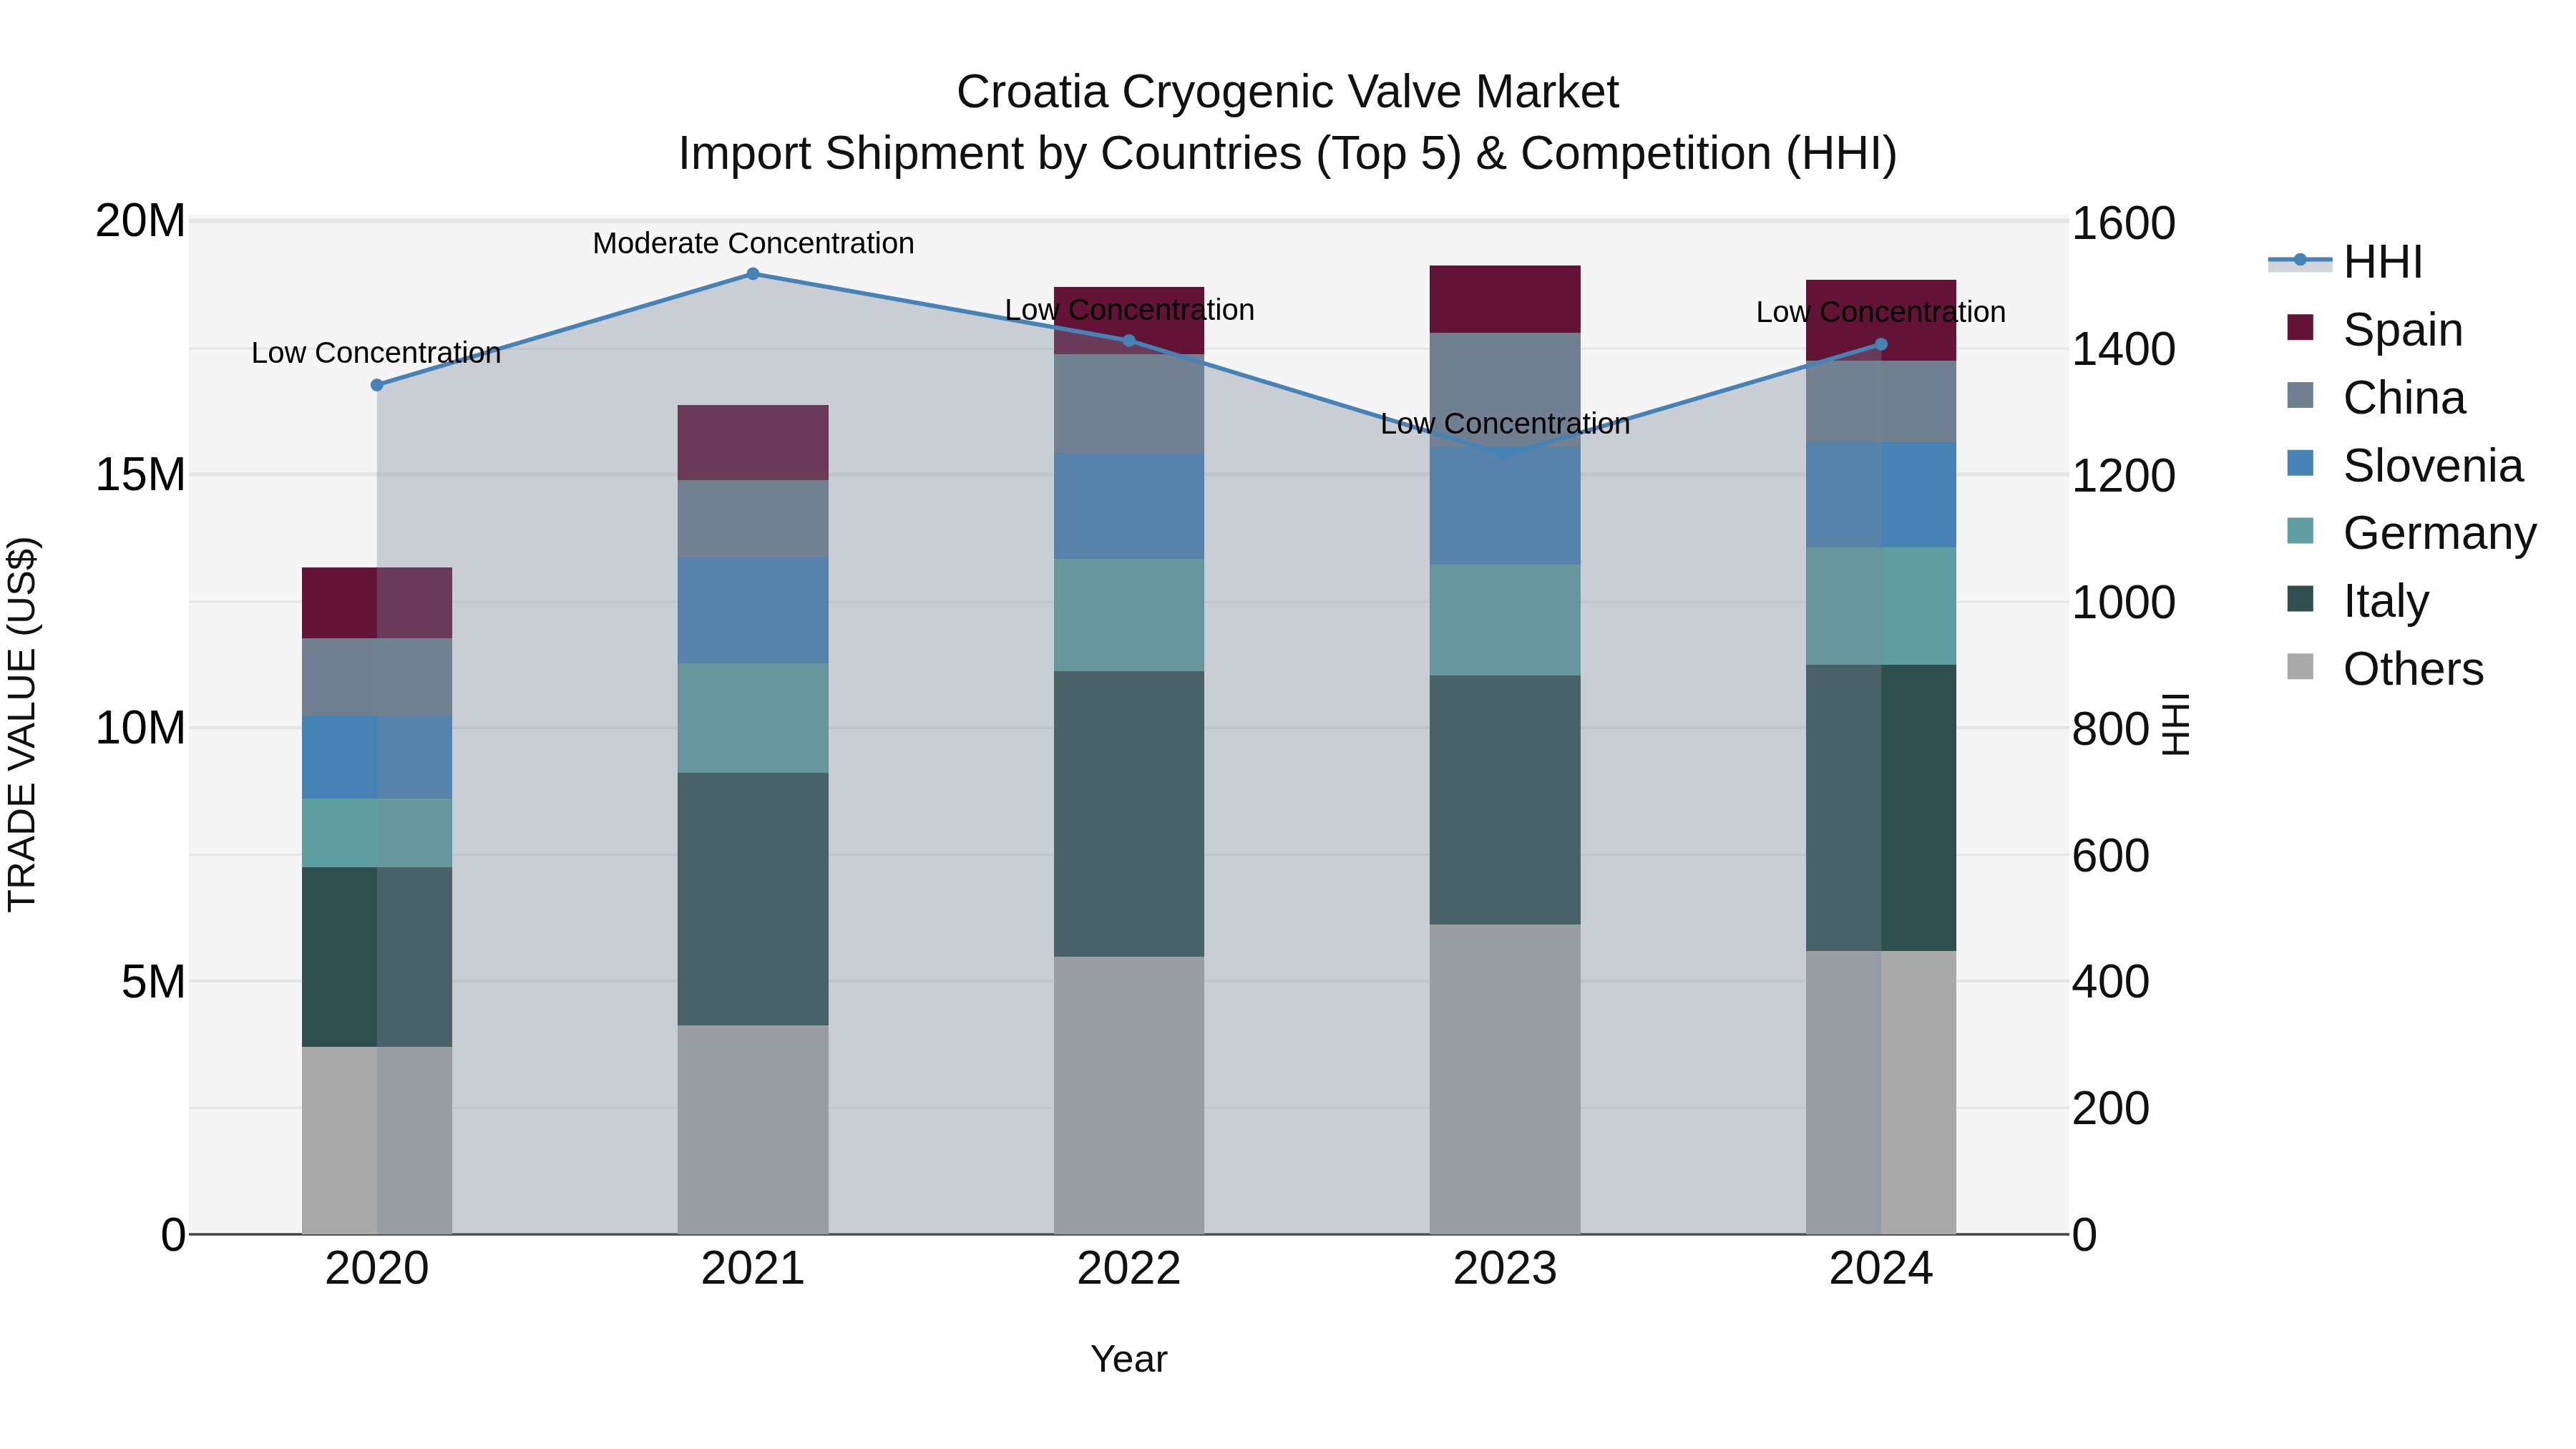
Croatia Cryogenic Valve Market Top 5 Importing Countries and Market Competition (HHI) Analysis
In 2024, Croatia continued to see a steady increase in cryogenic valve imports, with top exporting countries being Italy, Germany, Slovenia, China, and Spain. The market remained competitive with a low Herfindahl-Hirschman Index (HHI) concentration, indicating a diverse range of suppliers. The compound annual growth rate (CAGR) from 2020 to 2024 was strong at 9.37%, although there was a slight decline in growth rate from 2023 to 2024 at -1.49%. This data suggests a stable and growing market for cryogenic valve imports in Croatia, with opportunities for further expansion and diversification in the coming years.
Croatia Cryogenic Valve Market Overview
The cryogenic valve market in Croatia focuses on valves designed for use in cryogenic applications, including the control and regulation of cryogenic fluids. These valves are crucial for maintaining safe and efficient operations in various industries. The market is driven by advancements in valve technologies, the growth of the cryogenic industry, and trends in industrial applications.
Drivers of the market
The cryogenic valve market in Croatia benefits from the growing need for reliable and efficient valves designed to operate at extremely low temperatures in cryogenic systems. Cryogenic valves are essential for controlling the flow of cryogenic liquids and gases in various applications, including energy production and aerospace. The rise in industrial activities, advancements in valve technologies, and the focus on improving system performance and safety drive market demand. Additionally, the growth of the energy and aerospace sectors in Croatia supports market expansion.
Challenges of the market
The cryogenic valve market in Croatia faces hurdles related to the high precision required for valve manufacturing, which raises production costs. Additionally, the limited local demand for cryogenic applications and reliance on imported valves slow market growth.
Government Policy of the market
The Croatian government regulates the cryogenic valve market to ensure the safety and efficiency of valves used in cryogenic systems. Policies include standards for product performance, safety, and environmental compliance. The government supports innovation in cryogenic valve technologies through research funding and provides incentives for businesses developing advanced and reliable solutions.
Key Highlights of the Report:
- Croatia Cryogenic Valve Market Outlook
- Market Size of Croatia Cryogenic Valve Market, 2024
- Forecast of Croatia Cryogenic Valve Market, 2031
- Historical Data and Forecast of Croatia Cryogenic Valve Revenues & Volume for the Period 2021-2031
- Croatia Cryogenic Valve Market Trend Evolution
- Croatia Cryogenic Valve Market Drivers and Challenges
- Croatia Cryogenic Valve Price Trends
- Croatia Cryogenic Valve Porter`s Five Forces
- Croatia Cryogenic Valve Industry Life Cycle
- Historical Data and Forecast of Croatia Cryogenic Valve Market Revenues & Volume By Gas for the Period 2021-2031
- Historical Data and Forecast of Croatia Cryogenic Valve Market Revenues & Volume By LNG for the Period 2021-2031
- Historical Data and Forecast of Croatia Cryogenic Valve Market Revenues & Volume By Oxygen for the Period 2021-2031
- Historical Data and Forecast of Croatia Cryogenic Valve Market Revenues & Volume By Nitrogen for the Period 2021-2031
- Historical Data and Forecast of Croatia Cryogenic Valve Market Revenues & Volume By Type for the Period 2021-2031
- Historical Data and Forecast of Croatia Cryogenic Valve Market Revenues & Volume By Globe for the Period 2021-2031
- Historical Data and Forecast of Croatia Cryogenic Valve Market Revenues & Volume By Gate for the Period 2021-2031
- Historical Data and Forecast of Croatia Cryogenic Valve Market Revenues & Volume By Ball for the Period 2021-2031
- Historical Data and Forecast of Croatia Cryogenic Valve Market Revenues & Volume By End-User for the Period 2021-2031
- Historical Data and Forecast of Croatia Cryogenic Valve Market Revenues & Volume By Energy & Power for the Period 2021-2031
- Historical Data and Forecast of Croatia Cryogenic Valve Market Revenues & Volume By Food for the Period 2021-2031
- Historical Data and Forecast of Croatia Cryogenic Valve Market Revenues & Volume By Chemicals for the Period 2021-2031
- Croatia Cryogenic Valve Import Export Trade Statistics
- Market Opportunity Assessment By Gas
- Market Opportunity Assessment By Type
- Market Opportunity Assessment By End-User
- Croatia Cryogenic Valve Top Companies Market Share
- Croatia Cryogenic Valve Competitive Benchmarking By Technical and Operational Parameters
- Croatia Cryogenic Valve Company Profiles
- Croatia Cryogenic Valve Key Strategic Recommendations
Frequently Asked Questions About the Market Study (FAQs):
6Wresearch actively monitors the Croatia Cryogenic Valve Market and publishes its comprehensive annual report, highlighting emerging trends, growth drivers, revenue analysis, and forecast outlook. Our insights help businesses to make data-backed strategic decisions with ongoing market dynamics. Our analysts track relevent industries related to the Croatia Cryogenic Valve Market, allowing our clients with actionable intelligence and reliable forecasts tailored to emerging regional needs.
Yes, we provide customisation as per your requirements. To learn more, feel free to contact us on sales@6wresearch.com
1 Executive Summary |
2 Introduction |
2.1 Key Highlights of the Report |
2.2 Report Description |
2.3 Market Scope & Segmentation |
2.4 Research Methodology |
2.5 Assumptions |
3 Croatia Cryogenic Valve Market Overview |
3.1 Croatia Country Macro Economic Indicators |
3.2 Croatia Cryogenic Valve Market Revenues & Volume, 2021 & 2031F |
3.3 Croatia Cryogenic Valve Market - Industry Life Cycle |
3.4 Croatia Cryogenic Valve Market - Porter's Five Forces |
3.5 Croatia Cryogenic Valve Market Revenues & Volume Share, By Gas, 2021 & 2031F |
3.6 Croatia Cryogenic Valve Market Revenues & Volume Share, By Type, 2021 & 2031F |
3.7 Croatia Cryogenic Valve Market Revenues & Volume Share, By End-User, 2021 & 2031F |
4 Croatia Cryogenic Valve Market Dynamics |
4.1 Impact Analysis |
4.2 Market Drivers |
4.2.1 Increasing demand for liquefied natural gas (LNG) as an alternative energy source |
4.2.2 Growth in the healthcare and pharmaceutical industries requiring cryogenic applications |
4.2.3 Rising focus on energy efficiency and sustainability driving adoption of cryogenic valves |
4.3 Market Restraints |
4.3.1 High initial investment and maintenance costs associated with cryogenic valves |
4.3.2 Stringent regulations and standards governing the use of cryogenic equipment |
4.3.3 Limited awareness and technical expertise in handling cryogenic valves |
5 Croatia Cryogenic Valve Market Trends |
6 Croatia Cryogenic Valve Market Segmentations |
6.1 Croatia Cryogenic Valve Market, By Gas |
6.1.1 Overview and Analysis |
6.1.2 Croatia Cryogenic Valve Market Revenues & Volume, By LNG, 2021-2031F |
6.1.3 Croatia Cryogenic Valve Market Revenues & Volume, By Oxygen, 2021-2031F |
6.1.4 Croatia Cryogenic Valve Market Revenues & Volume, By Nitrogen, 2021-2031F |
6.2 Croatia Cryogenic Valve Market, By Type |
6.2.1 Overview and Analysis |
6.2.2 Croatia Cryogenic Valve Market Revenues & Volume, By Globe, 2021-2031F |
6.2.3 Croatia Cryogenic Valve Market Revenues & Volume, By Gate, 2021-2031F |
6.2.4 Croatia Cryogenic Valve Market Revenues & Volume, By Ball, 2021-2031F |
6.3 Croatia Cryogenic Valve Market, By End-User |
6.3.1 Overview and Analysis |
6.3.2 Croatia Cryogenic Valve Market Revenues & Volume, By Energy & Power, 2021-2031F |
6.3.3 Croatia Cryogenic Valve Market Revenues & Volume, By Food, 2021-2031F |
6.3.4 Croatia Cryogenic Valve Market Revenues & Volume, By Chemicals, 2021-2031F |
7 Croatia Cryogenic Valve Market Import-Export Trade Statistics |
7.1 Croatia Cryogenic Valve Market Export to Major Countries |
7.2 Croatia Cryogenic Valve Market Imports from Major Countries |
8 Croatia Cryogenic Valve Market Key Performance Indicators |
8.1 Number of new LNG projects in Croatia |
8.2 Adoption rate of cryogenic valves in healthcare and pharmaceutical sectors |
8.3 Investment in research and development for cryogenic valve technology |
9 Croatia Cryogenic Valve Market - Opportunity Assessment |
9.1 Croatia Cryogenic Valve Market Opportunity Assessment, By Gas, 2021 & 2031F |
9.2 Croatia Cryogenic Valve Market Opportunity Assessment, By Type, 2021 & 2031F |
9.3 Croatia Cryogenic Valve Market Opportunity Assessment, By End-User, 2021 & 2031F |
10 Croatia Cryogenic Valve Market - Competitive Landscape |
10.1 Croatia Cryogenic Valve Market Revenue Share, By Companies, 2024 |
10.2 Croatia Cryogenic Valve Market Competitive Benchmarking, By Operating and Technical Parameters |
11 Company Profiles |
12 Recommendations | 13 Disclaimer |
Global Go To Market Strategy - 2030
Export potential enables firms to identify high-growth global markets with greater confidence by combining advanced trade intelligence with a structured quantitative methodology. The framework analyzes emerging demand trends and country-level import patterns while integrating macroeconomic and trade datasets such as GDP and population forecasts, bilateral import–export flows, tariff structures, elasticity differentials between developed and developing economies, geographic distance, and import demand projections. Using weighted trade values from 2020–2024 as the base period to project country-to-country export potential for 2030, these inputs are operationalized through calculated drivers such as gravity model parameters, tariff impact factors, and projected GDP per-capita growth. Through an analysis of hidden potentials, demand hotspots, and market conditions that are most favorable to success, this method enables firms to focus on target countries, maximize returns, and global expansion with data, backed by accuracy.
By factoring in the projected importer demand gap that is currently unmet and could be potential opportunity, it identifies the potential for the Exporter (Country) among 190 countries, against the general trade analysis, which identifies the biggest importer or exporter.
To discover high-growth global markets and optimize your business strategy:
Click Here
Pricing
- Single User License$ 1,995
- Department License$ 2,400
- Site License$ 3,120
- Global License$ 3,795

Leadership Perspectives from Industry Events
Search
Thought Leadership and Analyst Meet


Our Clients
6WResearch In News
- India Export Attractiveness Tracker 2026
- India Air Conditioner Market Set for Strong Rebound in 2026 After Weather-Led Correction and GST-Driven Recovery: 6Wresearch
- ADAS in India: How Automatic Emergency Braking, Blind Spot Detection & Driver Monitoring are Transforming Road Safety
- Doha a strategic location for EV manufacturing hub: IPA Qatar
- Demand for luxury TVs surging in the GCC, says Samsung
- Empowering Growth: The Thriving Journey of Bangladesh’s Cable Industry
Latest Reports
- Nicaragua RPG Gaming Market (2026-2032)
- New Zealand RPG Gaming Market (2026-2032)
- Netherlands RPG Gaming Market (2026-2032)
- Nauru RPG Gaming Market (2026-2032)
- Namibia RPG Gaming Market (2026-2032)
- Mozambique RPG Gaming Market (2026-2032)
- Montenegro RPG Gaming Market (2026-2032)
- Mongolia RPG Gaming Market (2026-2032)
- Monaco RPG Gaming Market (2026-2032)
- Micronesia RPG Gaming Market (2026-2032)
Industry Events and Analyst Meet

EV India Expo 2026

HIMTEX 2026

India Refining Summit 2026

India EV Show 2026

EV tech India Expo 2026
Whitepaper
- Middle East & Africa Commercial Security Market Click here to view more.
- Middle East & Africa Fire Safety Systems & Equipment Market Click here to view more.
- GCC Drone Market Click here to view more.
- Middle East Lighting Fixture Market Click here to view more.
- GCC Physical & Perimeter Security Market Click here to view more.