Croatia D-limonene Market (2025-2031) | Forecast, Industry, Value, Companies, Segmentation, Size & Revenue, Competitive Landscape, Analysis, Outlook, Share, Growth, Trends
Market Forecast By Source (Orange, Mandarin, Grapefruit, Lemon, Others), By Grade (Food Grade, Pharmaceutical Grade, Industrial Grade, Fragrance Grade, Others), By End User (Personal Care Products, Food Products, Furnishing Care Products, Electrical and Electronic Devices Cleaning Products, Air Care Products, Others) And Competitive Landscape
| Product Code: ETC6849137 | Publication Date: Sep 2024 | Updated Date: Apr 2026 | Product Type: Market Research Report | |
| Publisher: 6Wresearch | Author: Vasudha | No. of Pages: 75 | No. of Figures: 35 | No. of Tables: 20 |
Croatia D-Limonene Market Size (2020-2030)
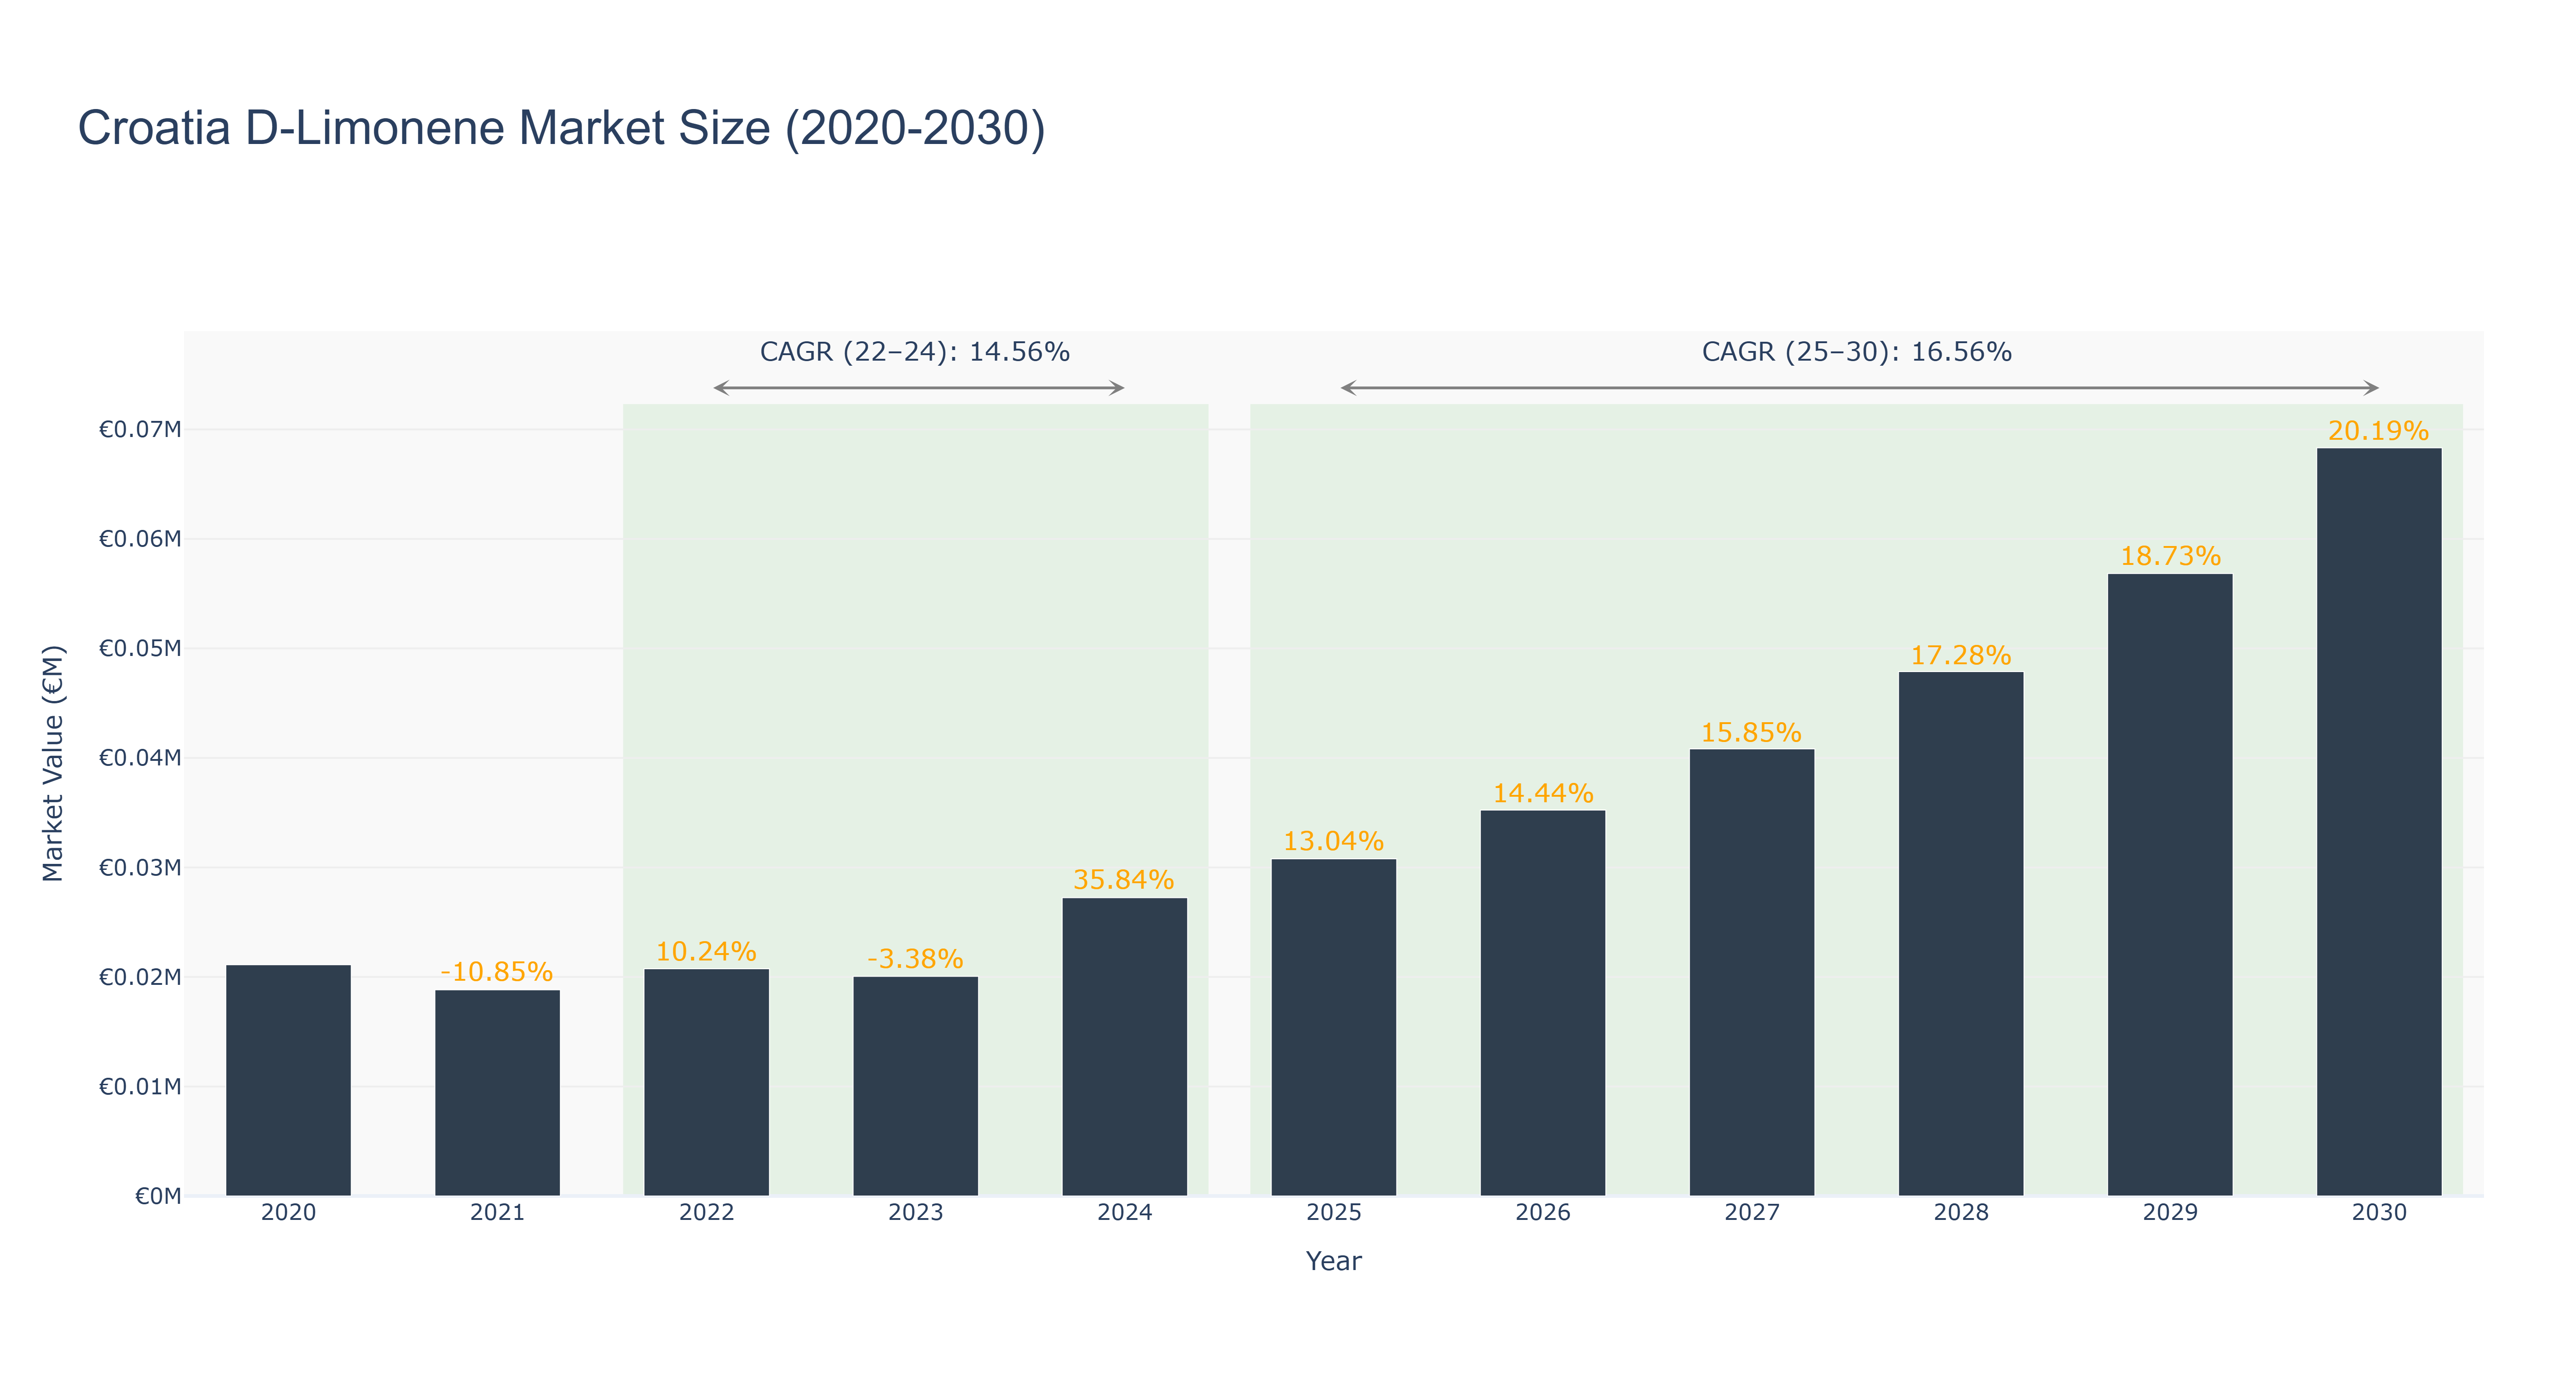
The Croatia D-Limonene Market has shown a steady growth trajectory over the years. The peak market size of €0.07 million was reached in 2030, with a consistent increase from €0.02 million in 2020. The market is forecasted to continue expanding, with a projected size of €0.11 million by 2030. The CAGR values reflect this positive trend, with a growth rate of 14.56% from 2022 to 2024 and a higher rate of 16.56% from 2025 to 2030. The market's growth can be attributed to increasing consumer awareness of natural products and the rising demand for eco-friendly alternatives in various industries. Looking ahead, Croatia is set to introduce new sustainability initiatives in the chemical industry, promoting the use of D-Limonene in various applications, further driving market growth and innovation.
Croatia D-Limonene Market: Production & Trade Performance (2019-2025)
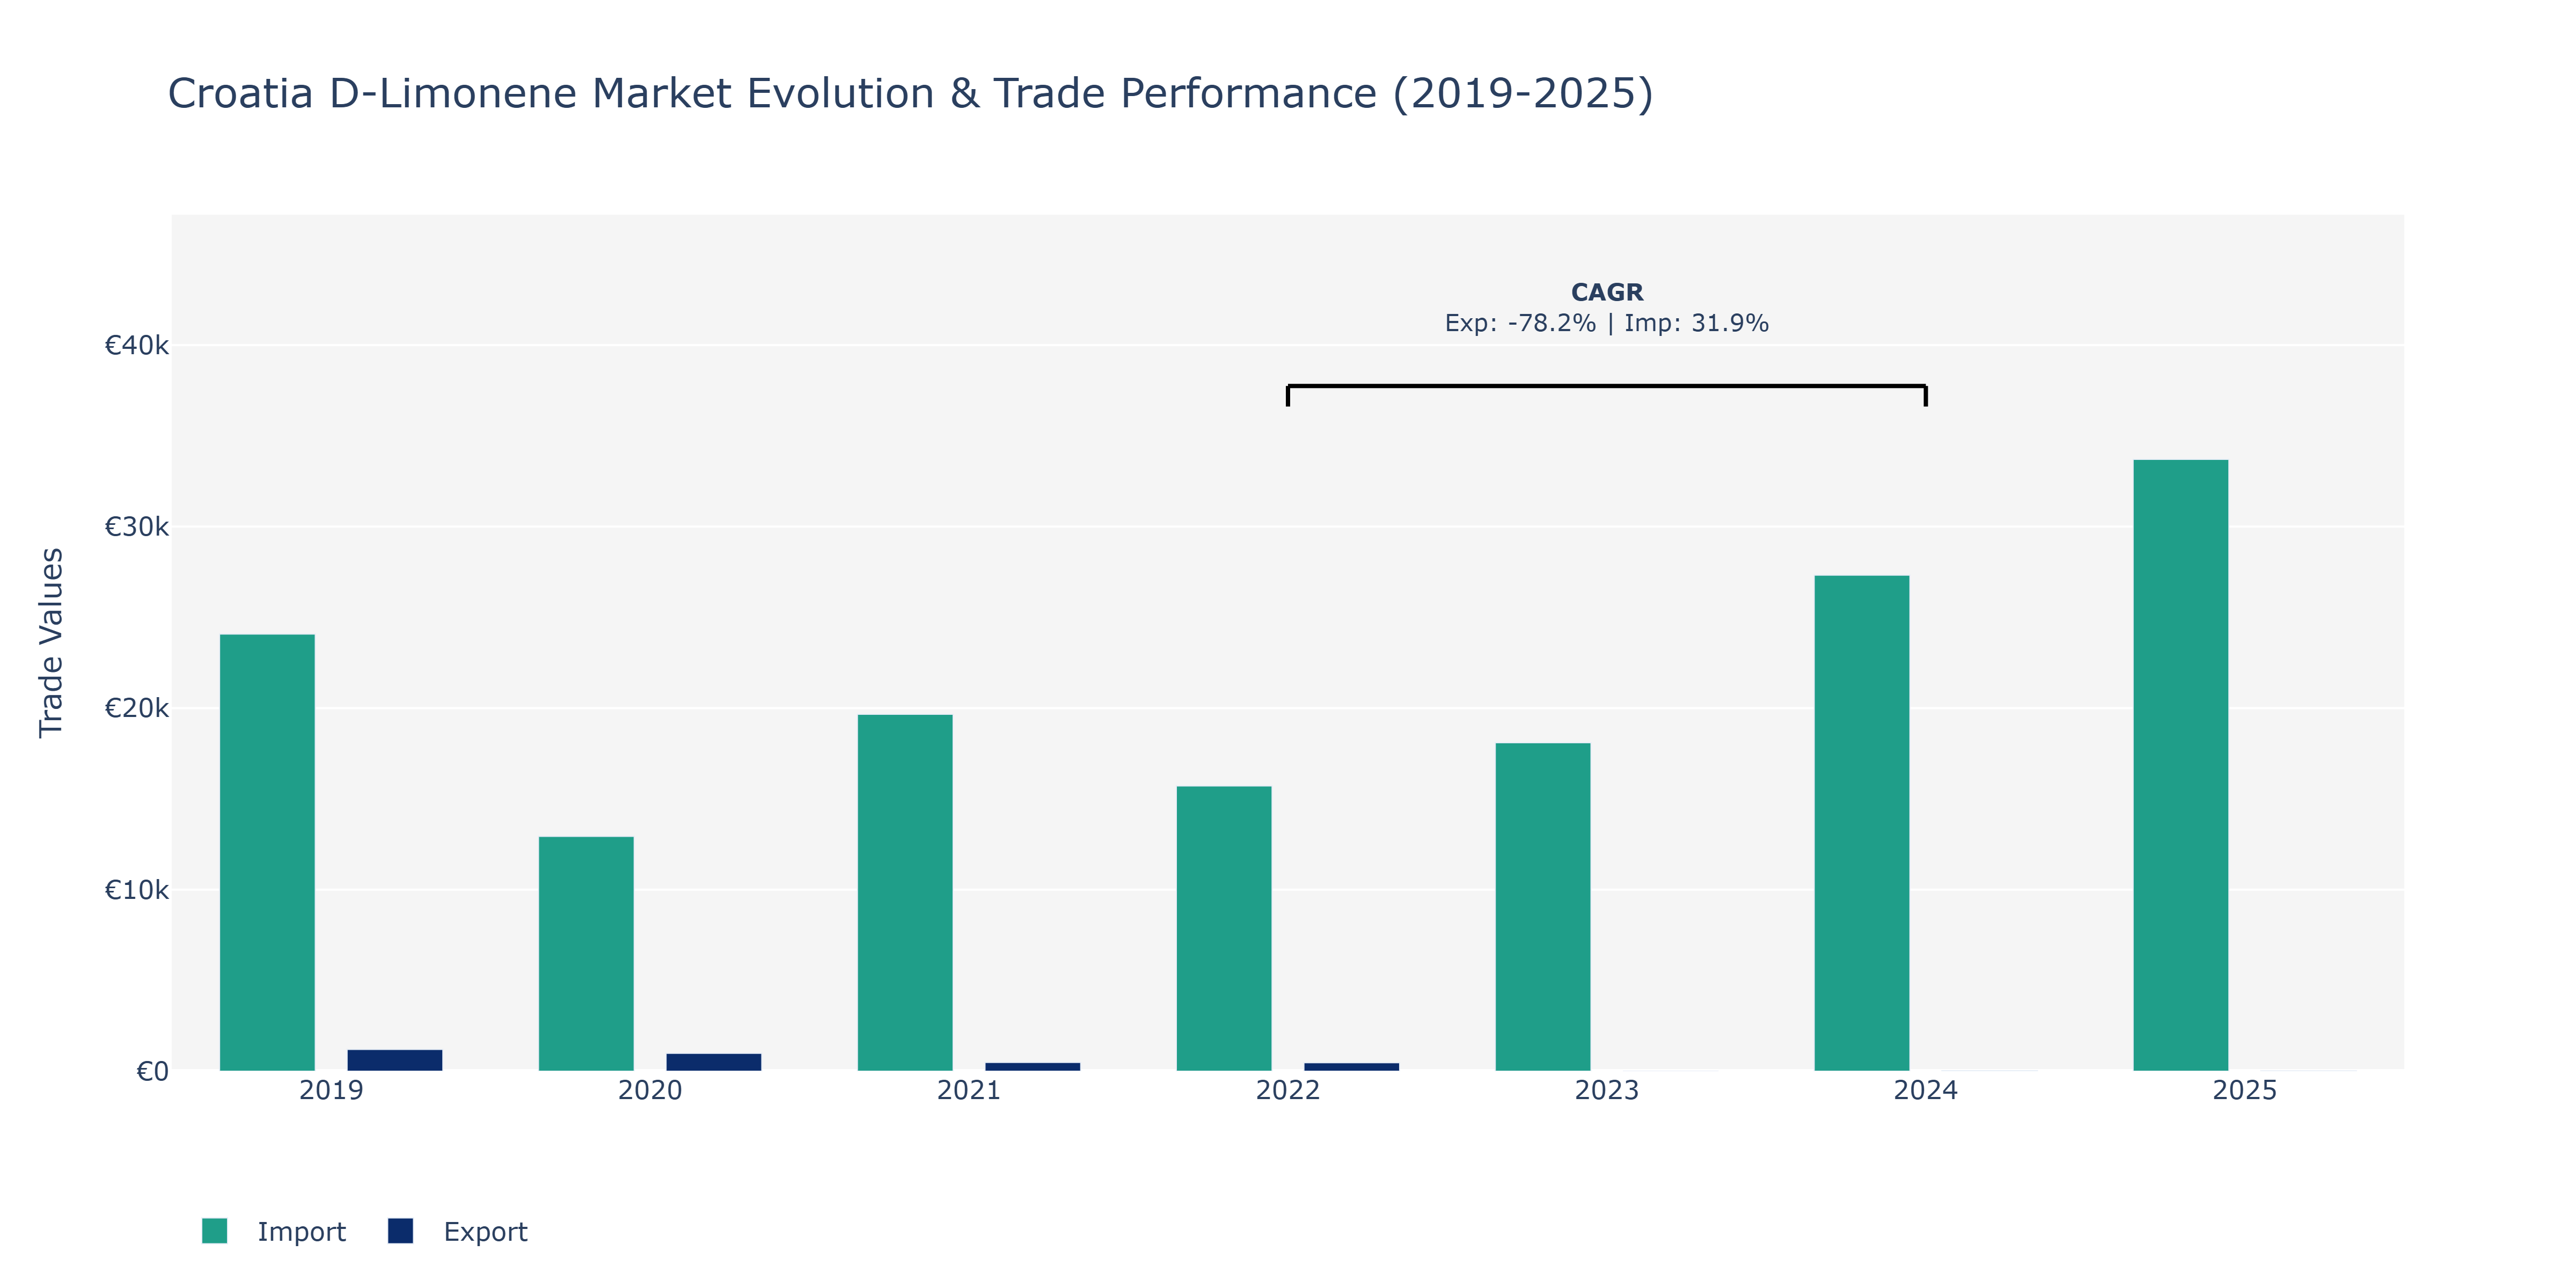
Between 2019 and 2025, Croatia D-Limonene Market experienced notable fluctuations in both Exports and Imports. Exports started at €1.2 thousand in 2019, gradually declining to €16.54 million in 2025. In contrast, Imports fluctuated, peaking at €33.7 thousand in 2025 after reaching their lowest point of €12.08 thousand in 2020. The peak in Imports can be attributed to the rising demand for D-Limonene-based products in various industries such as cosmetics, food, and pharmaceuticals globally. On the other hand, the decline in Exports might be due to increased competition from other countries offering similar products at lower prices, impacting Croatia's market share. The negative growth in Exports may also indicate challenges in production or marketing strategies within the domestic market, requiring potential adjustments to enhance competitiveness.
Key Highlights of the Report:
- Croatia D-limonene Market Outlook
- Market Size of Croatia D-limonene Market, 2024
- Forecast of Croatia D-limonene Market, 2031
- Historical Data and Forecast of Croatia D-limonene Revenues & Volume for the Period 2021- 2031
- Croatia D-limonene Market Trend Evolution
- Croatia D-limonene Market Drivers and Challenges
- Croatia D-limonene Price Trends
- Croatia D-limonene Porter's Five Forces
- Croatia D-limonene Industry Life Cycle
- Historical Data and Forecast of Croatia D-limonene Market Revenues & Volume By Source for the Period 2021- 2031
- Historical Data and Forecast of Croatia D-limonene Market Revenues & Volume By Orange for the Period 2021- 2031
- Historical Data and Forecast of Croatia D-limonene Market Revenues & Volume By Mandarin for the Period 2021- 2031
- Historical Data and Forecast of Croatia D-limonene Market Revenues & Volume By Grapefruit for the Period 2021- 2031
- Historical Data and Forecast of Croatia D-limonene Market Revenues & Volume By Lemon for the Period 2021- 2031
- Historical Data and Forecast of Croatia D-limonene Market Revenues & Volume By Others for the Period 2021- 2031
- Historical Data and Forecast of Croatia D-limonene Market Revenues & Volume By Grade for the Period 2021- 2031
- Historical Data and Forecast of Croatia D-limonene Market Revenues & Volume By Food Grade for the Period 2021- 2031
- Historical Data and Forecast of Croatia D-limonene Market Revenues & Volume By Pharmaceutical Grade for the Period 2021- 2031
- Historical Data and Forecast of Croatia D-limonene Market Revenues & Volume By Industrial Grade for the Period 2021- 2031
- Historical Data and Forecast of Croatia D-limonene Market Revenues & Volume By Fragrance Grade for the Period 2021- 2031
- Historical Data and Forecast of Croatia D-limonene Market Revenues & Volume By Others for the Period 2021- 2031
- Historical Data and Forecast of Croatia D-limonene Market Revenues & Volume By End User for the Period 2021- 2031
- Historical Data and Forecast of Croatia D-limonene Market Revenues & Volume By Personal Care Products for the Period 2021- 2031
- Historical Data and Forecast of Croatia D-limonene Market Revenues & Volume By Food Products for the Period 2021- 2031
- Historical Data and Forecast of Croatia D-limonene Market Revenues & Volume By Furnishing Care Products for the Period 2021- 2031
- Historical Data and Forecast of Croatia D-limonene Market Revenues & Volume By Electrical and Electronic Devices Cleaning Products for the Period 2021- 2031
- Historical Data and Forecast of Croatia D-limonene Market Revenues & Volume By Air Care Products for the Period 2021- 2031
- Historical Data and Forecast of Croatia D-limonene Market Revenues & Volume By Others for the Period 2021- 2031
- Croatia D-limonene Import Export Trade Statistics
- Market Opportunity Assessment By Source
- Market Opportunity Assessment By Grade
- Market Opportunity Assessment By End User
- Croatia D-limonene Top Companies Market Share
- Croatia D-limonene Competitive Benchmarking By Technical and Operational Parameters
- Croatia D-limonene Company Profiles
- Croatia D-limonene Key Strategic Recommendations
Frequently Asked Questions About the Market Study (FAQs):
6Wresearch actively monitors the Croatia D-limonene Market and publishes its comprehensive annual report, highlighting emerging trends, growth drivers, revenue analysis, and forecast outlook. Our insights help businesses to make data-backed strategic decisions with ongoing market dynamics. Our analysts track relevent industries related to the Croatia D-limonene Market, allowing our clients with actionable intelligence and reliable forecasts tailored to emerging regional needs.
Yes, we provide customisation as per your requirements. To learn more, feel free to contact us on sales@6wresearch.com
1 Executive Summary |
2 Introduction |
2.1 Key Highlights of the Report |
2.2 Report Description |
2.3 Market Scope & Segmentation |
2.4 Research Methodology |
2.5 Assumptions |
3 Croatia D-limonene Market Overview |
3.1 Croatia Country Macro Economic Indicators |
3.2 Croatia D-limonene Market Revenues & Volume, 2021 & 2031F |
3.3 Croatia D-limonene Market - Industry Life Cycle |
3.4 Croatia D-limonene Market - Porter's Five Forces |
3.5 Croatia D-limonene Market Revenues & Volume Share, By Source, 2021 & 2031F |
3.6 Croatia D-limonene Market Revenues & Volume Share, By Grade, 2021 & 2031F |
3.7 Croatia D-limonene Market Revenues & Volume Share, By End User, 2021 & 2031F |
4 Croatia D-limonene Market Dynamics |
4.1 Impact Analysis |
4.2 Market Drivers |
4.2.1 Increasing demand for natural and eco-friendly cleaning products |
4.2.2 Growing awareness about the health benefits of using d-limonene in personal care products |
4.2.3 Rise in research and development activities for finding new applications of d-limonene |
4.3 Market Restraints |
4.3.1 Fluctuations in raw material prices (citrus fruits) |
4.3.2 Stringent regulations regarding the use of d-limonene in certain industries |
4.3.3 Competition from synthetic alternatives in the market |
5 Croatia D-limonene Market Trends |
6 Croatia D-limonene Market, By Types |
6.1 Croatia D-limonene Market, By Source |
6.1.1 Overview and Analysis |
6.1.2 Croatia D-limonene Market Revenues & Volume, By Source, 2021- 2031F |
6.1.3 Croatia D-limonene Market Revenues & Volume, By Orange, 2021- 2031F |
6.1.4 Croatia D-limonene Market Revenues & Volume, By Mandarin, 2021- 2031F |
6.1.5 Croatia D-limonene Market Revenues & Volume, By Grapefruit, 2021- 2031F |
6.1.6 Croatia D-limonene Market Revenues & Volume, By Lemon, 2021- 2031F |
6.1.7 Croatia D-limonene Market Revenues & Volume, By Others, 2021- 2031F |
6.2 Croatia D-limonene Market, By Grade |
6.2.1 Overview and Analysis |
6.2.2 Croatia D-limonene Market Revenues & Volume, By Food Grade, 2021- 2031F |
6.2.3 Croatia D-limonene Market Revenues & Volume, By Pharmaceutical Grade, 2021- 2031F |
6.2.4 Croatia D-limonene Market Revenues & Volume, By Industrial Grade, 2021- 2031F |
6.2.5 Croatia D-limonene Market Revenues & Volume, By Fragrance Grade, 2021- 2031F |
6.2.6 Croatia D-limonene Market Revenues & Volume, By Others, 2021- 2031F |
6.3 Croatia D-limonene Market, By End User |
6.3.1 Overview and Analysis |
6.3.2 Croatia D-limonene Market Revenues & Volume, By Personal Care Products, 2021- 2031F |
6.3.3 Croatia D-limonene Market Revenues & Volume, By Food Products, 2021- 2031F |
6.3.4 Croatia D-limonene Market Revenues & Volume, By Furnishing Care Products, 2021- 2031F |
6.3.5 Croatia D-limonene Market Revenues & Volume, By Electrical and Electronic Devices Cleaning Products, 2021- 2031F |
6.3.6 Croatia D-limonene Market Revenues & Volume, By Air Care Products, 2021- 2031F |
6.3.7 Croatia D-limonene Market Revenues & Volume, By Others, 2021- 2031F |
7 Croatia D-limonene Market Import-Export Trade Statistics |
7.1 Croatia D-limonene Market Export to Major Countries |
7.2 Croatia D-limonene Market Imports from Major Countries |
8 Croatia D-limonene Market Key Performance Indicators |
8.1 Percentage increase in the number of new product launches containing d-limonene |
8.2 Growth in the number of patents related to d-limonene applications |
8.3 Expansion of distribution channels for d-limonene products |
9 Croatia D-limonene Market - Opportunity Assessment |
9.1 Croatia D-limonene Market Opportunity Assessment, By Source, 2021 & 2031F |
9.2 Croatia D-limonene Market Opportunity Assessment, By Grade, 2021 & 2031F |
9.3 Croatia D-limonene Market Opportunity Assessment, By End User, 2021 & 2031F |
10 Croatia D-limonene Market - Competitive Landscape |
10.1 Croatia D-limonene Market Revenue Share, By Companies, 2024 |
10.2 Croatia D-limonene Market Competitive Benchmarking, By Operating and Technical Parameters |
11 Company Profiles |
12 Recommendations |
13 Disclaimer |
Global Go To Market Strategy - 2030
Export potential enables firms to identify high-growth global markets with greater confidence by combining advanced trade intelligence with a structured quantitative methodology. The framework analyzes emerging demand trends and country-level import patterns while integrating macroeconomic and trade datasets such as GDP and population forecasts, bilateral import–export flows, tariff structures, elasticity differentials between developed and developing economies, geographic distance, and import demand projections. Using weighted trade values from 2020–2024 as the base period to project country-to-country export potential for 2030, these inputs are operationalized through calculated drivers such as gravity model parameters, tariff impact factors, and projected GDP per-capita growth. Through an analysis of hidden potentials, demand hotspots, and market conditions that are most favorable to success, this method enables firms to focus on target countries, maximize returns, and global expansion with data, backed by accuracy.
By factoring in the projected importer demand gap that is currently unmet and could be potential opportunity, it identifies the potential for the Exporter (Country) among 190 countries, against the general trade analysis, which identifies the biggest importer or exporter.
To discover high-growth global markets and optimize your business strategy:
Click Here
Pricing
- Single User License$ 1,995
- Department License$ 2,400
- Site License$ 3,120
- Global License$ 3,795

Leadership Perspectives from Industry Events
Search
Thought Leadership and Analyst Meet


Our Clients
6WResearch In News
- Doha a strategic location for EV manufacturing hub: IPA Qatar
- Demand for luxury TVs surging in the GCC, says Samsung
- Empowering Growth: The Thriving Journey of Bangladesh’s Cable Industry
- Demand for luxury TVs surging in the GCC, says Samsung
- Video call with a traditional healer? Once unthinkable, it’s now common in South Africa
- Intelligent Buildings To Smooth GCC’s Path To Net Zero
Latest Reports
- New Zealand Aseptic Manufacturing Market (2026-2032)
- Netherlands Aseptic Manufacturing Market (2026-2032)
- Nauru Aseptic Manufacturing Market (2026-2032)
- Namibia Aseptic Manufacturing Market (2026-2032)
- Mozambique Aseptic Manufacturing Market (2026-2032)
- Montenegro Aseptic Manufacturing Market (2026-2032)
- Mongolia Aseptic Manufacturing Market (2026-2032)
- Monaco Aseptic Manufacturing Market (2026-2032)
- Micronesia Aseptic Manufacturing Market (2026-2032)
- Mauritius Aseptic Manufacturing Market (2026-2032)
Industry Events and Analyst Meet

HIMTEX 2026

India Refining Summit 2026

India EV Show 2026

EV tech India Expo 2026

Auto Tech Asia 2026
Whitepaper
- Middle East & Africa Commercial Security Market Click here to view more.
- Middle East & Africa Fire Safety Systems & Equipment Market Click here to view more.
- GCC Drone Market Click here to view more.
- Middle East Lighting Fixture Market Click here to view more.
- GCC Physical & Perimeter Security Market Click here to view more.