Croatia Icing Sugar Market (2026-2032) | Challenges, Pricing Analysis, Growth, Revenue, Companies, Drivers, Restraints, Share, Consumer Insights, Industry, Size, Value, Supply, Competition, Analysis, Segments, Opportunities, Forecast, Competitive, Outlook, Strategy, Strategic Insights, Investment Trends, Trends, Demand, Segmentation
Market Forecast By Type (Confectioners™ Sugar, Powdered Sugar, Icing Mixtures, Organic Icing Sugar, Decorators™ Sugar), By Particle Size (Fine Powder, Extra Fine Powder, Ultra-Fine Powder, Coarse Powder, Micro-Powder), By Application (Bakery, Desserts, Beverages, Confectionery, Industrial Baking), By Sales Channel (Direct Sales, Distributors, Online, Bulk Procurement, Retail Stores), By Sweetening Source (Cane Sugar, Beet Sugar, Artificial Sweetener, Honey-Based, Natural Sugars) And Competitive Landscape
| Product Code: ETC12457685 | Publication Date: Apr 2025 | Updated Date: Apr 2026 | Product Type: Market Research Report | |
| Publisher: 6Wresearch | No. of Pages: 65 | No. of Figures: 34 | No. of Tables: 19 | |
Croatia Icing Sugar Market Size (2020-2030)
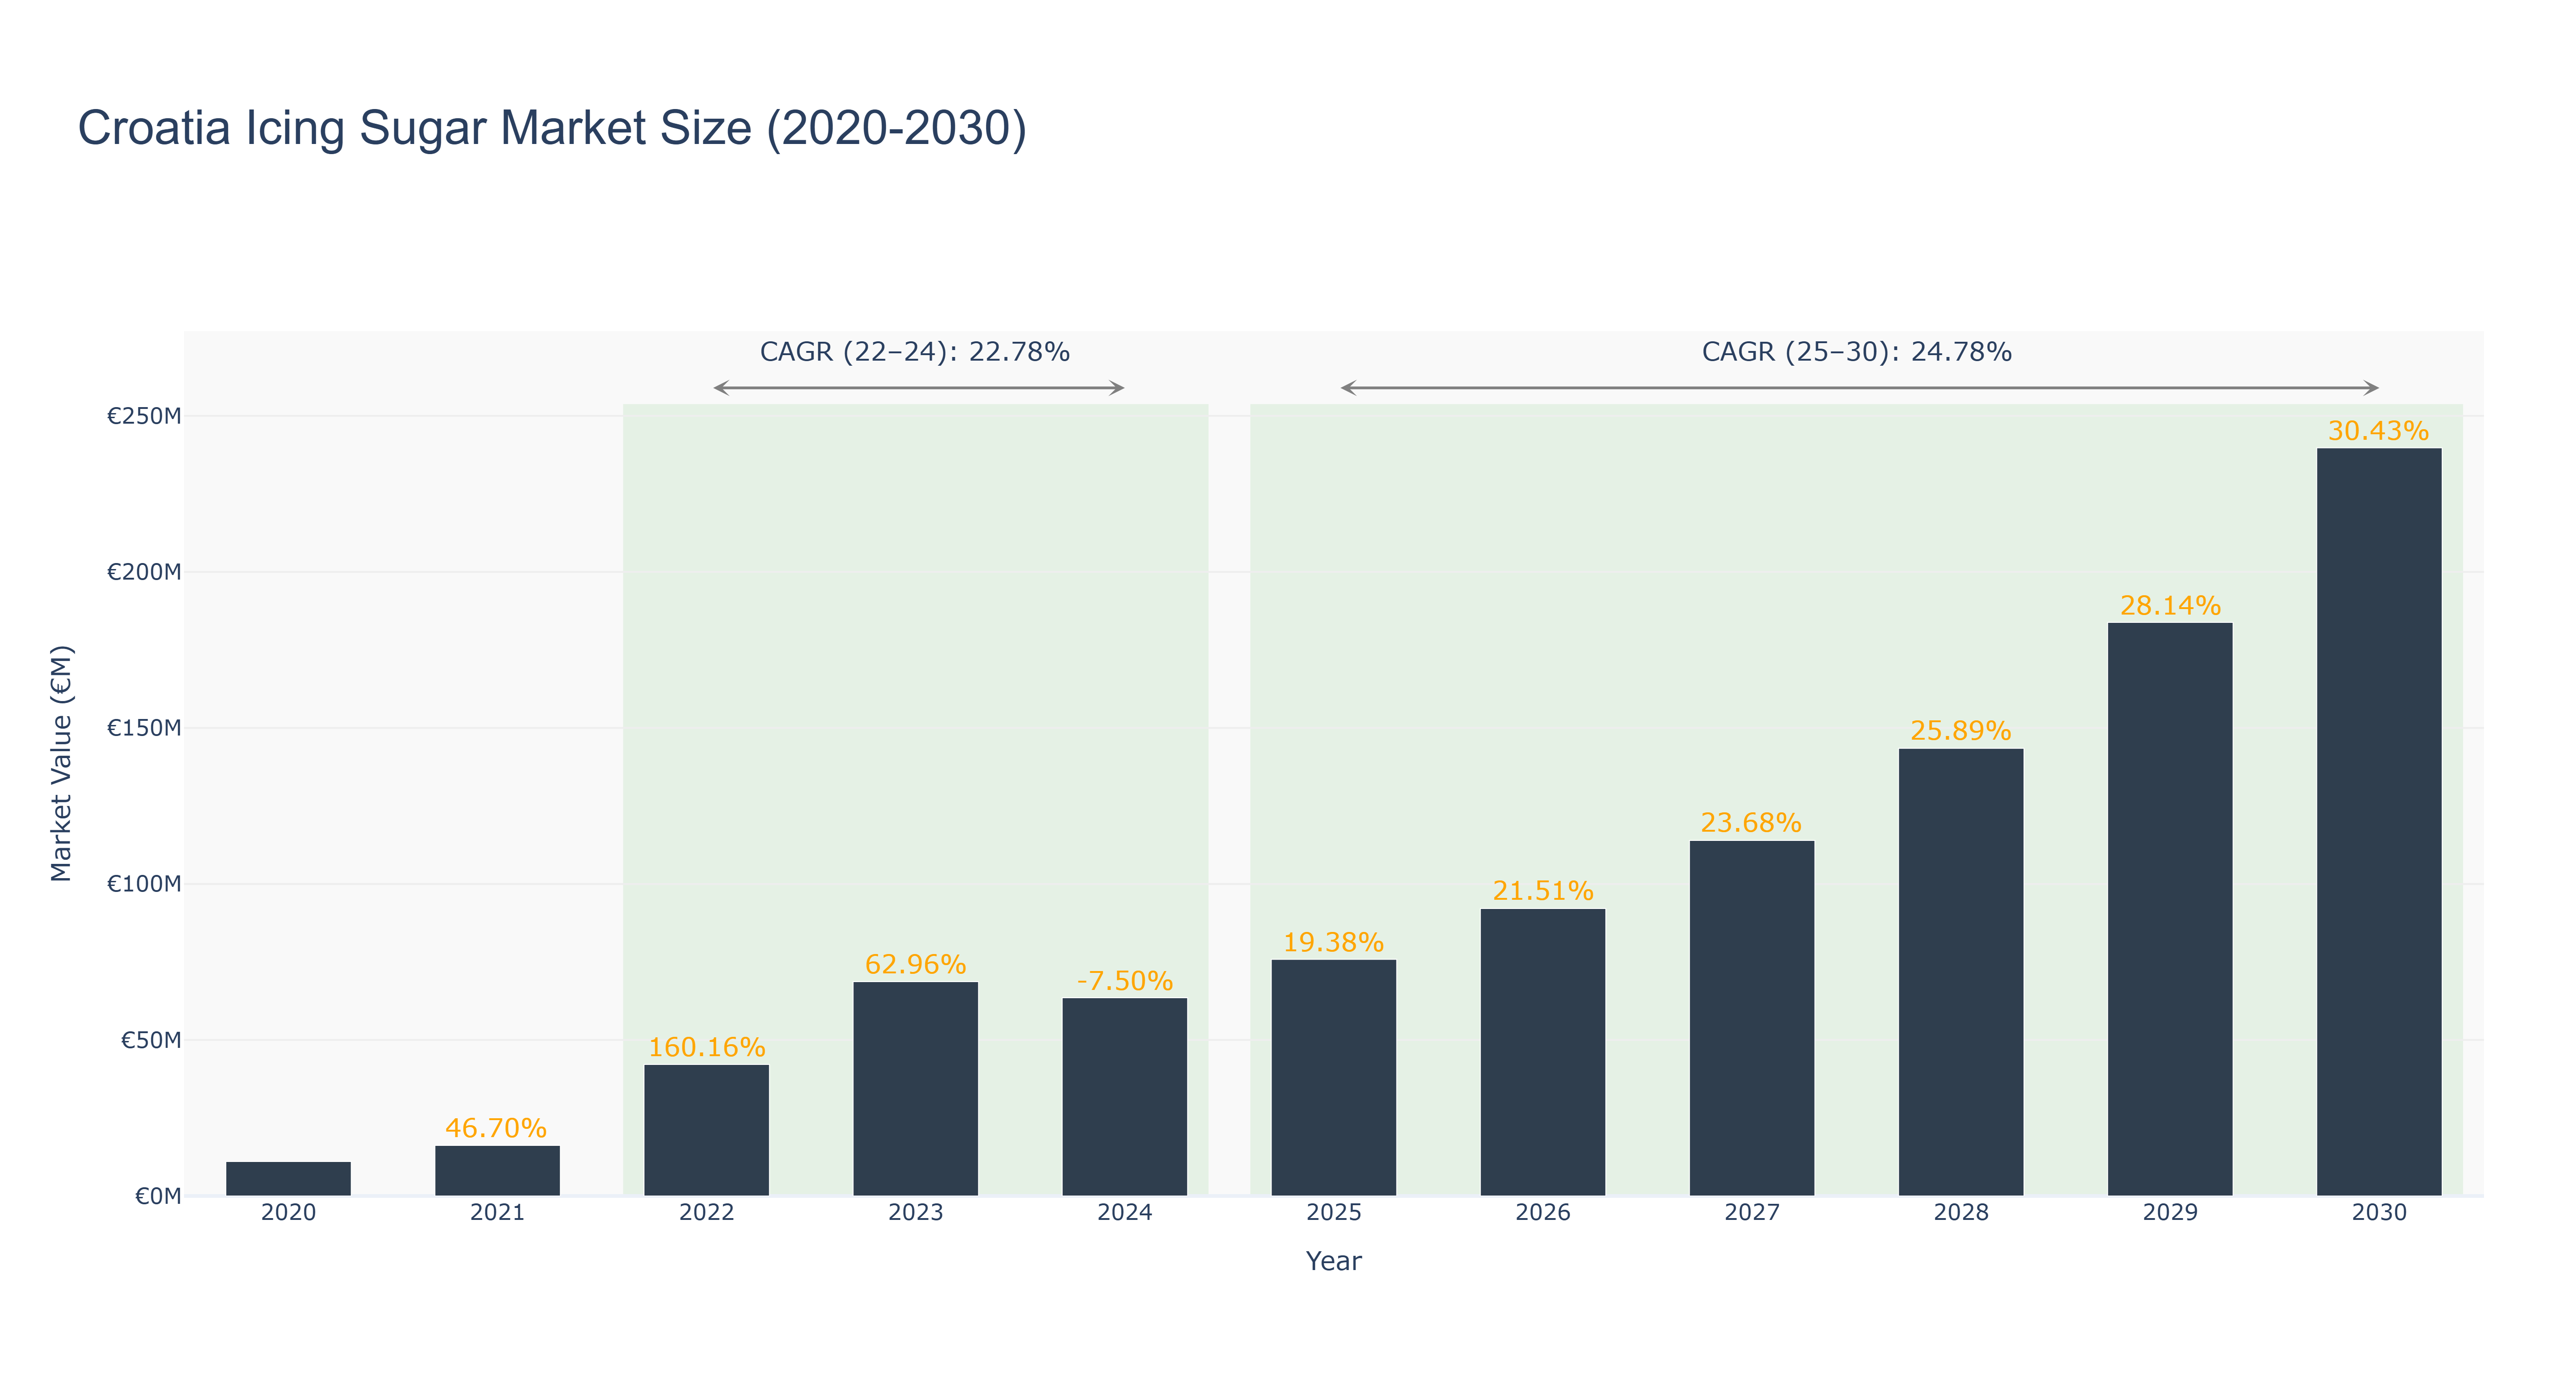
The Croatia Icing Sugar Market has demonstrated significant growth in recent years, peaking at €68.67 million in 2023, following a remarkable increase of 160.16% from 2021 to 2022. However, actual market size is projected to decline to €63.53 million in 2024, reflecting a contraction of 7.50%. This volatility can be attributed to fluctuating consumer demand and supply chain challenges. Looking ahead, the forecasted period from 2025 to 2030 anticipates robust recovery and expansion, with projected market sizes reaching €75.83 million in 2025 and €239.78 million by 2030, resulting in a compound annual growth rate (CAGR) of 24.78%. Key drivers for this growth include the increasing popularity of home baking and confectionery, alongside potential innovations in product offerings. As consumer preferences evolve, the market is expected to benefit from a broader range of applications and enhanced accessibility, positioning it for sustained growth in the coming years.
Croatia Icing Sugar Market: Production & Trade Performance (2019-2025)
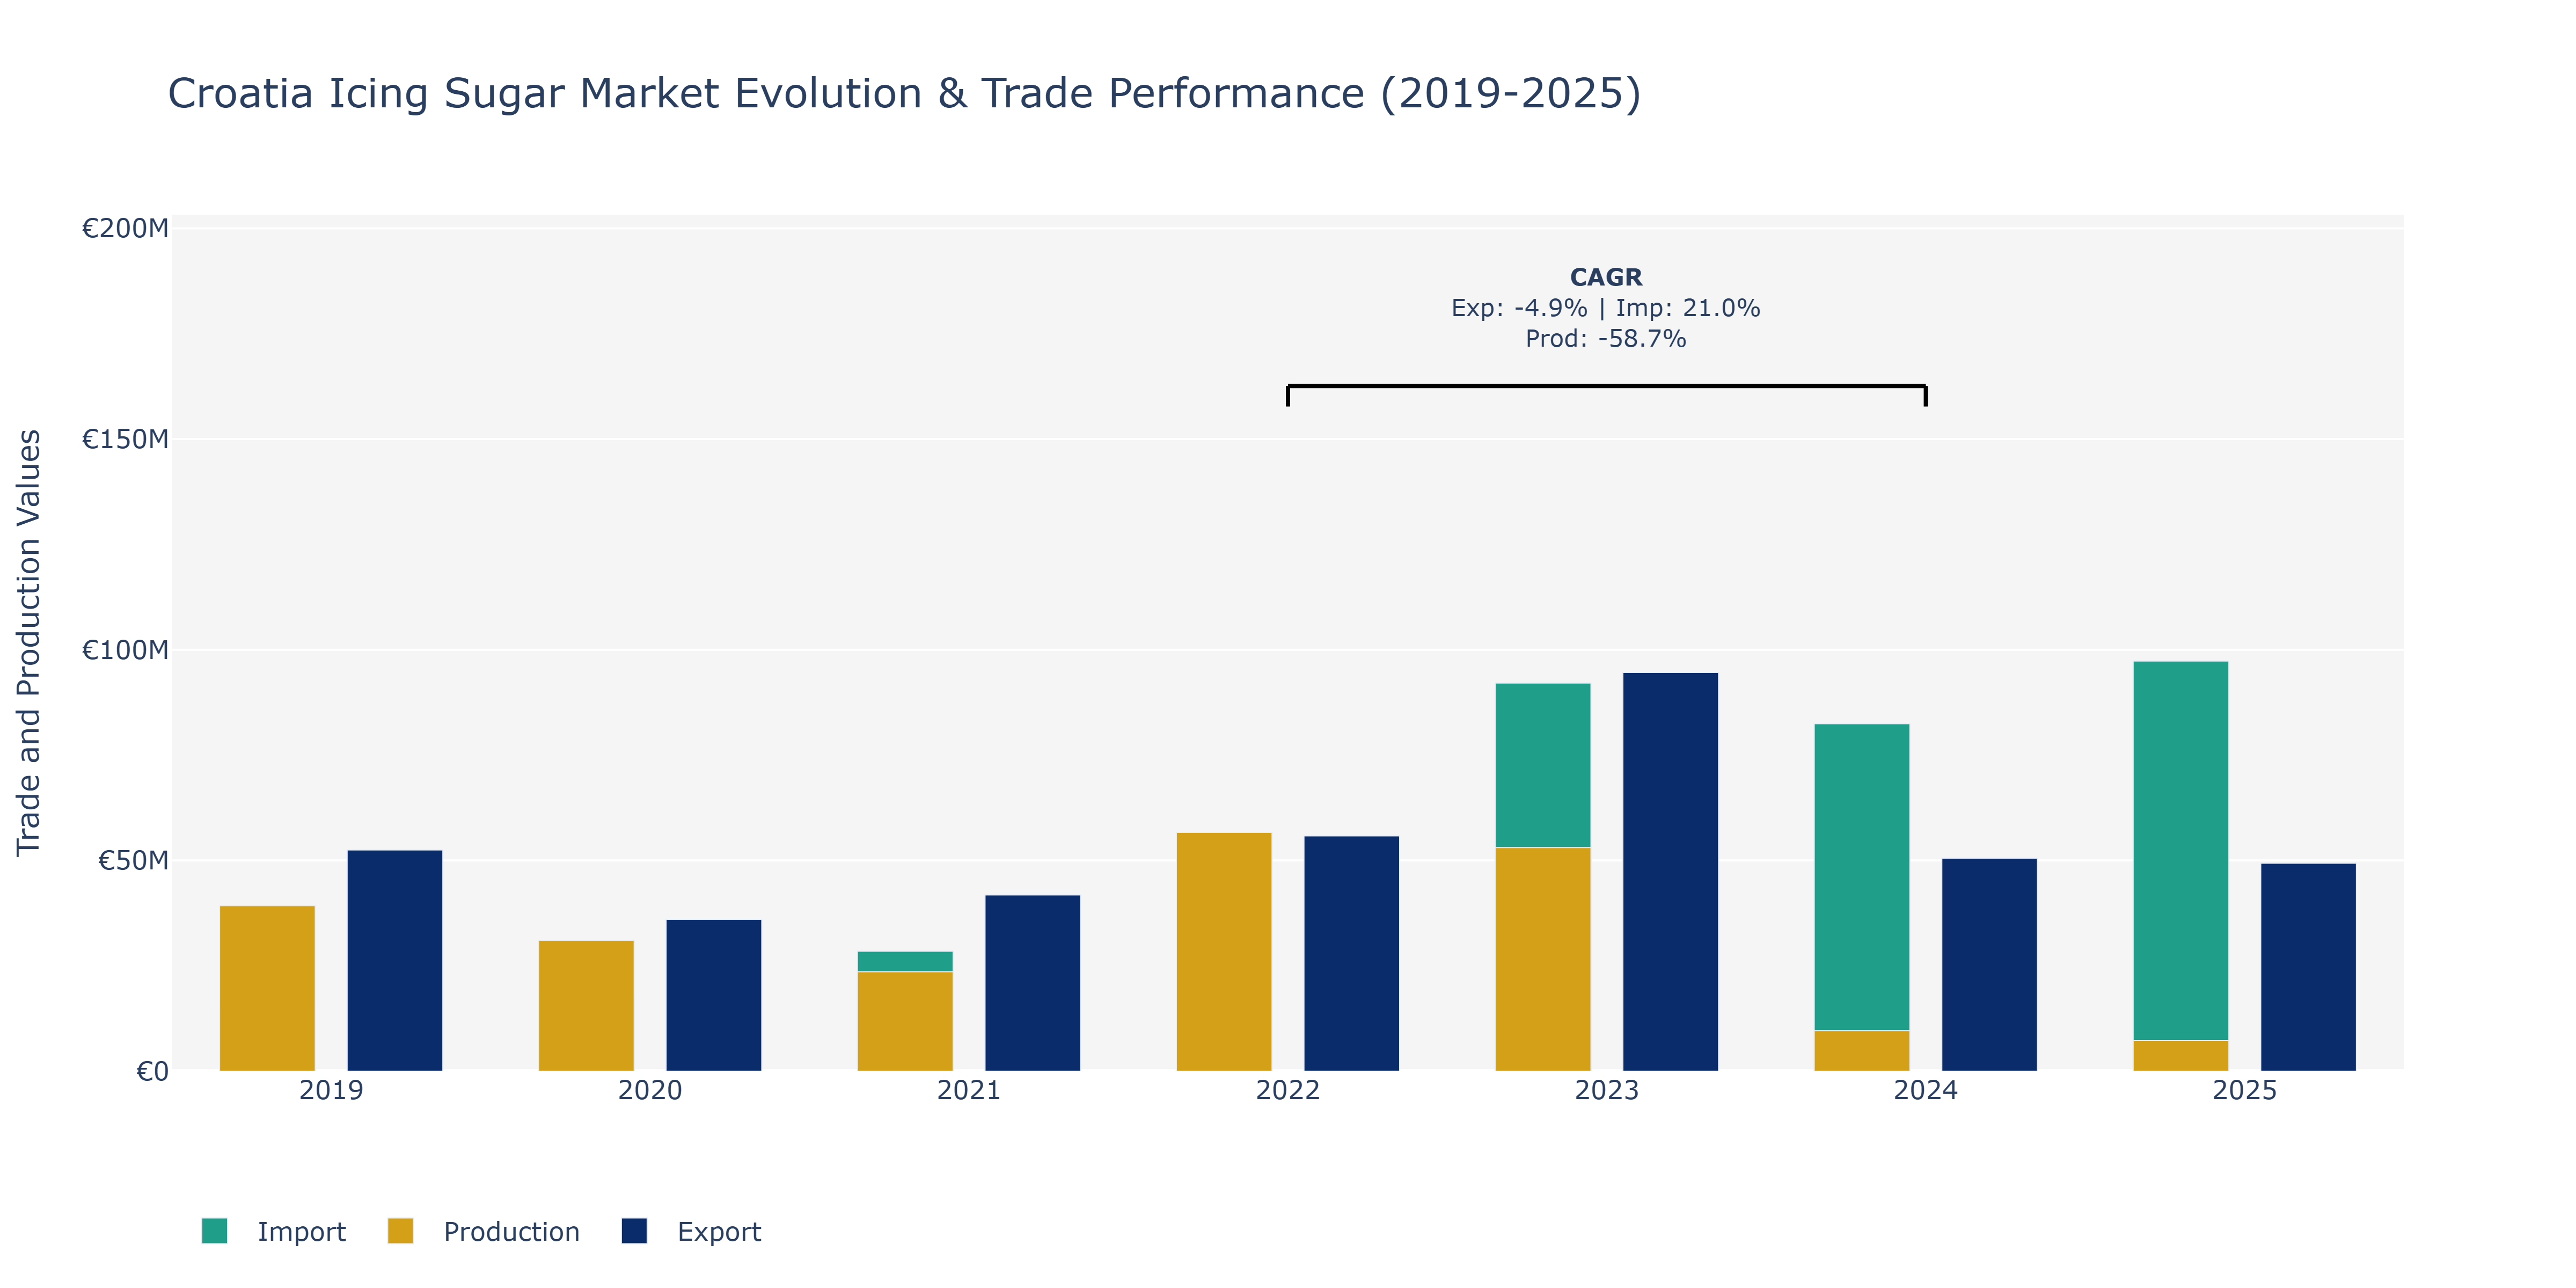
In the Croatia Icing Sugar Market, from 2019 to 2025, exports experienced fluctuations, reaching a peak in 2023 at approximately €94.6 million and then slightly declining to around €49.3 million in 2025. Imports showed an increasing trend, growing from about €15.7 million in 2019 to approximately €97.3 million in 2025, with a notable spike in 2024. Production levels exhibited a sharp decline, plummeting from about €39.3 million in 2019 to approximately €7.3 million in 2025. These trends could be influenced by various factors such as shifts in consumer demand, changes in global pricing of sugar, and possibly domestic policy changes affecting production capacities. The surge in imports could indicate rising demand or supply chain challenges, while the decline in production might be attributed to technological advancements impacting traditional production methods in the industry, necessitating adaptation to newer, more efficient practices.
Key Highlights of the Report:
- Croatia Icing Sugar Market Outlook
- Market Size of Croatia Icing Sugar Market, 2025
- Forecast of Croatia Icing Sugar Market, 2032
- Historical Data and Forecast of Croatia Icing Sugar Revenues & Volume for the Period 2022 - 2032F
- Croatia Icing Sugar Market Trend Evolution
- Croatia Icing Sugar Market Drivers and Challenges
- Croatia Icing Sugar Price Trends
- Croatia Icing Sugar Porter's Five Forces
- Croatia Icing Sugar Industry Life Cycle
- Historical Data and Forecast of Croatia Icing Sugar Market Revenues & Volume By Type for the Period 2022 - 2032F
- Historical Data and Forecast of Croatia Icing Sugar Market Revenues & Volume By Confectioners' Sugar for the Period 2022 - 2032F
- Historical Data and Forecast of Croatia Icing Sugar Market Revenues & Volume By Powdered Sugar for the Period 2022 - 2032F
- Historical Data and Forecast of Croatia Icing Sugar Market Revenues & Volume By Icing Mixtures for the Period 2022 - 2032F
- Historical Data and Forecast of Croatia Icing Sugar Market Revenues & Volume By Organic Icing Sugar for the Period 2022 - 2032F
- Historical Data and Forecast of Croatia Icing Sugar Market Revenues & Volume By Decorators' Sugar for the Period 2022 - 2032F
- Historical Data and Forecast of Croatia Icing Sugar Market Revenues & Volume By Particle Size for the Period 2022 - 2032F
- Historical Data and Forecast of Croatia Icing Sugar Market Revenues & Volume By Fine Powder for the Period 2022 - 2032F
- Historical Data and Forecast of Croatia Icing Sugar Market Revenues & Volume By Extra Fine Powder for the Period 2022 - 2032F
- Historical Data and Forecast of Croatia Icing Sugar Market Revenues & Volume By Ultra-Fine Powder for the Period 2022 - 2032F
- Historical Data and Forecast of Croatia Icing Sugar Market Revenues & Volume By Coarse Powder for the Period 2022 - 2032F
- Historical Data and Forecast of Croatia Icing Sugar Market Revenues & Volume By Micro-Powder for the Period 2022 - 2032F
- Historical Data and Forecast of Croatia Icing Sugar Market Revenues & Volume By Application for the Period 2022 - 2032F
- Historical Data and Forecast of Croatia Icing Sugar Market Revenues & Volume By Bakery for the Period 2022 - 2032F
- Historical Data and Forecast of Croatia Icing Sugar Market Revenues & Volume By Desserts for the Period 2022 - 2032F
- Historical Data and Forecast of Croatia Icing Sugar Market Revenues & Volume By Beverages for the Period 2022 - 2032F
- Historical Data and Forecast of Croatia Icing Sugar Market Revenues & Volume By Confectionery for the Period 2022 - 2032F
- Historical Data and Forecast of Croatia Icing Sugar Market Revenues & Volume By Industrial Baking for the Period 2022 - 2032F
- Historical Data and Forecast of Croatia Icing Sugar Market Revenues & Volume By Sales Channel for the Period 2022 - 2032F
- Historical Data and Forecast of Croatia Icing Sugar Market Revenues & Volume By Direct Sales for the Period 2022 - 2032F
- Historical Data and Forecast of Croatia Icing Sugar Market Revenues & Volume By Distributors for the Period 2022 - 2032F
- Historical Data and Forecast of Croatia Icing Sugar Market Revenues & Volume By Online for the Period 2022 - 2032F
- Historical Data and Forecast of Croatia Icing Sugar Market Revenues & Volume By Bulk Procurement for the Period 2022 - 2032F
- Historical Data and Forecast of Croatia Icing Sugar Market Revenues & Volume By Retail Stores for the Period 2022 - 2032F
- Historical Data and Forecast of Croatia Icing Sugar Market Revenues & Volume By Sweetening Source for the Period 2022 - 2032F
- Historical Data and Forecast of Croatia Icing Sugar Market Revenues & Volume By Cane Sugar for the Period 2022 - 2032F
- Historical Data and Forecast of Croatia Icing Sugar Market Revenues & Volume By Beet Sugar for the Period 2022 - 2032F
- Historical Data and Forecast of Croatia Icing Sugar Market Revenues & Volume By Artificial Sweetener for the Period 2022 - 2032F
- Historical Data and Forecast of Croatia Icing Sugar Market Revenues & Volume By Honey-Based for the Period 2022 - 2032F
- Historical Data and Forecast of Croatia Icing Sugar Market Revenues & Volume By Natural Sugars for the Period 2022 - 2032F
- Croatia Icing Sugar Import Export Trade Statistics
- Market Opportunity Assessment By Type
- Market Opportunity Assessment By Particle Size
- Market Opportunity Assessment By Application
- Market Opportunity Assessment By Sales Channel
- Market Opportunity Assessment By Sweetening Source
- Croatia Icing Sugar Top Companies Market Share
- Croatia Icing Sugar Competitive Benchmarking By Technical and Operational Parameters
- Croatia Icing Sugar Company Profiles
- Croatia Icing Sugar Key Strategic Recommendations
Frequently Asked Questions About the Market Study (FAQs):
6Wresearch actively monitors the Croatia Icing Sugar Market and publishes its comprehensive annual report, highlighting emerging trends, growth drivers, revenue analysis, and forecast outlook. Our insights help businesses to make data-backed strategic decisions with ongoing market dynamics. Our analysts track relevent industries related to the Croatia Icing Sugar Market, allowing our clients with actionable intelligence and reliable forecasts tailored to emerging regional needs.
Yes, we provide customisation as per your requirements. To learn more, feel free to contact us on sales@6wresearch.com
1 Executive Summary |
2 Introduction |
2.1 Key Highlights of the Report |
2.2 Report Description |
2.3 Market Scope & Segmentation |
2.4 Research Methodology |
2.5 Assumptions |
3 Croatia Icing Sugar Market Overview |
3.1 Croatia Country Macro Economic Indicators |
3.2 Croatia Icing Sugar Market Revenues & Volume, 2022 & 2032F |
3.3 Croatia Icing Sugar Market - Industry Life Cycle |
3.4 Croatia Icing Sugar Market - Porter's Five Forces |
3.5 Croatia Icing Sugar Market Revenues & Volume Share, By Type, 2022 & 2032F |
3.6 Croatia Icing Sugar Market Revenues & Volume Share, By Particle Size, 2022 & 2032F |
3.7 Croatia Icing Sugar Market Revenues & Volume Share, By Application, 2022 & 2032F |
3.8 Croatia Icing Sugar Market Revenues & Volume Share, By Sales Channel, 2022 & 2032F |
3.9 Croatia Icing Sugar Market Revenues & Volume Share, By Sweetening Source, 2022 & 2032F |
4 Croatia Icing Sugar Market Dynamics |
4.1 Impact Analysis |
4.2 Market Drivers |
4.2.1 Increasing consumer demand for bakery products and confectionery items |
4.2.2 Growth in the food processing industry in Croatia |
4.2.3 Rising disposable income leading to higher spending on premium food products |
4.3 Market Restraints |
4.3.1 Fluctuating prices of raw materials like sugar cane or sugar beets |
4.3.2 Stringent regulations and standards in the food industry |
4.3.3 Competition from substitute products like honey or artificial sweeteners |
5 Croatia Icing Sugar Market Trends |
6 Croatia Icing Sugar Market, By Types |
6.1 Croatia Icing Sugar Market, By Type |
6.1.1 Overview and Analysis |
6.1.2 Croatia Icing Sugar Market Revenues & Volume, By Type, 2022 - 2032F |
6.1.3 Croatia Icing Sugar Market Revenues & Volume, By Confectioners' Sugar, 2022 - 2032F |
6.1.4 Croatia Icing Sugar Market Revenues & Volume, By Powdered Sugar, 2022 - 2032F |
6.1.5 Croatia Icing Sugar Market Revenues & Volume, By Icing Mixtures, 2022 - 2032F |
6.1.6 Croatia Icing Sugar Market Revenues & Volume, By Organic Icing Sugar, 2022 - 2032F |
6.1.7 Croatia Icing Sugar Market Revenues & Volume, By Decorators' Sugar, 2022 - 2032F |
6.2 Croatia Icing Sugar Market, By Particle Size |
6.2.1 Overview and Analysis |
6.2.2 Croatia Icing Sugar Market Revenues & Volume, By Fine Powder, 2022 - 2032F |
6.2.3 Croatia Icing Sugar Market Revenues & Volume, By Extra Fine Powder, 2022 - 2032F |
6.2.4 Croatia Icing Sugar Market Revenues & Volume, By Ultra-Fine Powder, 2022 - 2032F |
6.2.5 Croatia Icing Sugar Market Revenues & Volume, By Coarse Powder, 2022 - 2032F |
6.2.6 Croatia Icing Sugar Market Revenues & Volume, By Micro-Powder, 2022 - 2032F |
6.3 Croatia Icing Sugar Market, By Application |
6.3.1 Overview and Analysis |
6.3.2 Croatia Icing Sugar Market Revenues & Volume, By Bakery, 2022 - 2032F |
6.3.3 Croatia Icing Sugar Market Revenues & Volume, By Desserts, 2022 - 2032F |
6.3.4 Croatia Icing Sugar Market Revenues & Volume, By Beverages, 2022 - 2032F |
6.3.5 Croatia Icing Sugar Market Revenues & Volume, By Confectionery, 2022 - 2032F |
6.3.6 Croatia Icing Sugar Market Revenues & Volume, By Industrial Baking, 2022 - 2032F |
6.4 Croatia Icing Sugar Market, By Sales Channel |
6.4.1 Overview and Analysis |
6.4.2 Croatia Icing Sugar Market Revenues & Volume, By Direct Sales, 2022 - 2032F |
6.4.3 Croatia Icing Sugar Market Revenues & Volume, By Distributors, 2022 - 2032F |
6.4.4 Croatia Icing Sugar Market Revenues & Volume, By Online, 2022 - 2032F |
6.4.5 Croatia Icing Sugar Market Revenues & Volume, By Bulk Procurement, 2022 - 2032F |
6.4.6 Croatia Icing Sugar Market Revenues & Volume, By Retail Stores, 2022 - 2032F |
6.5 Croatia Icing Sugar Market, By Sweetening Source |
6.5.1 Overview and Analysis |
6.5.2 Croatia Icing Sugar Market Revenues & Volume, By Cane Sugar, 2022 - 2032F |
6.5.3 Croatia Icing Sugar Market Revenues & Volume, By Beet Sugar, 2022 - 2032F |
6.5.4 Croatia Icing Sugar Market Revenues & Volume, By Artificial Sweetener, 2022 - 2032F |
6.5.5 Croatia Icing Sugar Market Revenues & Volume, By Honey-Based, 2022 - 2032F |
6.5.6 Croatia Icing Sugar Market Revenues & Volume, By Natural Sugars, 2022 - 2032F |
7 Croatia Icing Sugar Market Import-Export Trade Statistics |
7.1 Croatia Icing Sugar Market Export to Major Countries |
7.2 Croatia Icing Sugar Market Imports from Major Countries |
8 Croatia Icing Sugar Market Key Performance Indicators |
8.1 Average selling price of icing sugar in Croatia |
8.2 Number of new product launches in the icing sugar segment |
8.3 Consumer sentiment and preferences towards icing sugar packaging |
8.4 Rate of adoption of innovative icing sugar products in the market |
8.5 Level of investment in marketing and promotions by icing sugar manufacturers |
9 Croatia Icing Sugar Market - Opportunity Assessment |
9.1 Croatia Icing Sugar Market Opportunity Assessment, By Type, 2022 & 2032F |
9.2 Croatia Icing Sugar Market Opportunity Assessment, By Particle Size, 2022 & 2032F |
9.3 Croatia Icing Sugar Market Opportunity Assessment, By Application, 2022 & 2032F |
9.4 Croatia Icing Sugar Market Opportunity Assessment, By Sales Channel, 2022 & 2032F |
9.5 Croatia Icing Sugar Market Opportunity Assessment, By Sweetening Source, 2022 & 2032F |
10 Croatia Icing Sugar Market - Competitive Landscape |
10.1 Croatia Icing Sugar Market Revenue Share, By Companies, 2025 |
10.2 Croatia Icing Sugar Market Competitive Benchmarking, By Operating and Technical Parameters |
11 Company Profiles |
12 Recommendations |
13 Disclaimer |
Global Go To Market Strategy - 2030
Export potential enables firms to identify high-growth global markets with greater confidence by combining advanced trade intelligence with a structured quantitative methodology. The framework analyzes emerging demand trends and country-level import patterns while integrating macroeconomic and trade datasets such as GDP and population forecasts, bilateral import–export flows, tariff structures, elasticity differentials between developed and developing economies, geographic distance, and import demand projections. Using weighted trade values from 2020–2024 as the base period to project country-to-country export potential for 2030, these inputs are operationalized through calculated drivers such as gravity model parameters, tariff impact factors, and projected GDP per-capita growth. Through an analysis of hidden potentials, demand hotspots, and market conditions that are most favorable to success, this method enables firms to focus on target countries, maximize returns, and global expansion with data, backed by accuracy.
By factoring in the projected importer demand gap that is currently unmet and could be potential opportunity, it identifies the potential for the Exporter (Country) among 190 countries, against the general trade analysis, which identifies the biggest importer or exporter.
To discover high-growth global markets and optimize your business strategy:
Click Here
Pricing
- Single User License$ 1,995
- Department License$ 2,400
- Site License$ 3,120
- Global License$ 3,795

Leadership Perspectives from Industry Events
Search
Thought Leadership and Analyst Meet


Our Clients
6WResearch In News
- India Export Attractiveness Tracker 2026
- India Air Conditioner Market Set for Strong Rebound in 2026 After Weather-Led Correction and GST-Driven Recovery: 6Wresearch
- ADAS in India: How Automatic Emergency Braking, Blind Spot Detection & Driver Monitoring are Transforming Road Safety
- Doha a strategic location for EV manufacturing hub: IPA Qatar
- Demand for luxury TVs surging in the GCC, says Samsung
- Empowering Growth: The Thriving Journey of Bangladesh’s Cable Industry
Latest Reports
- Nicaragua RPG Gaming Market (2026-2032)
- New Zealand RPG Gaming Market (2026-2032)
- Netherlands RPG Gaming Market (2026-2032)
- Nauru RPG Gaming Market (2026-2032)
- Namibia RPG Gaming Market (2026-2032)
- Mozambique RPG Gaming Market (2026-2032)
- Montenegro RPG Gaming Market (2026-2032)
- Mongolia RPG Gaming Market (2026-2032)
- Monaco RPG Gaming Market (2026-2032)
- Micronesia RPG Gaming Market (2026-2032)
Industry Events and Analyst Meet

EV India Expo 2026

HIMTEX 2026

India Refining Summit 2026

India EV Show 2026

EV tech India Expo 2026
Whitepaper
- Middle East & Africa Commercial Security Market Click here to view more.
- Middle East & Africa Fire Safety Systems & Equipment Market Click here to view more.
- GCC Drone Market Click here to view more.
- Middle East Lighting Fixture Market Click here to view more.
- GCC Physical & Perimeter Security Market Click here to view more.