Croatia Isophorone Market (2026-2032) | Competitive Landscape, Segmentation, Growth, Trends, Industry, Analysis, Companies, Outlook, Share, Size & Revenue, Value, Forecast
Market Forecast By End-user (Paints and Coatings, Printing Inks, Artificial Leather, Adhesives, Agrochemicals, Composites, Other) And Competitive Landscape
| Product Code: ETC6853918 | Publication Date: Sep 2024 | Updated Date: Apr 2026 | Product Type: Market Research Report | |
| Publisher: 6Wresearch | Author: Dhaval Chaurasia | No. of Pages: 75 | No. of Figures: 35 | No. of Tables: 20 |
Croatia Isophorone Market Size (2020-2030)
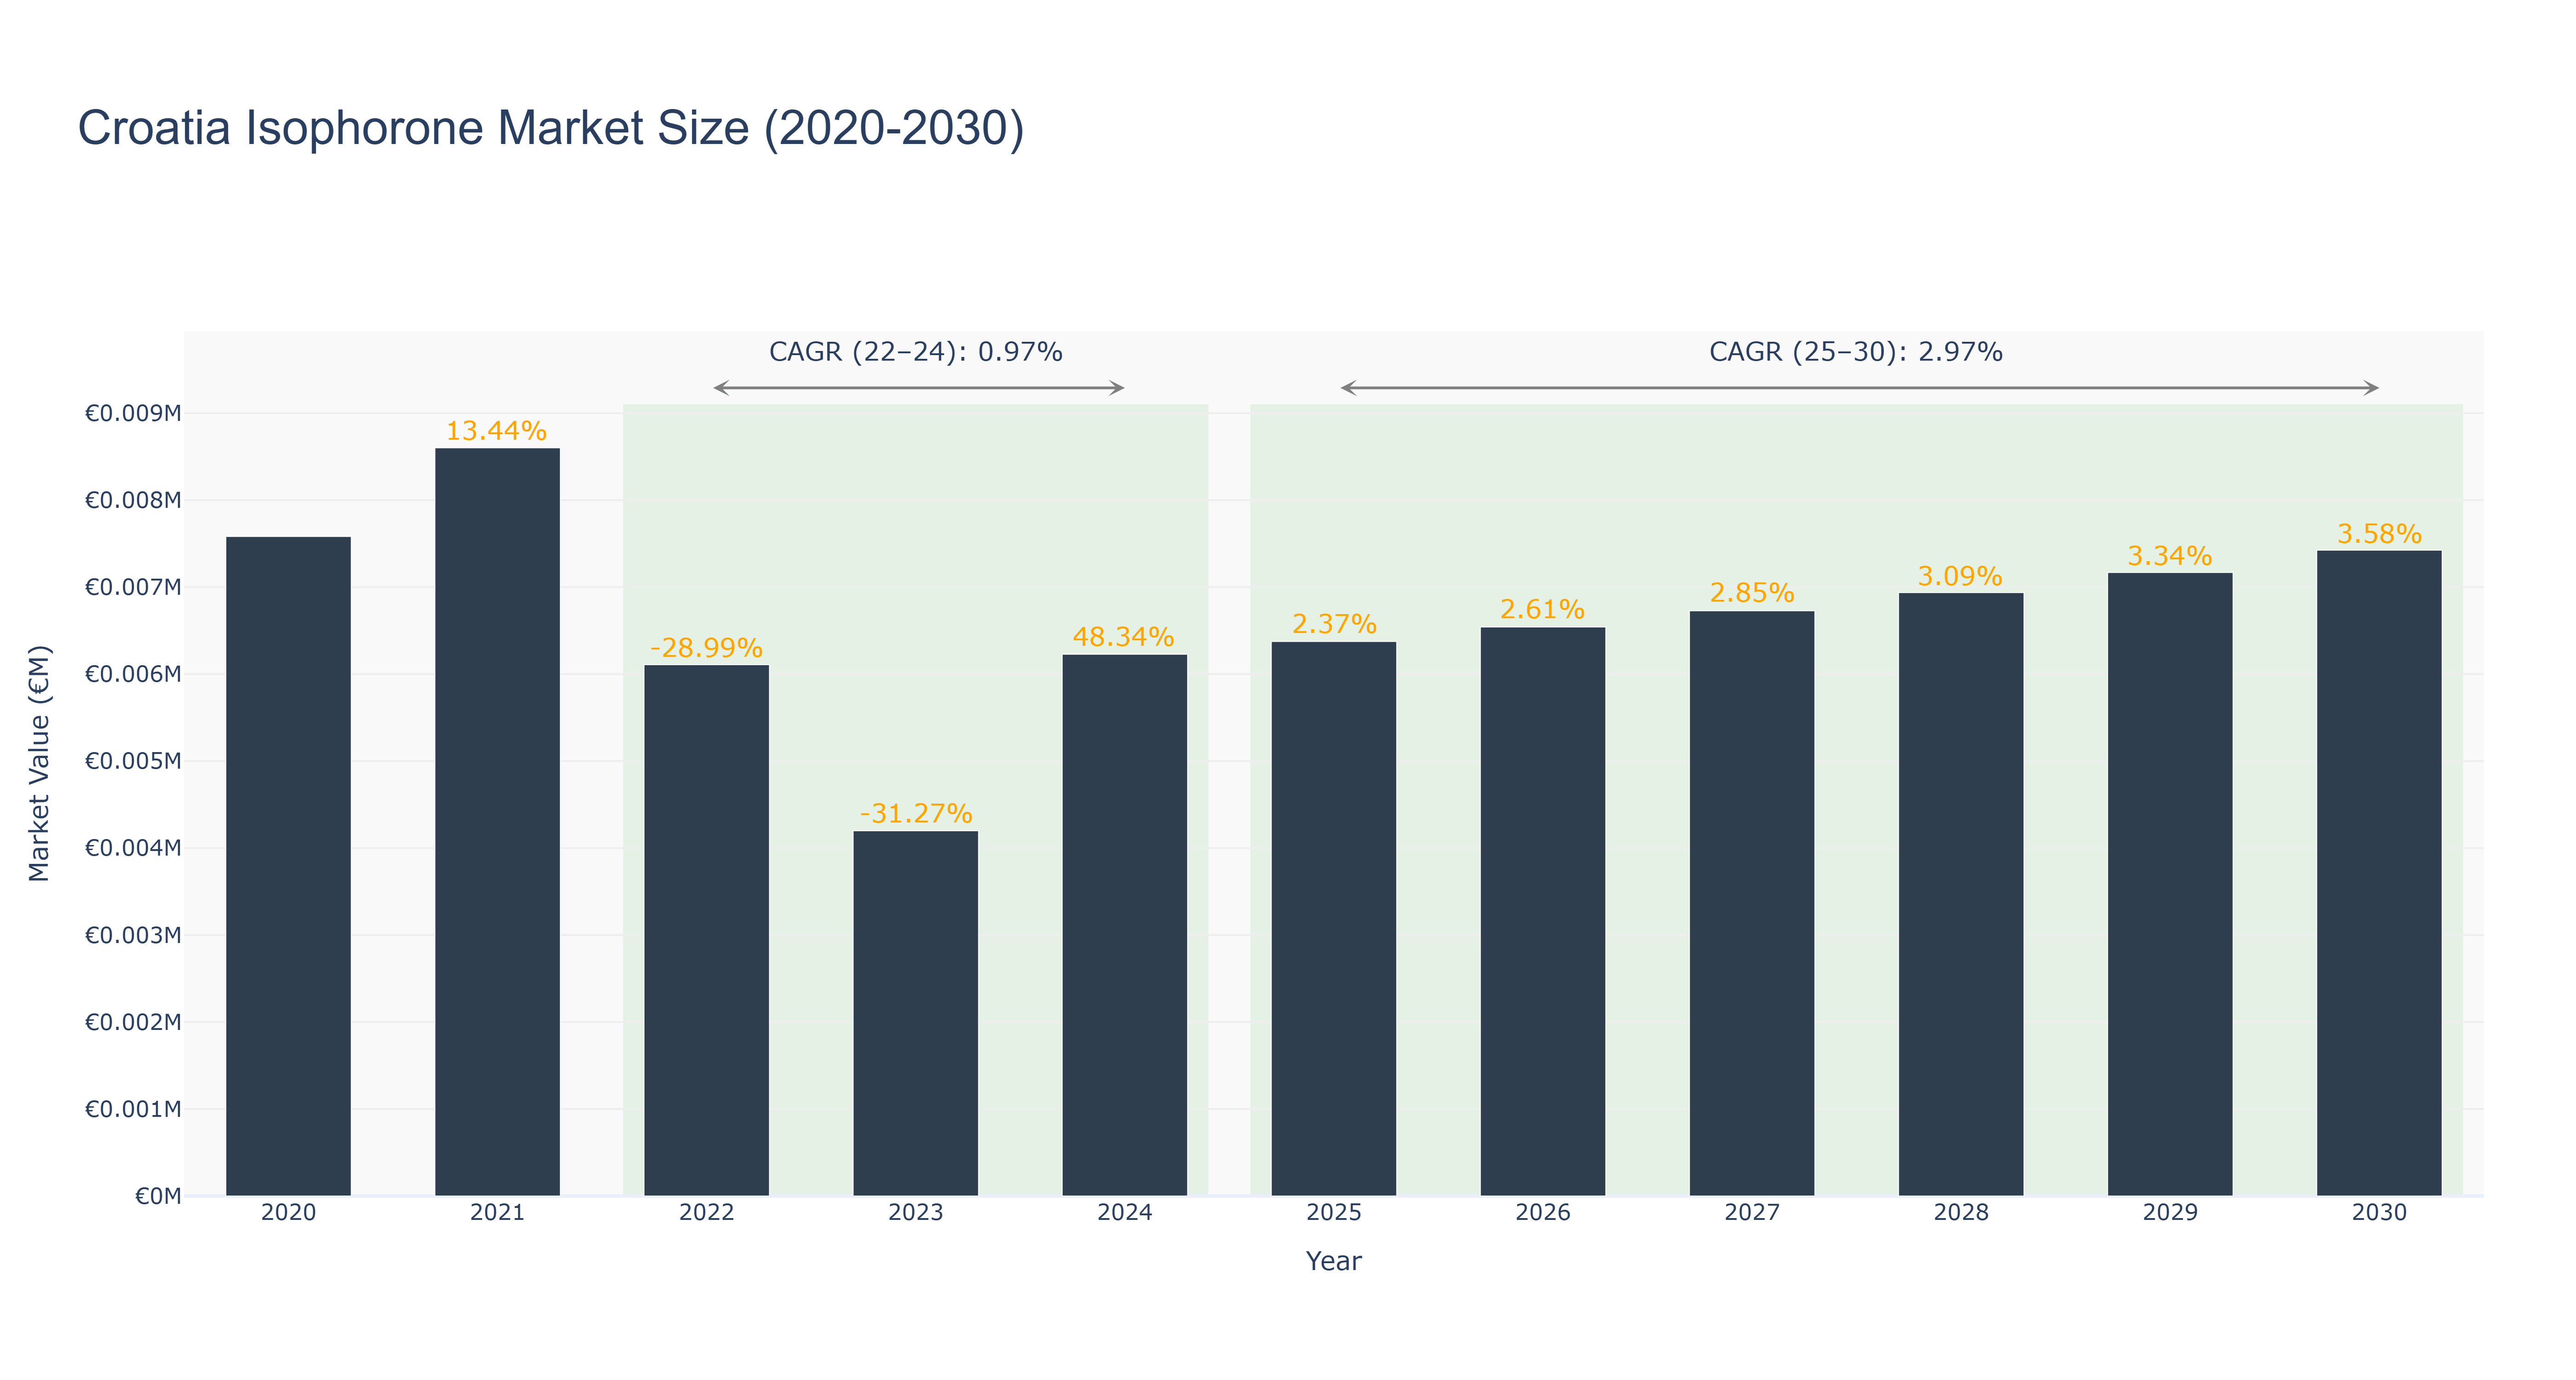
The Croatia Isophorone Market has experienced significant volatility in recent years, characterized by a peak market size of €8.60 thousand in 2021, followed by notable declines to €6.11 thousand in 2022 and €4.20 thousand in 2023. This actual data reflects a challenging environment, with a compounded annual growth rate (CAGR) of -28.99% in 2022 and -31.27% in 2023, culminating in a modest recovery to €6.23 thousand in 2024, resulting in a CAGR of 0.97% for the period from 2022 to 2024. Looking ahead, the forecasted market size is projected to grow steadily, reaching €7.42 thousand by 2030, with a CAGR of 2.97% from 2025 to 2030. This anticipated growth is driven by increased industrial applications and a resurgence in demand for specialty chemicals. The market's resilience will likely be bolstered by ongoing investments in manufacturing capabilities and sustainable practices within Croatia's chemical sector.
Croatia Isophorone Market: Production & Trade Performance (2019-2025)
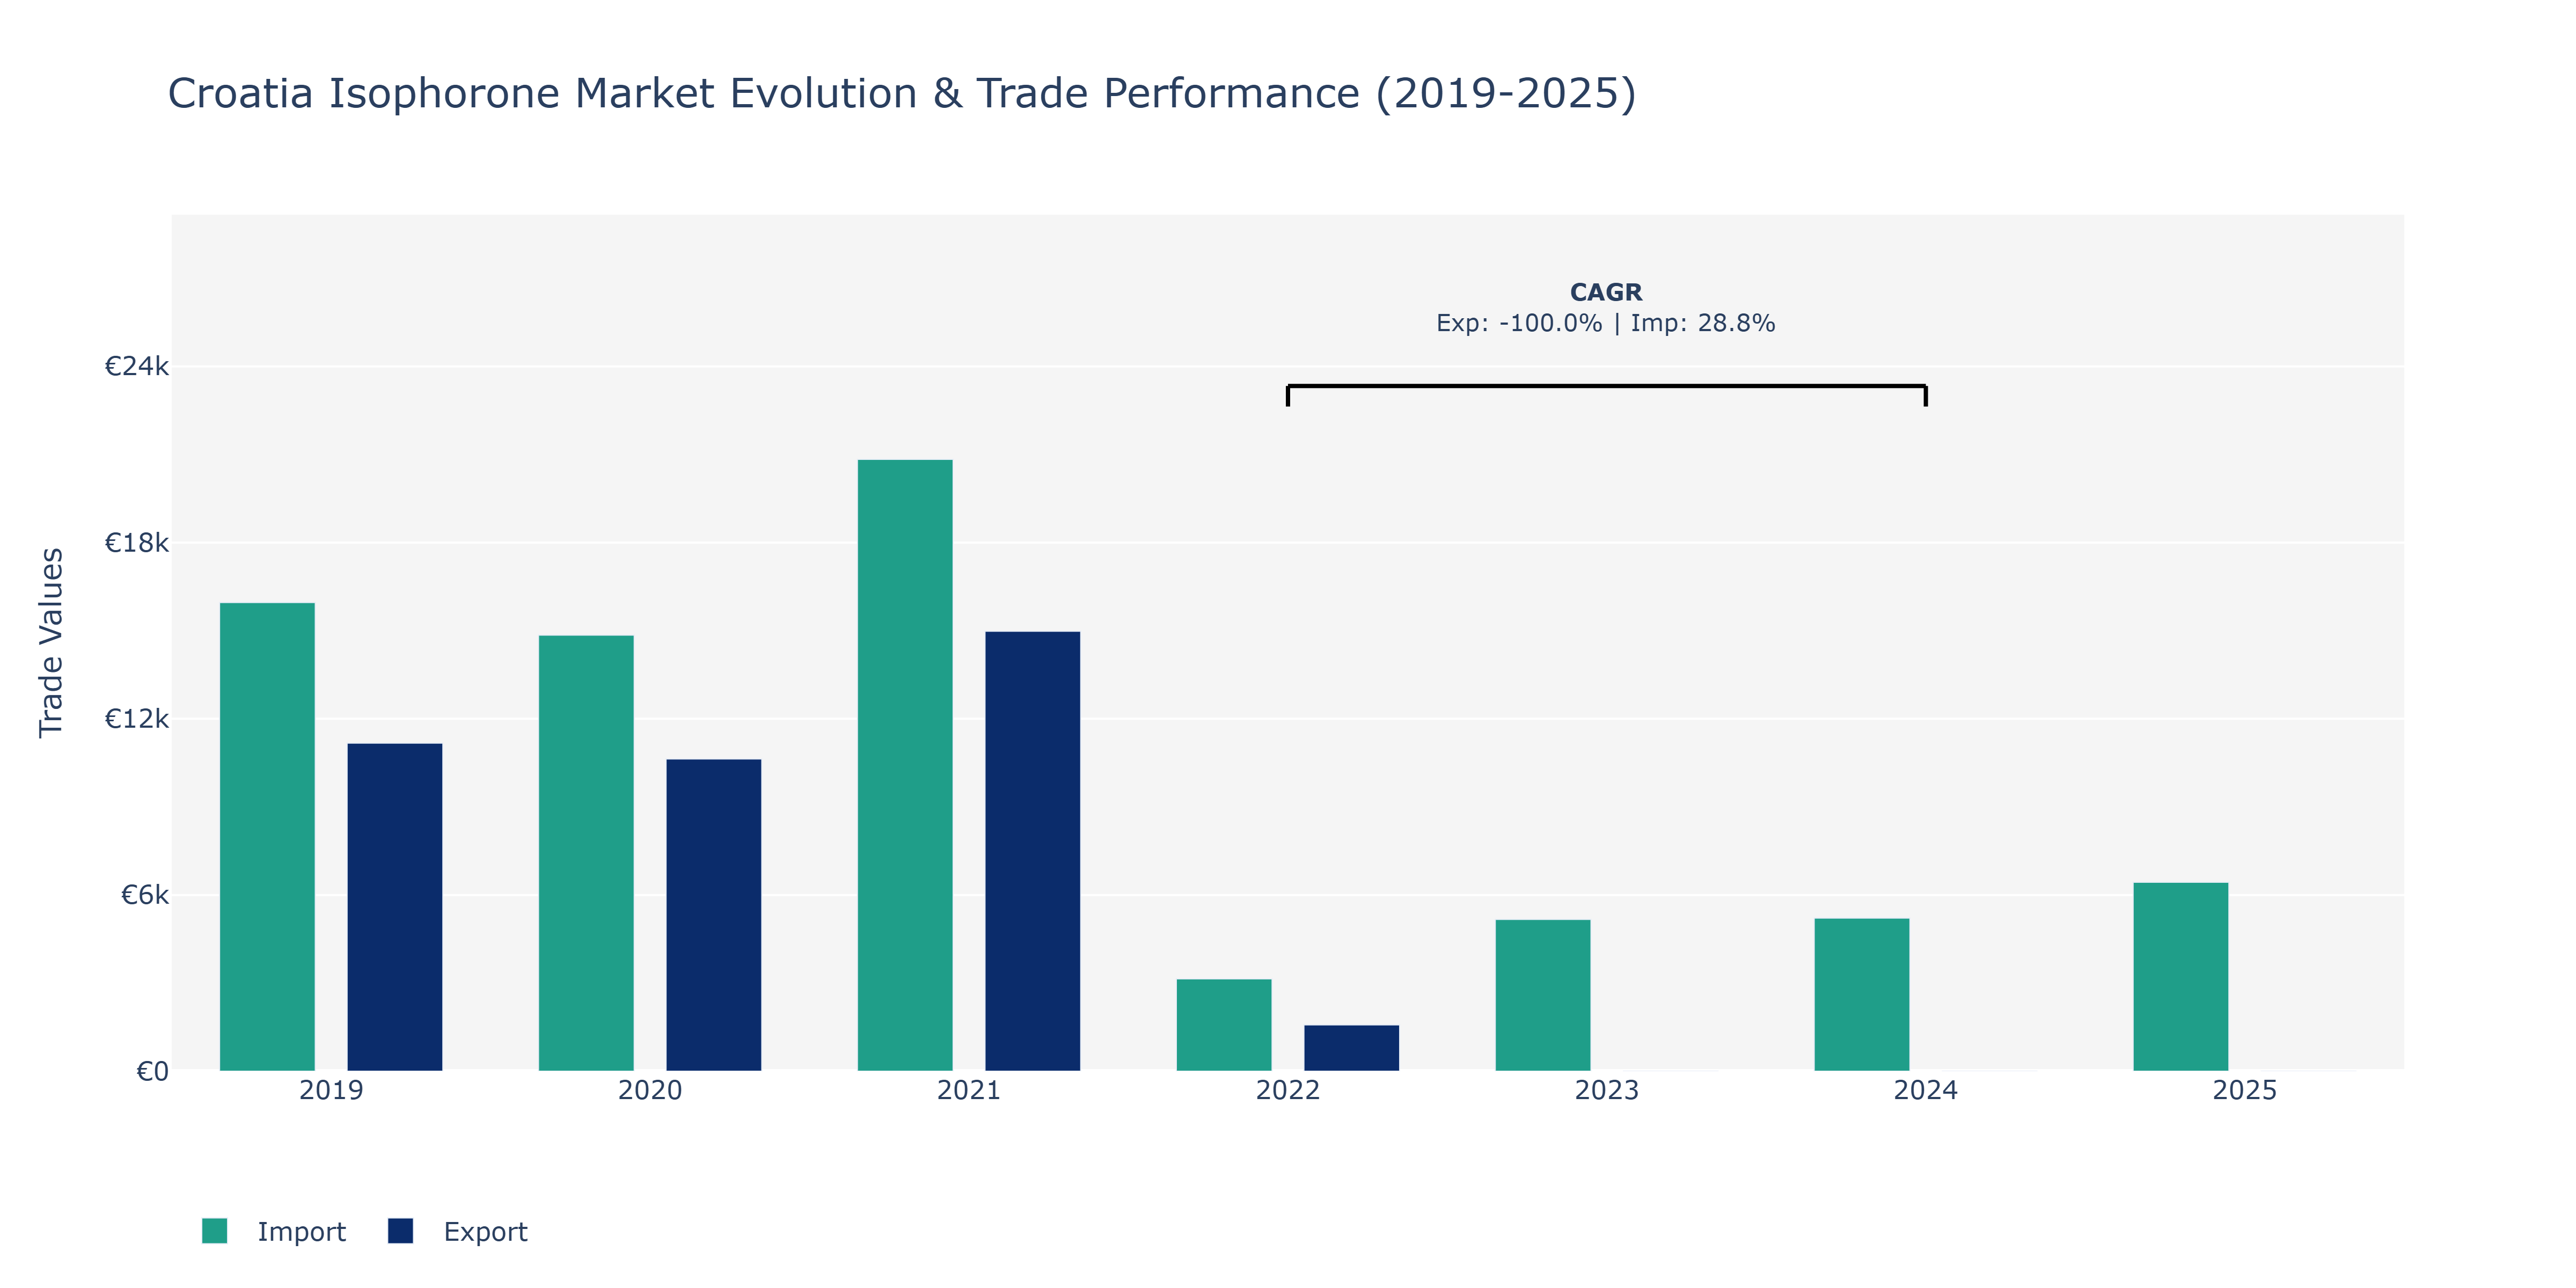
The Croatia Isophorone Market experienced notable fluctuations in both Exports and Imports from 2019 to 2025. In 2019, Exports stood at €11.17 thousand while Imports were significantly higher at €15.96 thousand. The following year, Exports declined to €10.63 thousand, and Imports decreased to €14.85 thousand. However, a sharp increase was observed in 2021 with Exports surging to €14.98 thousand and Imports to €20.83 thousand, indicating a substantial growth in trade volume. In 2022, Exports notably dropped to €1.57 thousand, while Imports decreased to €3.14 thousand. The subsequent years show an increasing trend in Imports, reaching €6.43 thousand by 2025. The considerable fluctuations in trade volumes can be attributed to various factors such as changes in demand, global market conditions, and regulatory policies impacting the Isophorone industry in Croatia. The rise in Imports post-2022 could be influenced by growing domestic consumption or increased production capacities requiring higher raw material imports. These trends highlight the market's sensitivity to external factors, necessitating strategic planning to navigate uncertainties and capitalize on emerging opportunities.
Key Highlights of the Report:
- Croatia Isophorone Market Outlook
- Market Size of Croatia Isophorone Market, 2025
- Forecast of Croatia Isophorone Market, 2032
- Historical Data and Forecast of Croatia Isophorone Revenues & Volume for the Period 2022 - 2032
- Croatia Isophorone Market Trend Evolution
- Croatia Isophorone Market Drivers and Challenges
- Croatia Isophorone Price Trends
- Croatia Isophorone Porter's Five Forces
- Croatia Isophorone Industry Life Cycle
- Historical Data and Forecast of Croatia Isophorone Market Revenues & Volume By End-user for the Period 2022 - 2032
- Historical Data and Forecast of Croatia Isophorone Market Revenues & Volume By Paints and Coatings for the Period 2022 - 2032
- Historical Data and Forecast of Croatia Isophorone Market Revenues & Volume By Printing Inks for the Period 2022 - 2032
- Historical Data and Forecast of Croatia Isophorone Market Revenues & Volume By Artificial Leather for the Period 2022 - 2032
- Historical Data and Forecast of Croatia Isophorone Market Revenues & Volume By Adhesives for the Period 2022 - 2032
- Historical Data and Forecast of Croatia Isophorone Market Revenues & Volume By Agrochemicals for the Period 2022 - 2032
- Historical Data and Forecast of Croatia Isophorone Market Revenues & Volume By Composites for the Period 2022 - 2032
- Historical Data and Forecast of Croatia Isophorone Market Revenues & Volume By Other for the Period 2022 - 2032
- Croatia Isophorone Import Export Trade Statistics
- Market Opportunity Assessment By End-user
- Croatia Isophorone Top Companies Market Share
- Croatia Isophorone Competitive Benchmarking By Technical and Operational Parameters
- Croatia Isophorone Company Profiles
- Croatia Isophorone Key Strategic Recommendations
Frequently Asked Questions About the Market Study (FAQs):
6Wresearch actively monitors the Croatia Isophorone Market and publishes its comprehensive annual report, highlighting emerging trends, growth drivers, revenue analysis, and forecast outlook. Our insights help businesses to make data-backed strategic decisions with ongoing market dynamics. Our analysts track relevent industries related to the Croatia Isophorone Market, allowing our clients with actionable intelligence and reliable forecasts tailored to emerging regional needs.
Yes, we provide customisation as per your requirements. To learn more, feel free to contact us on sales@6wresearch.com
1 Executive Summary |
2 Introduction |
2.1 Key Highlights of the Report |
2.2 Report Description |
2.3 Market Scope & Segmentation |
2.4 Research Methodology |
2.5 Assumptions |
3 Croatia Isophorone Market Overview |
3.1 Croatia Country Macro Economic Indicators |
3.2 Croatia Isophorone Market Revenues & Volume, 2022 & 2032F |
3.3 Croatia Isophorone Market - Industry Life Cycle |
3.4 Croatia Isophorone Market - Porter's Five Forces |
3.5 Croatia Isophorone Market Revenues & Volume Share, By End-user, 2022 & 2032F |
4 Croatia Isophorone Market Dynamics |
4.1 Impact Analysis |
4.2 Market Drivers |
4.2.1 Growth in the construction industry leading to increased demand for coatings and paints, where isophorone is used as a key ingredient. |
4.2.2 Rising adoption of isophorone in the production of pesticides and herbicides due to its effectiveness in agricultural applications. |
4.2.3 Increasing use of isophorone in the manufacturing of adhesives and sealants, driven by the growth of the automotive and electronics industries. |
4.3 Market Restraints |
4.3.1 Fluctuating raw material prices impacting the production costs of isophorone. |
4.3.2 Stringent environmental regulations regarding the use and disposal of chemicals like isophorone, leading to compliance challenges for manufacturers. |
4.3.3 Competition from alternative chemicals or substitutes that may offer similar properties at lower costs. |
5 Croatia Isophorone Market Trends |
6 Croatia Isophorone Market, By Types |
6.1 Croatia Isophorone Market, By End-user |
6.1.1 Overview and Analysis |
6.1.2 Croatia Isophorone Market Revenues & Volume, By End-user, 2022 - 2032F |
6.1.3 Croatia Isophorone Market Revenues & Volume, By Paints and Coatings, 2022 - 2032F |
6.1.4 Croatia Isophorone Market Revenues & Volume, By Printing Inks, 2022 - 2032F |
6.1.5 Croatia Isophorone Market Revenues & Volume, By Artificial Leather, 2022 - 2032F |
6.1.6 Croatia Isophorone Market Revenues & Volume, By Adhesives, 2022 - 2032F |
6.1.7 Croatia Isophorone Market Revenues & Volume, By Agrochemicals, 2022 - 2032F |
6.1.8 Croatia Isophorone Market Revenues & Volume, By Composites, 2022 - 2032F |
7 Croatia Isophorone Market Import-Export Trade Statistics |
7.1 Croatia Isophorone Market Export to Major Countries |
7.2 Croatia Isophorone Market Imports from Major Countries |
8 Croatia Isophorone Market Key Performance Indicators |
8.1 Average selling price of isophorone in the Croatian market, indicating the value perception and pricing trends. |
8.2 Percentage of market penetration of isophorone in key end-user industries, reflecting the adoption rate and potential for growth. |
8.3 Research and development investment in innovative applications of isophorone, showcasing the potential for expanding market opportunities. |
9 Croatia Isophorone Market - Opportunity Assessment |
9.1 Croatia Isophorone Market Opportunity Assessment, By End-user, 2022 & 2032F |
10 Croatia Isophorone Market - Competitive Landscape |
10.1 Croatia Isophorone Market Revenue Share, By Companies, 2025 |
10.2 Croatia Isophorone Market Competitive Benchmarking, By Operating and Technical Parameters |
11 Company Profiles |
12 Recommendations |
13 Disclaimer |
Global Go To Market Strategy - 2030
Export potential enables firms to identify high-growth global markets with greater confidence by combining advanced trade intelligence with a structured quantitative methodology. The framework analyzes emerging demand trends and country-level import patterns while integrating macroeconomic and trade datasets such as GDP and population forecasts, bilateral import–export flows, tariff structures, elasticity differentials between developed and developing economies, geographic distance, and import demand projections. Using weighted trade values from 2020–2024 as the base period to project country-to-country export potential for 2030, these inputs are operationalized through calculated drivers such as gravity model parameters, tariff impact factors, and projected GDP per-capita growth. Through an analysis of hidden potentials, demand hotspots, and market conditions that are most favorable to success, this method enables firms to focus on target countries, maximize returns, and global expansion with data, backed by accuracy.
By factoring in the projected importer demand gap that is currently unmet and could be potential opportunity, it identifies the potential for the Exporter (Country) among 190 countries, against the general trade analysis, which identifies the biggest importer or exporter.
To discover high-growth global markets and optimize your business strategy:
Click Here
Pricing
- Single User License$ 1,995
- Department License$ 2,400
- Site License$ 3,120
- Global License$ 3,795

Leadership Perspectives from Industry Events
Search
Thought Leadership and Analyst Meet


Our Clients
6WResearch In News
- India Export Attractiveness Tracker 2026
- India Air Conditioner Market Set for Strong Rebound in 2026 After Weather-Led Correction and GST-Driven Recovery: 6Wresearch
- ADAS in India: How Automatic Emergency Braking, Blind Spot Detection & Driver Monitoring are Transforming Road Safety
- Doha a strategic location for EV manufacturing hub: IPA Qatar
- Demand for luxury TVs surging in the GCC, says Samsung
- Empowering Growth: The Thriving Journey of Bangladesh’s Cable Industry
Latest Reports
- Nicaragua RPG Gaming Market (2026-2032)
- New Zealand RPG Gaming Market (2026-2032)
- Netherlands RPG Gaming Market (2026-2032)
- Nauru RPG Gaming Market (2026-2032)
- Namibia RPG Gaming Market (2026-2032)
- Mozambique RPG Gaming Market (2026-2032)
- Montenegro RPG Gaming Market (2026-2032)
- Mongolia RPG Gaming Market (2026-2032)
- Monaco RPG Gaming Market (2026-2032)
- Micronesia RPG Gaming Market (2026-2032)
Industry Events and Analyst Meet

EV India Expo 2026

HIMTEX 2026

India Refining Summit 2026

India EV Show 2026

EV tech India Expo 2026
Whitepaper
- Middle East & Africa Commercial Security Market Click here to view more.
- Middle East & Africa Fire Safety Systems & Equipment Market Click here to view more.
- GCC Drone Market Click here to view more.
- Middle East Lighting Fixture Market Click here to view more.
- GCC Physical & Perimeter Security Market Click here to view more.