Croatia Laptops Market (2026-2032) | Opportunities, Restraints, Revenue, Companies, Pricing Analysis, Competition, Forecast, Value, Strategic Insights, Competitive, Demand, Size, Drivers, Investment Trends, Share, Industry, Analysis, Trends, Segments, Segmentation, Strategy, Challenges, Growth, Consumer Insights, Outlook, Supply
Market Forecast By Type (Ultrabooks, Gaming Laptops, Business Laptops, Convertible Laptops, Rugged Laptops), By Processor (Intel Core i7, AMD Ryzen 9, Apple M1, Qualcomm Snapdragon, Intel Xeon), By Operating System (Windows, macOS, Linux, Chrome OS, Ubuntu), By Screen Size (13-14 inches, 15-16 inches, 17+ inches, 10-12 inches, Touchscreen), By Application (Business, Gaming, Education, Personal Use, Industrial) And Competitive Landscape
| Product Code: ETC12627413 | Publication Date: Apr 2025 | Updated Date: Apr 2026 | Product Type: Market Research Report | |
| Publisher: 6Wresearch | No. of Pages: 65 | No. of Figures: 34 | No. of Tables: 19 | |
Croatia Laptops Market Size (2020-2030)
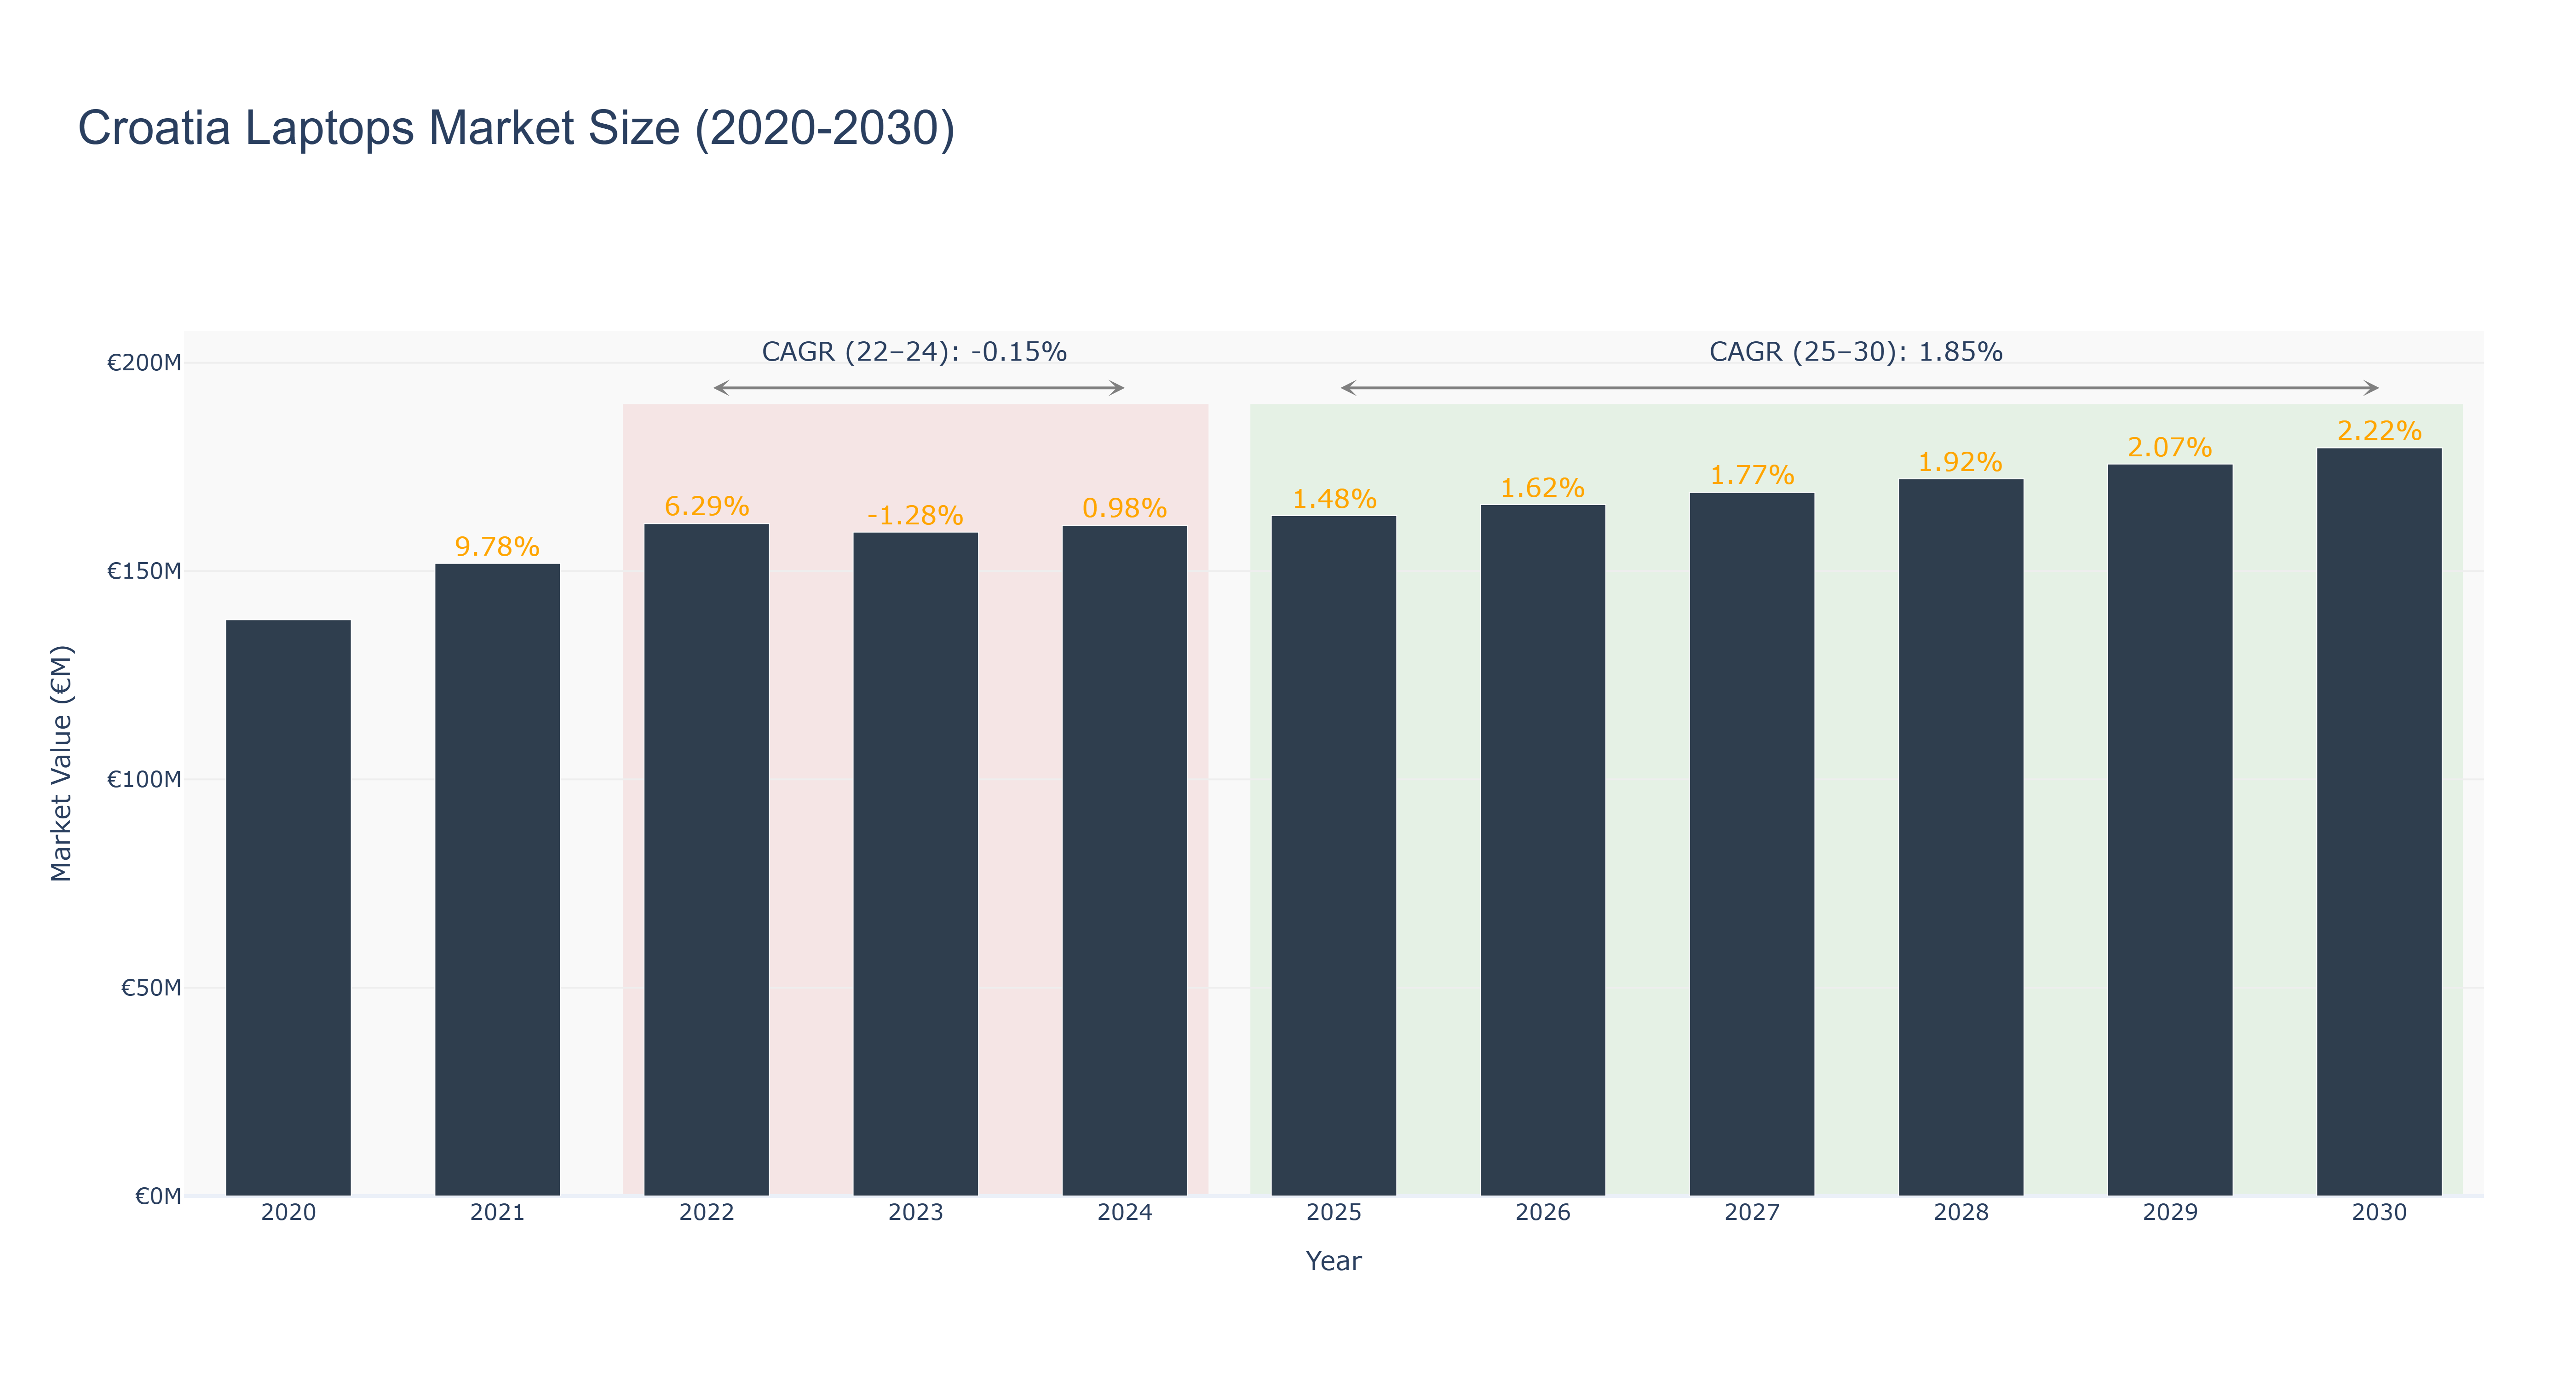
Croatia Laptops Market has shown a fluctuating trend in recent years. The peak market size of €179.60 million is forecasted for 2030, with a steady growth trajectory. The actual market size saw a slight decrease from 2022 to 2024, attributed to technological advancements leading to longer replacement cycles for laptops. However, a positive upturn is expected from 2025 to 2030, with a forecasted CAGR of 1.85%, driven by increasing demand for portable computing devices and a growing remote workforce. Recent developments in the market include collaborations between local tech companies and international brands to introduce innovative laptop models tailored to the Croatian market. Looking ahead, the market is poised for further growth as digital transformation initiatives in the country drive the adoption of laptops for both personal and professional use.
Croatia Laptops Market: Production & Trade Performance (2019-2025)
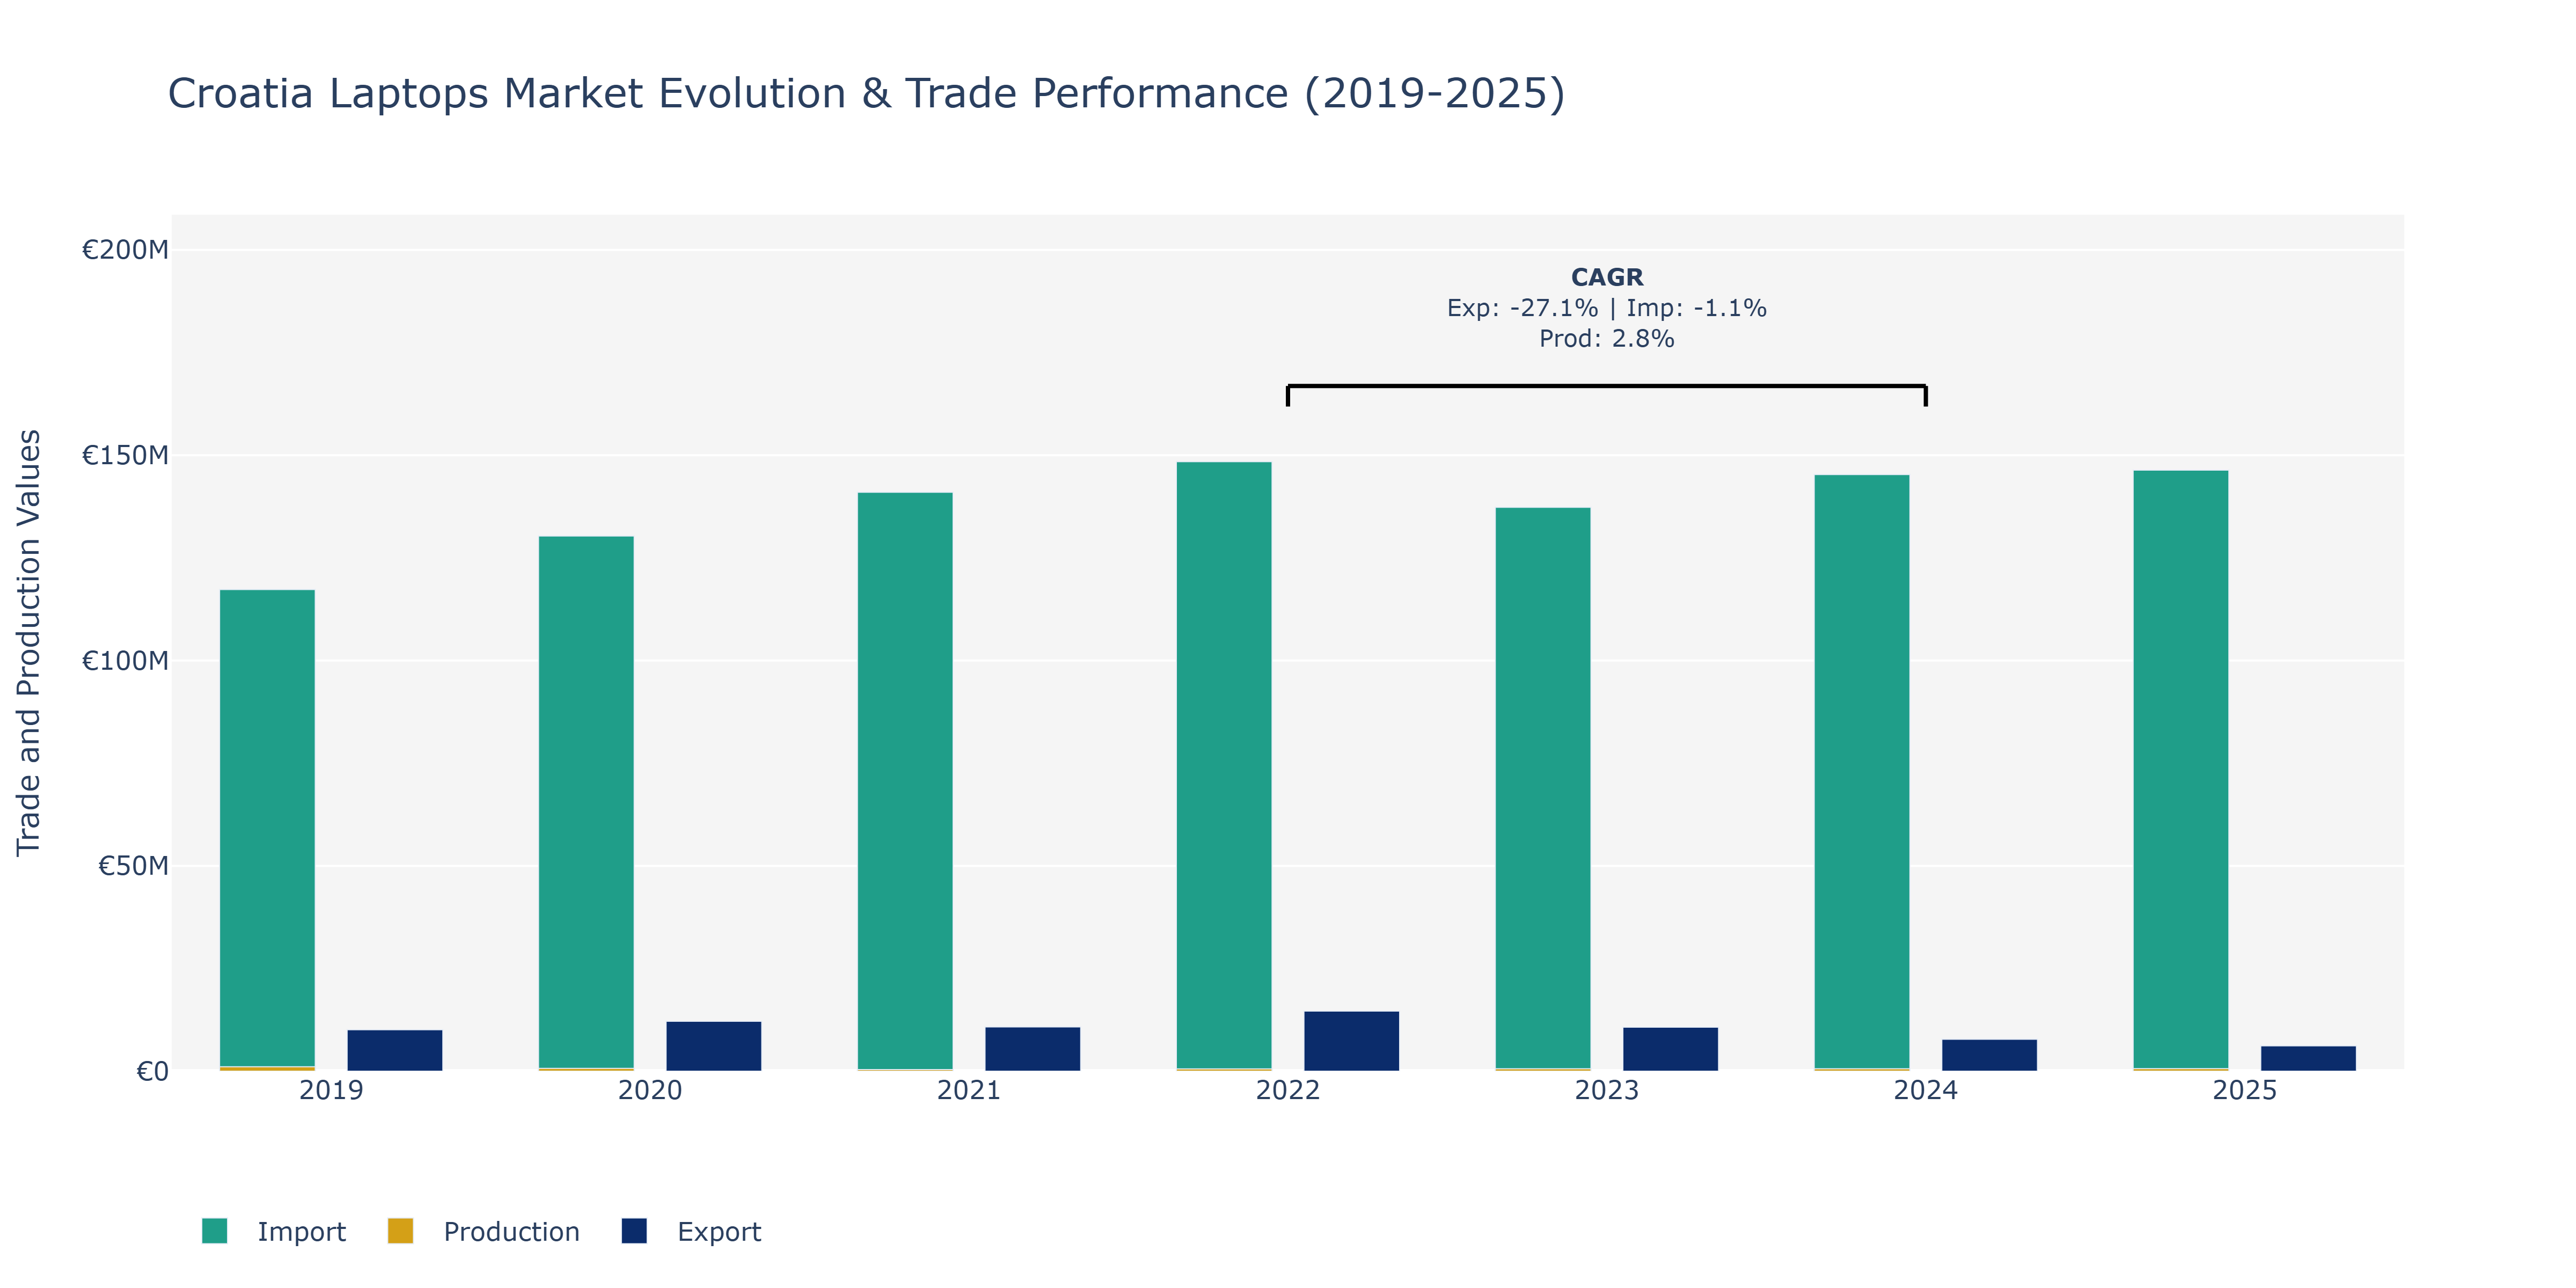
In the Croatia Laptops Market, exports experienced fluctuations over the years, starting at €10.11 million in 2019, reaching a peak of €14.65 million in 2022, and then declining to €6.17 million in 2025. Imports also fluctuated, starting at €117.29 million in 2019, peaking at €148.43 million in 2022, and decreasing to €146.38 million in 2025. Production value varied as well, starting at €1.09 billion in 2019, declining to €0.59 billion in 2024, and then increasing slightly to €0.61 billion in 2025. The decline in exports post-2022 could be attributed to increasing competition in the global laptop market, technological advancements favoring other countries, and shifts in consumer preferences towards alternative electronic devices. The fluctuations in imports could be influenced by changes in domestic demand, currency exchange rates, and international trade agreements affecting import costs.
Key Highlights of the Report:
- Croatia Laptops Market Outlook
- Market Size of Croatia Laptops Market, 2025
- Forecast of Croatia Laptops Market, 2032
- Historical Data and Forecast of Croatia Laptops Revenues & Volume for the Period 2022 - 2032F
- Croatia Laptops Market Trend Evolution
- Croatia Laptops Market Drivers and Challenges
- Croatia Laptops Price Trends
- Croatia Laptops Porter's Five Forces
- Croatia Laptops Industry Life Cycle
- Historical Data and Forecast of Croatia Laptops Market Revenues & Volume By Type for the Period 2022 - 2032F
- Historical Data and Forecast of Croatia Laptops Market Revenues & Volume By Ultrabooks for the Period 2022 - 2032F
- Historical Data and Forecast of Croatia Laptops Market Revenues & Volume By Gaming Laptops for the Period 2022 - 2032F
- Historical Data and Forecast of Croatia Laptops Market Revenues & Volume By Business Laptops for the Period 2022 - 2032F
- Historical Data and Forecast of Croatia Laptops Market Revenues & Volume By Convertible Laptops for the Period 2022 - 2032F
- Historical Data and Forecast of Croatia Laptops Market Revenues & Volume By Rugged Laptops for the Period 2022 - 2032F
- Historical Data and Forecast of Croatia Laptops Market Revenues & Volume By Processor for the Period 2022 - 2032F
- Historical Data and Forecast of Croatia Laptops Market Revenues & Volume By Intel Core i7 for the Period 2022 - 2032F
- Historical Data and Forecast of Croatia Laptops Market Revenues & Volume By AMD Ryzen 9 for the Period 2022 - 2032F
- Historical Data and Forecast of Croatia Laptops Market Revenues & Volume By Apple M1 for the Period 2022 - 2032F
- Historical Data and Forecast of Croatia Laptops Market Revenues & Volume By Qualcomm Snapdragon for the Period 2022 - 2032F
- Historical Data and Forecast of Croatia Laptops Market Revenues & Volume By Intel Xeon for the Period 2022 - 2032F
- Historical Data and Forecast of Croatia Laptops Market Revenues & Volume By Operating System for the Period 2022 - 2032F
- Historical Data and Forecast of Croatia Laptops Market Revenues & Volume By Windows for the Period 2022 - 2032F
- Historical Data and Forecast of Croatia Laptops Market Revenues & Volume By macOS for the Period 2022 - 2032F
- Historical Data and Forecast of Croatia Laptops Market Revenues & Volume By Linux for the Period 2022 - 2032F
- Historical Data and Forecast of Croatia Laptops Market Revenues & Volume By Chrome OS for the Period 2022 - 2032F
- Historical Data and Forecast of Croatia Laptops Market Revenues & Volume By Ubuntu for the Period 2022 - 2032F
- Historical Data and Forecast of Croatia Laptops Market Revenues & Volume By Screen Size for the Period 2022 - 2032F
- Historical Data and Forecast of Croatia Laptops Market Revenues & Volume By 13-14 inches for the Period 2022 - 2032F
- Historical Data and Forecast of Croatia Laptops Market Revenues & Volume By 15-16 inches for the Period 2022 - 2032F
- Historical Data and Forecast of Croatia Laptops Market Revenues & Volume By 17+ inches for the Period 2022 - 2032F
- Historical Data and Forecast of Croatia Laptops Market Revenues & Volume By 10-12 inches for the Period 2022 - 2032F
- Historical Data and Forecast of Croatia Laptops Market Revenues & Volume By Touchscreen for the Period 2022 - 2032F
- Historical Data and Forecast of Croatia Laptops Market Revenues & Volume By Application for the Period 2022 - 2032F
- Historical Data and Forecast of Croatia Laptops Market Revenues & Volume By Business for the Period 2022 - 2032F
- Historical Data and Forecast of Croatia Laptops Market Revenues & Volume By Gaming for the Period 2022 - 2032F
- Historical Data and Forecast of Croatia Laptops Market Revenues & Volume By Education for the Period 2022 - 2032F
- Historical Data and Forecast of Croatia Laptops Market Revenues & Volume By Personal Use for the Period 2022 - 2032F
- Historical Data and Forecast of Croatia Laptops Market Revenues & Volume By Industrial for the Period 2022 - 2032F
- Croatia Laptops Import Export Trade Statistics
- Market Opportunity Assessment By Type
- Market Opportunity Assessment By Processor
- Market Opportunity Assessment By Operating System
- Market Opportunity Assessment By Screen Size
- Market Opportunity Assessment By Application
- Croatia Laptops Top Companies Market Share
- Croatia Laptops Competitive Benchmarking By Technical and Operational Parameters
- Croatia Laptops Company Profiles
- Croatia Laptops Key Strategic Recommendations
Frequently Asked Questions About the Market Study (FAQs):
6Wresearch actively monitors the Croatia Laptops Market and publishes its comprehensive annual report, highlighting emerging trends, growth drivers, revenue analysis, and forecast outlook. Our insights help businesses to make data-backed strategic decisions with ongoing market dynamics. Our analysts track relevent industries related to the Croatia Laptops Market, allowing our clients with actionable intelligence and reliable forecasts tailored to emerging regional needs.
Yes, we provide customisation as per your requirements. To learn more, feel free to contact us on sales@6wresearch.com
1 Executive Summary |
2 Introduction |
2.1 Key Highlights of the Report |
2.2 Report Description |
2.3 Market Scope & Segmentation |
2.4 Research Methodology |
2.5 Assumptions |
3 Croatia Laptops Market Overview |
3.1 Croatia Country Macro Economic Indicators |
3.2 Croatia Laptops Market Revenues & Volume, 2022 & 2032F |
3.3 Croatia Laptops Market - Industry Life Cycle |
3.4 Croatia Laptops Market - Porter's Five Forces |
3.5 Croatia Laptops Market Revenues & Volume Share, By Type, 2022 & 2032F |
3.6 Croatia Laptops Market Revenues & Volume Share, By Processor, 2022 & 2032F |
3.7 Croatia Laptops Market Revenues & Volume Share, By Operating System, 2022 & 2032F |
3.8 Croatia Laptops Market Revenues & Volume Share, By Screen Size, 2022 & 2032F |
3.9 Croatia Laptops Market Revenues & Volume Share, By Application, 2022 & 2032F |
4 Croatia Laptops Market Dynamics |
4.1 Impact Analysis |
4.2 Market Drivers |
4.2.1 Increasing demand for portable computing devices due to remote working and learning trends. |
4.2.2 Growth in the gaming industry leading to a higher demand for high-performance laptops. |
4.2.3 Technological advancements and innovations driving upgrades and replacements in the market. |
4.3 Market Restraints |
4.3.1 Economic uncertainty affecting consumer purchasing power. |
4.3.2 Shortage of critical components impacting supply chain and pricing. |
4.3.3 Competition from other devices like tablets and smartphones affecting laptop sales. |
5 Croatia Laptops Market Trends |
6 Croatia Laptops Market, By Types |
6.1 Croatia Laptops Market, By Type |
6.1.1 Overview and Analysis |
6.1.2 Croatia Laptops Market Revenues & Volume, By Type, 2022 - 2032F |
6.1.3 Croatia Laptops Market Revenues & Volume, By Ultrabooks, 2022 - 2032F |
6.1.4 Croatia Laptops Market Revenues & Volume, By Gaming Laptops, 2022 - 2032F |
6.1.5 Croatia Laptops Market Revenues & Volume, By Business Laptops, 2022 - 2032F |
6.1.6 Croatia Laptops Market Revenues & Volume, By Convertible Laptops, 2022 - 2032F |
6.1.7 Croatia Laptops Market Revenues & Volume, By Rugged Laptops, 2022 - 2032F |
6.2 Croatia Laptops Market, By Processor |
6.2.1 Overview and Analysis |
6.2.2 Croatia Laptops Market Revenues & Volume, By Intel Core i7, 2022 - 2032F |
6.2.3 Croatia Laptops Market Revenues & Volume, By AMD Ryzen 9, 2022 - 2032F |
6.2.4 Croatia Laptops Market Revenues & Volume, By Apple M1, 2022 - 2032F |
6.2.5 Croatia Laptops Market Revenues & Volume, By Qualcomm Snapdragon, 2022 - 2032F |
6.2.6 Croatia Laptops Market Revenues & Volume, By Intel Xeon, 2022 - 2032F |
6.3 Croatia Laptops Market, By Operating System |
6.3.1 Overview and Analysis |
6.3.2 Croatia Laptops Market Revenues & Volume, By Windows, 2022 - 2032F |
6.3.3 Croatia Laptops Market Revenues & Volume, By macOS, 2022 - 2032F |
6.3.4 Croatia Laptops Market Revenues & Volume, By Linux, 2022 - 2032F |
6.3.5 Croatia Laptops Market Revenues & Volume, By Chrome OS, 2022 - 2032F |
6.3.6 Croatia Laptops Market Revenues & Volume, By Ubuntu, 2022 - 2032F |
6.4 Croatia Laptops Market, By Screen Size |
6.4.1 Overview and Analysis |
6.4.2 Croatia Laptops Market Revenues & Volume, By 13-14 inches, 2022 - 2032F |
6.4.3 Croatia Laptops Market Revenues & Volume, By 15-16 inches, 2022 - 2032F |
6.4.4 Croatia Laptops Market Revenues & Volume, By 17+ inches, 2022 - 2032F |
6.4.5 Croatia Laptops Market Revenues & Volume, By 10-12 inches, 2022 - 2032F |
6.4.6 Croatia Laptops Market Revenues & Volume, By Touchscreen, 2022 - 2032F |
6.5 Croatia Laptops Market, By Application |
6.5.1 Overview and Analysis |
6.5.2 Croatia Laptops Market Revenues & Volume, By Business, 2022 - 2032F |
6.5.3 Croatia Laptops Market Revenues & Volume, By Gaming, 2022 - 2032F |
6.5.4 Croatia Laptops Market Revenues & Volume, By Education, 2022 - 2032F |
6.5.5 Croatia Laptops Market Revenues & Volume, By Personal Use, 2022 - 2032F |
6.5.6 Croatia Laptops Market Revenues & Volume, By Industrial, 2022 - 2032F |
7 Croatia Laptops Market Import-Export Trade Statistics |
7.1 Croatia Laptops Market Export to Major Countries |
7.2 Croatia Laptops Market Imports from Major Countries |
8 Croatia Laptops Market Key Performance Indicators |
8.1 Average selling price (ASP) of laptops in Croatia. |
8.2 Percentage of laptops equipped with the latest processors or graphics cards. |
8.3 Adoption rate of new laptop technologies or features in the market. |
8.4 Average lifespan of laptops before replacement or upgrade. |
8.5 Percentage of laptops sold with extended warranties or service packages. |
9 Croatia Laptops Market - Opportunity Assessment |
9.1 Croatia Laptops Market Opportunity Assessment, By Type, 2022 & 2032F |
9.2 Croatia Laptops Market Opportunity Assessment, By Processor, 2022 & 2032F |
9.3 Croatia Laptops Market Opportunity Assessment, By Operating System, 2022 & 2032F |
9.4 Croatia Laptops Market Opportunity Assessment, By Screen Size, 2022 & 2032F |
9.5 Croatia Laptops Market Opportunity Assessment, By Application, 2022 & 2032F |
10 Croatia Laptops Market - Competitive Landscape |
10.1 Croatia Laptops Market Revenue Share, By Companies, 2025 |
10.2 Croatia Laptops Market Competitive Benchmarking, By Operating and Technical Parameters |
11 Company Profiles |
12 Recommendations |
13 Disclaimer |
Global Go To Market Strategy - 2030
Export potential enables firms to identify high-growth global markets with greater confidence by combining advanced trade intelligence with a structured quantitative methodology. The framework analyzes emerging demand trends and country-level import patterns while integrating macroeconomic and trade datasets such as GDP and population forecasts, bilateral import–export flows, tariff structures, elasticity differentials between developed and developing economies, geographic distance, and import demand projections. Using weighted trade values from 2020–2024 as the base period to project country-to-country export potential for 2030, these inputs are operationalized through calculated drivers such as gravity model parameters, tariff impact factors, and projected GDP per-capita growth. Through an analysis of hidden potentials, demand hotspots, and market conditions that are most favorable to success, this method enables firms to focus on target countries, maximize returns, and global expansion with data, backed by accuracy.
By factoring in the projected importer demand gap that is currently unmet and could be potential opportunity, it identifies the potential for the Exporter (Country) among 190 countries, against the general trade analysis, which identifies the biggest importer or exporter.
To discover high-growth global markets and optimize your business strategy:
Click Here
Pricing
- Single User License$ 1,995
- Department License$ 2,400
- Site License$ 3,120
- Global License$ 3,795

Leadership Perspectives from Industry Events
Search
Thought Leadership and Analyst Meet


Our Clients
6WResearch In News
- India Export Attractiveness Tracker 2026
- India Air Conditioner Market Set for Strong Rebound in 2026 After Weather-Led Correction and GST-Driven Recovery: 6Wresearch
- ADAS in India: How Automatic Emergency Braking, Blind Spot Detection & Driver Monitoring are Transforming Road Safety
- Doha a strategic location for EV manufacturing hub: IPA Qatar
- Demand for luxury TVs surging in the GCC, says Samsung
- Empowering Growth: The Thriving Journey of Bangladesh’s Cable Industry
Latest Reports
- Nicaragua RPG Gaming Market (2026-2032)
- New Zealand RPG Gaming Market (2026-2032)
- Netherlands RPG Gaming Market (2026-2032)
- Nauru RPG Gaming Market (2026-2032)
- Namibia RPG Gaming Market (2026-2032)
- Mozambique RPG Gaming Market (2026-2032)
- Montenegro RPG Gaming Market (2026-2032)
- Mongolia RPG Gaming Market (2026-2032)
- Monaco RPG Gaming Market (2026-2032)
- Micronesia RPG Gaming Market (2026-2032)
Industry Events and Analyst Meet

EV India Expo 2026

HIMTEX 2026

India Refining Summit 2026

India EV Show 2026

EV tech India Expo 2026
Whitepaper
- Middle East & Africa Commercial Security Market Click here to view more.
- Middle East & Africa Fire Safety Systems & Equipment Market Click here to view more.
- GCC Drone Market Click here to view more.
- Middle East Lighting Fixture Market Click here to view more.
- GCC Physical & Perimeter Security Market Click here to view more.