Croatia Manganese Market (2025-2031) | Size, Revenue, Value, Outlook, Share, Growth, Analysis, Companies, Segmentation, Forecast, Trends & Industry
Market Forecast By Application (Alloys, Others), By Metallurgical Application (High-Carbon Ferromanganese, Refined Ferromanganese, Silico manganese, Others), By End-User Industry (Steel, Batteries, Others) And Competitive Landscape
| Product Code: ETC4750649 | Publication Date: Nov 2023 | Updated Date: Oct 2025 | Product Type: Market Research Report | |
| Publisher: 6Wresearch | Author: Sachin Kumar Rai | No. of Pages: 60 | No. of Figures: 30 | No. of Tables: 5 |
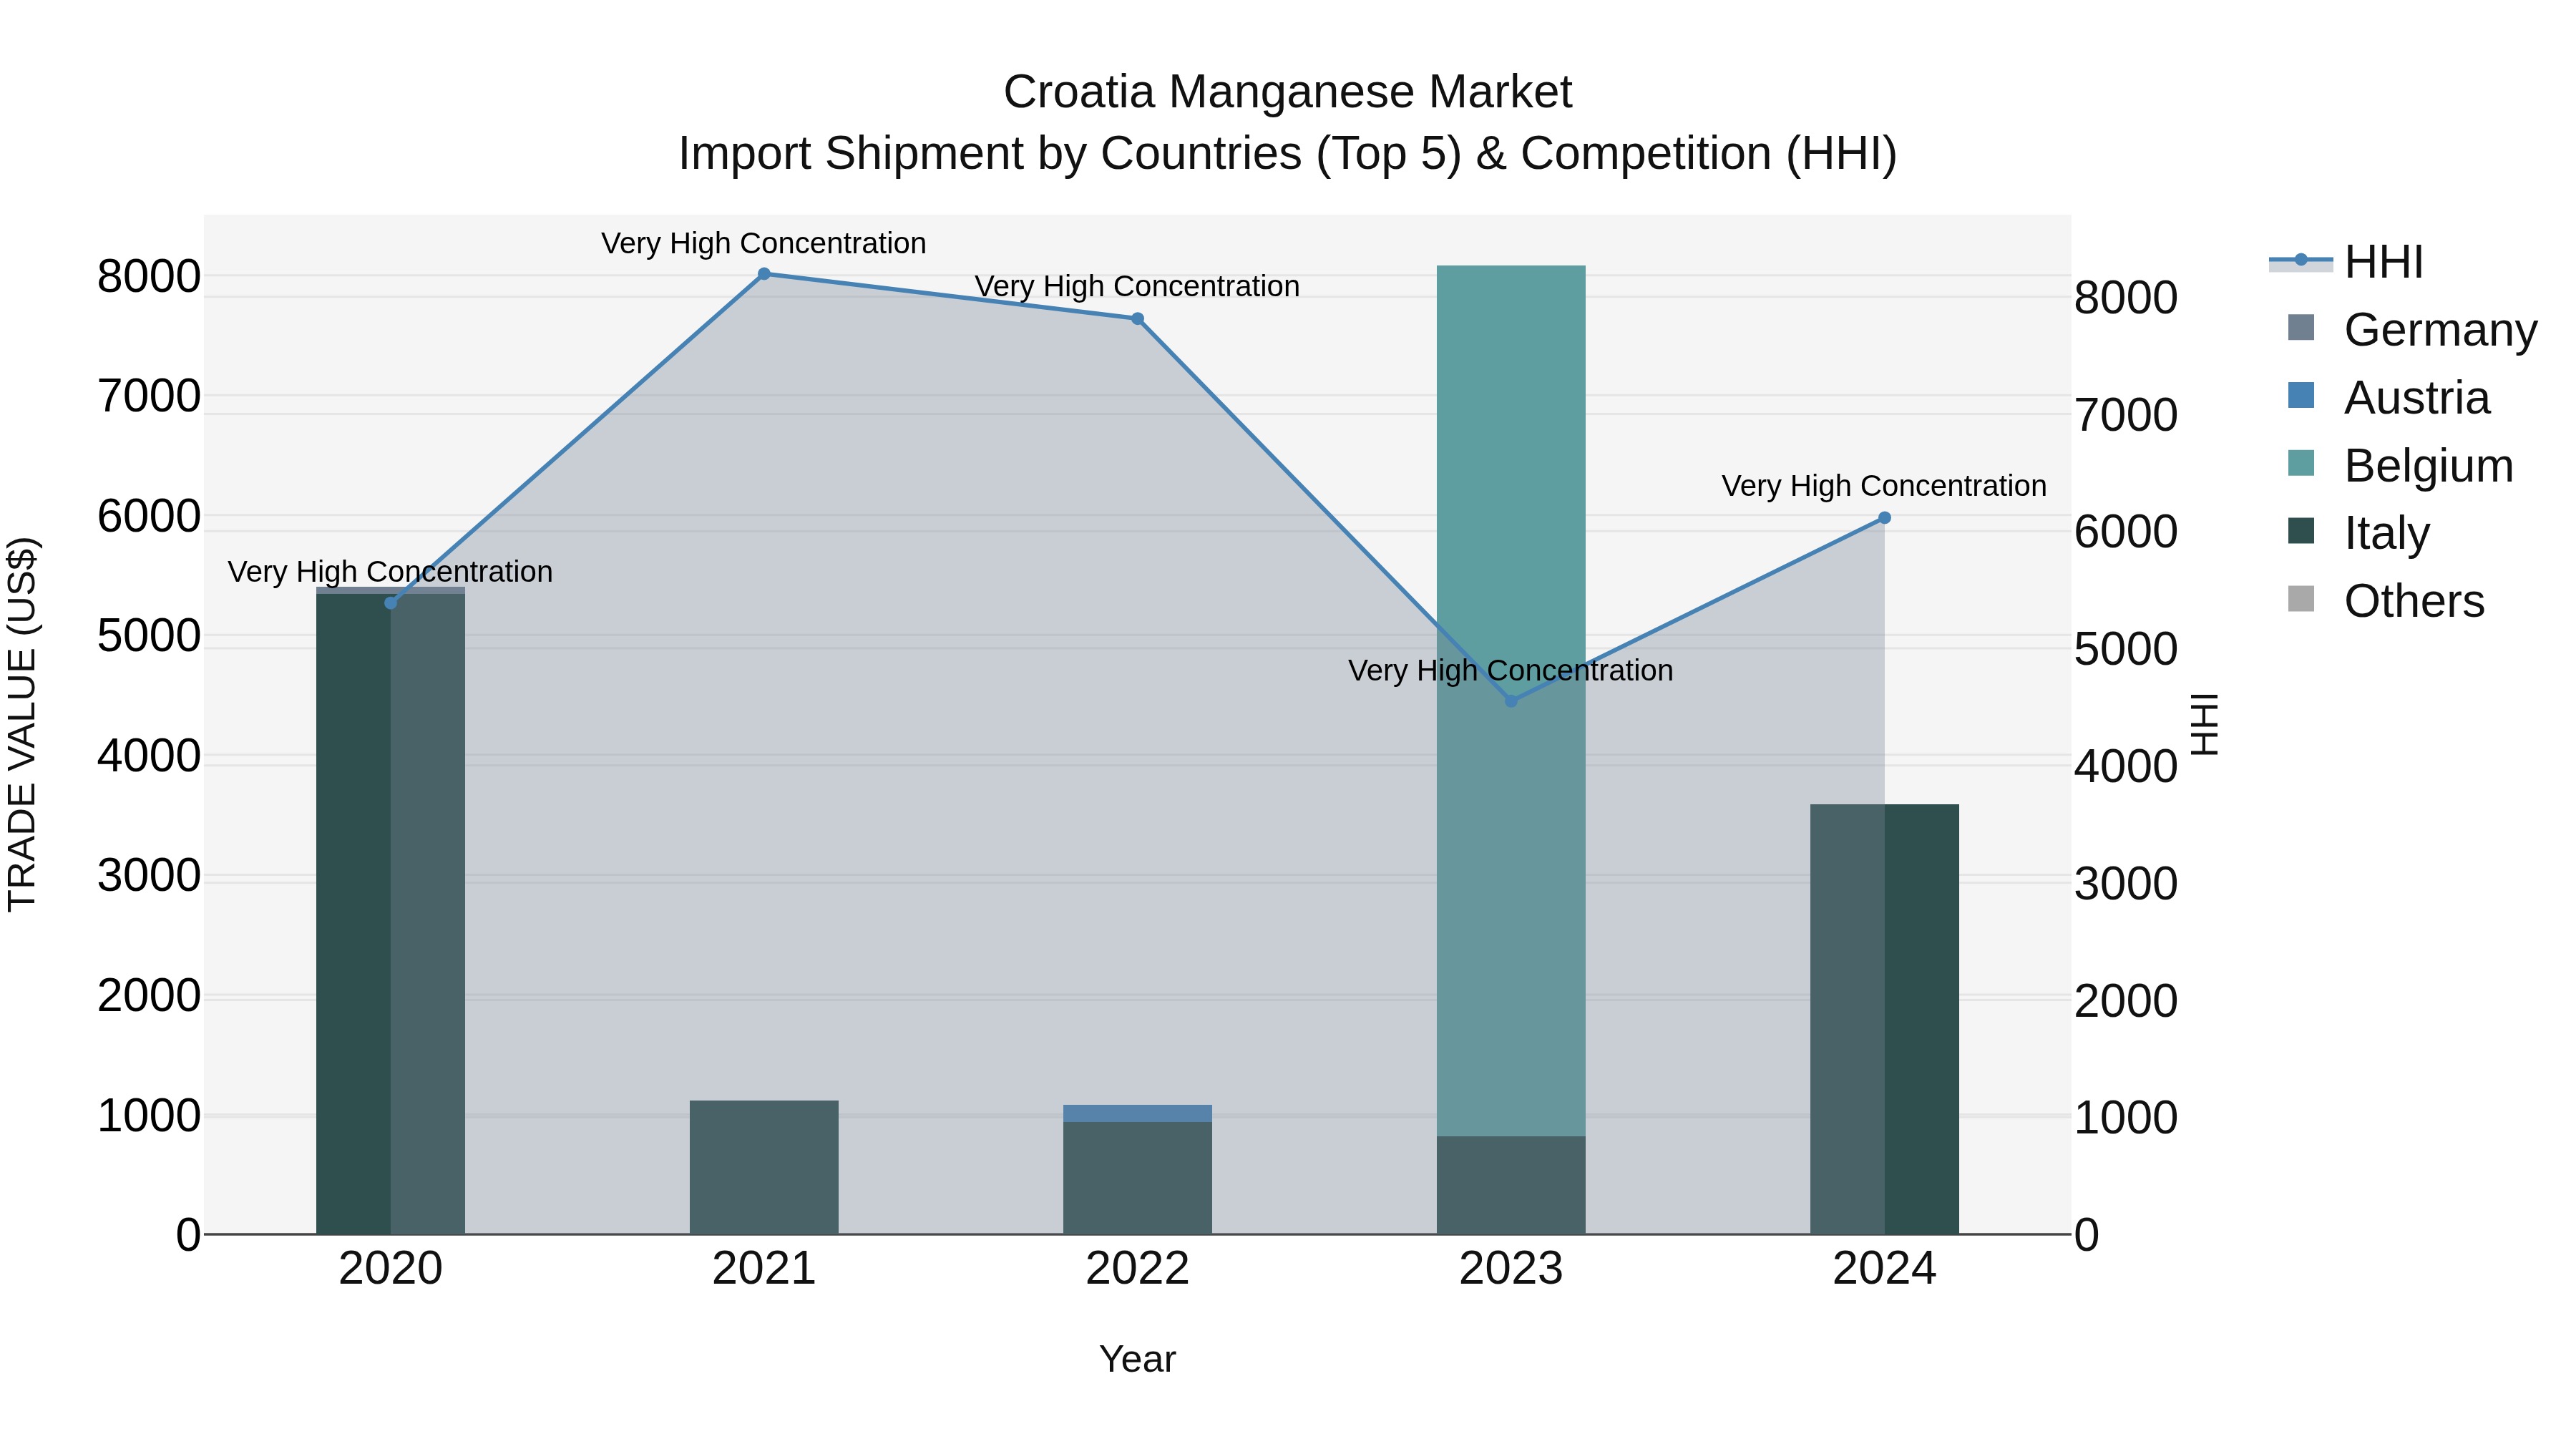
Croatia Manganese Market Top 5 Importing Countries and Market Competition (HHI) Analysis
Croatia manganese import market in 2024 continued to be dominated by top exporters Italy, Austria, Belgium, and Germany, showcasing a high concentration with a consistently high Herfindahl-Hirschman Index (HHI). The market experienced a significant decline with a Compound Annual Growth Rate (CAGR) of -9.74% from 2020 to 2024. The growth rate from 2023 to 2024 plummeted by -55.63%, indicating challenging circumstances for the manganese import industry in Croatia. Monitoring these trends will be essential for stakeholders to navigate the evolving market landscape effectively.
Croatia Manganese Market Overview
The manganese market in Croatia is driven by its essential role in steel production and other industrial applications. Manganese is a critical alloying element that improves the strength and toughness of steel, supporting the country`s construction and manufacturing sectors, as well as its export market.
Drivers of the market
The manganese market in Croatia is influenced by the demand for manganese in various applications, including steel production, batteries, and alloys. Manganese is a critical component in steelmaking, where it improves strength and durability. The growth of the automotive and construction industries, along with advancements in battery technology and renewable energy storage, are significant drivers of market growth. Additionally, the increasing focus on efficient and sustainable resource use is supporting market expansion.
Challenges of the market
The manganese market in Croatia faces challenges such as fluctuations in raw material prices and the need for efficient production processes. Ensuring consistent quality and meeting regulatory standards are crucial. The market contends with competition from international suppliers and must address supply chain issues. Additionally, managing environmental impacts and exploring new applications for manganese are key considerations.
Government Policy of the market
The Croatian government promotes the manganese market by supporting sustainable mining practices and research into new applications for manganese. Policies include funding for innovation in manganese processing and incentives for industries utilizing manganese to enhance product performance and environmental safety.
Key Highlights of the Report:
- Croatia Manganese Market Outlook
- Market Size of Croatia Manganese Market, 2024
- Forecast of Croatia Manganese Market, 2031
- Historical Data and Forecast of Croatia Manganese Revenues & Volume for the Period 2021-2031
- Croatia Manganese Market Trend Evolution
- Croatia Manganese Market Drivers and Challenges
- Croatia Manganese Price Trends
- Croatia Manganese Porter`s Five Forces
- Croatia Manganese Industry Life Cycle
- Historical Data and Forecast of Croatia Manganese Market Revenues & Volume By Application for the Period 2021-2031
- Historical Data and Forecast of Croatia Manganese Market Revenues & Volume By Alloys for the Period 2021-2031
- Historical Data and Forecast of Croatia Manganese Market Revenues & Volume By Others for the Period 2021-2031
- Historical Data and Forecast of Croatia Manganese Market Revenues & Volume By Metallurgical Application for the Period 2021-2031
- Historical Data and Forecast of Croatia Manganese Market Revenues & Volume By High-Carbon Ferromanganese for the Period 2021-2031
- Historical Data and Forecast of Croatia Manganese Market Revenues & Volume By Refined Ferromanganese for the Period 2021-2031
- Historical Data and Forecast of Croatia Manganese Market Revenues & Volume By Silico manganese for the Period 2021-2031
- Historical Data and Forecast of Croatia Manganese Market Revenues & Volume By Others for the Period 2021-2031
- Historical Data and Forecast of Croatia Manganese Market Revenues & Volume By End-User Industry for the Period 2021-2031
- Historical Data and Forecast of Croatia Manganese Market Revenues & Volume By Steel for the Period 2021-2031
- Historical Data and Forecast of Croatia Manganese Market Revenues & Volume By Batteries for the Period 2021-2031
- Historical Data and Forecast of Croatia Manganese Market Revenues & Volume By Others for the Period 2021-2031
- Croatia Manganese Import Export Trade Statistics
- Market Opportunity Assessment By Application
- Market Opportunity Assessment By Metallurgical Application
- Market Opportunity Assessment By End-User Industry
- Croatia Manganese Top Companies Market Share
- Croatia Manganese Competitive Benchmarking By Technical and Operational Parameters
- Croatia Manganese Company Profiles
- Croatia Manganese Key Strategic Recommendations
Frequently Asked Questions About the Market Study (FAQs):
6Wresearch actively monitors the Croatia Manganese Market and publishes its comprehensive annual report, highlighting emerging trends, growth drivers, revenue analysis, and forecast outlook. Our insights help businesses to make data-backed strategic decisions with ongoing market dynamics. Our analysts track relevent industries related to the Croatia Manganese Market, allowing our clients with actionable intelligence and reliable forecasts tailored to emerging regional needs.
Yes, we provide customisation as per your requirements. To learn more, feel free to contact us on sales@6wresearch.com
1 Executive Summary |
2 Introduction |
2.1 Key Highlights of the Report |
2.2 Report Description |
2.3 Market Scope & Segmentation |
2.4 Research Methodology |
2.5 Assumptions |
3 Croatia Manganese Market Overview |
3.1 Croatia Country Macro Economic Indicators |
3.2 Croatia Manganese Market Revenues & Volume, 2021 & 2031F |
3.3 Croatia Manganese Market - Industry Life Cycle |
3.4 Croatia Manganese Market - Porter's Five Forces |
3.5 Croatia Manganese Market Revenues & Volume Share, By Application, 2021 & 2031F |
3.6 Croatia Manganese Market Revenues & Volume Share, By Metallurgical Application, 2021 & 2031F |
3.7 Croatia Manganese Market Revenues & Volume Share, By End-User Industry, 2021 & 2031F |
4 Croatia Manganese Market Dynamics |
4.1 Impact Analysis |
4.2 Market Drivers |
4.2.1 Increasing demand for steel production, as manganese is a key element in steelmaking. |
4.2.2 Growth in infrastructure development projects driving the demand for manganese-containing construction materials. |
4.2.3 Technological advancements leading to the development of new manganese-based products. |
4.3 Market Restraints |
4.3.1 Fluctuating global manganese ore prices impacting the profitability of the market. |
4.3.2 Environmental regulations and sustainability concerns affecting mining and processing operations. |
4.3.3 Competition from substitute materials impacting the demand for manganese products. |
5 Croatia Manganese Market Trends |
6 Croatia Manganese Market Segmentations |
6.1 Croatia Manganese Market, By Application |
6.1.1 Overview and Analysis |
6.1.2 Croatia Manganese Market Revenues & Volume, By Alloys, 2021-2031F |
6.1.3 Croatia Manganese Market Revenues & Volume, By Others, 2021-2031F |
6.2 Croatia Manganese Market, By Metallurgical Application |
6.2.1 Overview and Analysis |
6.2.2 Croatia Manganese Market Revenues & Volume, By High-Carbon Ferromanganese, 2021-2031F |
6.2.3 Croatia Manganese Market Revenues & Volume, By Refined Ferromanganese, 2021-2031F |
6.2.4 Croatia Manganese Market Revenues & Volume, By Silico manganese, 2021-2031F |
6.2.5 Croatia Manganese Market Revenues & Volume, By Others, 2021-2031F |
6.3 Croatia Manganese Market, By End-User Industry |
6.3.1 Overview and Analysis |
6.3.2 Croatia Manganese Market Revenues & Volume, By Steel, 2021-2031F |
6.3.3 Croatia Manganese Market Revenues & Volume, By Batteries, 2021-2031F |
6.3.4 Croatia Manganese Market Revenues & Volume, By Others, 2021-2031F |
7 Croatia Manganese Market Import-Export Trade Statistics |
7.1 Croatia Manganese Market Export to Major Countries |
7.2 Croatia Manganese Market Imports from Major Countries |
8 Croatia Manganese Market Key Performance Indicators |
8.1 Average selling price of manganese ore in Croatia. |
8.2 Percentage of infrastructure projects using manganese-containing materials. |
8.3 Research and development investment in new manganese-based products. |
8.4 Environmental compliance metrics for mining and processing operations. |
8.5 Adoption rate of manganese recycling initiatives in the market. |
9 Croatia Manganese Market - Opportunity Assessment |
9.1 Croatia Manganese Market Opportunity Assessment, By Application, 2021 & 2031F |
9.2 Croatia Manganese Market Opportunity Assessment, By Metallurgical Application, 2021 & 2031F |
9.3 Croatia Manganese Market Opportunity Assessment, By End-User Industry, 2021 & 2031F |
10 Croatia Manganese Market - Competitive Landscape |
10.1 Croatia Manganese Market Revenue Share, By Companies, 2024 |
10.2 Croatia Manganese Market Competitive Benchmarking, By Operating and Technical Parameters |
11 Company Profiles |
12 Recommendations | 13 Disclaimer |
Global Go To Market Strategy - 2030
Export potential enables firms to identify high-growth global markets with greater confidence by combining advanced trade intelligence with a structured quantitative methodology. The framework analyzes emerging demand trends and country-level import patterns while integrating macroeconomic and trade datasets such as GDP and population forecasts, bilateral import–export flows, tariff structures, elasticity differentials between developed and developing economies, geographic distance, and import demand projections. Using weighted trade values from 2020–2024 as the base period to project country-to-country export potential for 2030, these inputs are operationalized through calculated drivers such as gravity model parameters, tariff impact factors, and projected GDP per-capita growth. Through an analysis of hidden potentials, demand hotspots, and market conditions that are most favorable to success, this method enables firms to focus on target countries, maximize returns, and global expansion with data, backed by accuracy.
By factoring in the projected importer demand gap that is currently unmet and could be potential opportunity, it identifies the potential for the Exporter (Country) among 190 countries, against the general trade analysis, which identifies the biggest importer or exporter.
To discover high-growth global markets and optimize your business strategy:
Click Here
Pricing
- Single User License$ 1,995
- Department License$ 2,400
- Site License$ 3,120
- Global License$ 3,795

Leadership Perspectives from Industry Events
Search
Thought Leadership and Analyst Meet


Our Clients
6WResearch In News
- India Export Attractiveness Tracker 2026
- India Air Conditioner Market Set for Strong Rebound in 2026 After Weather-Led Correction and GST-Driven Recovery: 6Wresearch
- ADAS in India: How Automatic Emergency Braking, Blind Spot Detection & Driver Monitoring are Transforming Road Safety
- Doha a strategic location for EV manufacturing hub: IPA Qatar
- Demand for luxury TVs surging in the GCC, says Samsung
- Empowering Growth: The Thriving Journey of Bangladesh’s Cable Industry
Latest Reports
- Nicaragua RPG Gaming Market (2026-2032)
- New Zealand RPG Gaming Market (2026-2032)
- Netherlands RPG Gaming Market (2026-2032)
- Nauru RPG Gaming Market (2026-2032)
- Namibia RPG Gaming Market (2026-2032)
- Mozambique RPG Gaming Market (2026-2032)
- Montenegro RPG Gaming Market (2026-2032)
- Mongolia RPG Gaming Market (2026-2032)
- Monaco RPG Gaming Market (2026-2032)
- Micronesia RPG Gaming Market (2026-2032)
Industry Events and Analyst Meet

EV India Expo 2026

HIMTEX 2026

India Refining Summit 2026

India EV Show 2026

EV tech India Expo 2026
Whitepaper
- Middle East & Africa Commercial Security Market Click here to view more.
- Middle East & Africa Fire Safety Systems & Equipment Market Click here to view more.
- GCC Drone Market Click here to view more.
- Middle East Lighting Fixture Market Click here to view more.
- GCC Physical & Perimeter Security Market Click here to view more.