Croatia Orange Marmalade Market (2026-2032) | Share, Companies, Outlook, Trends, Growth, Size, Segmentation, Forecast, Revenue, Industry, Value & Analysis
Market Forecast By Type (Bitter Orange Marmalade, Sweet Orange Marmalade), By Applications (Supermarkets, Convenience Store, Online Store, Others) And Competitive Landscape
| Product Code: ETC5018777 | Publication Date: Nov 2023 | Updated Date: Apr 2026 | Product Type: Market Research Report | |
| Publisher: 6Wresearch | Author: Shubham Padhi | No. of Pages: 60 | No. of Figures: 30 | No. of Tables: 5 |
Croatia Orange Marmalade Market Size (2020-2030)
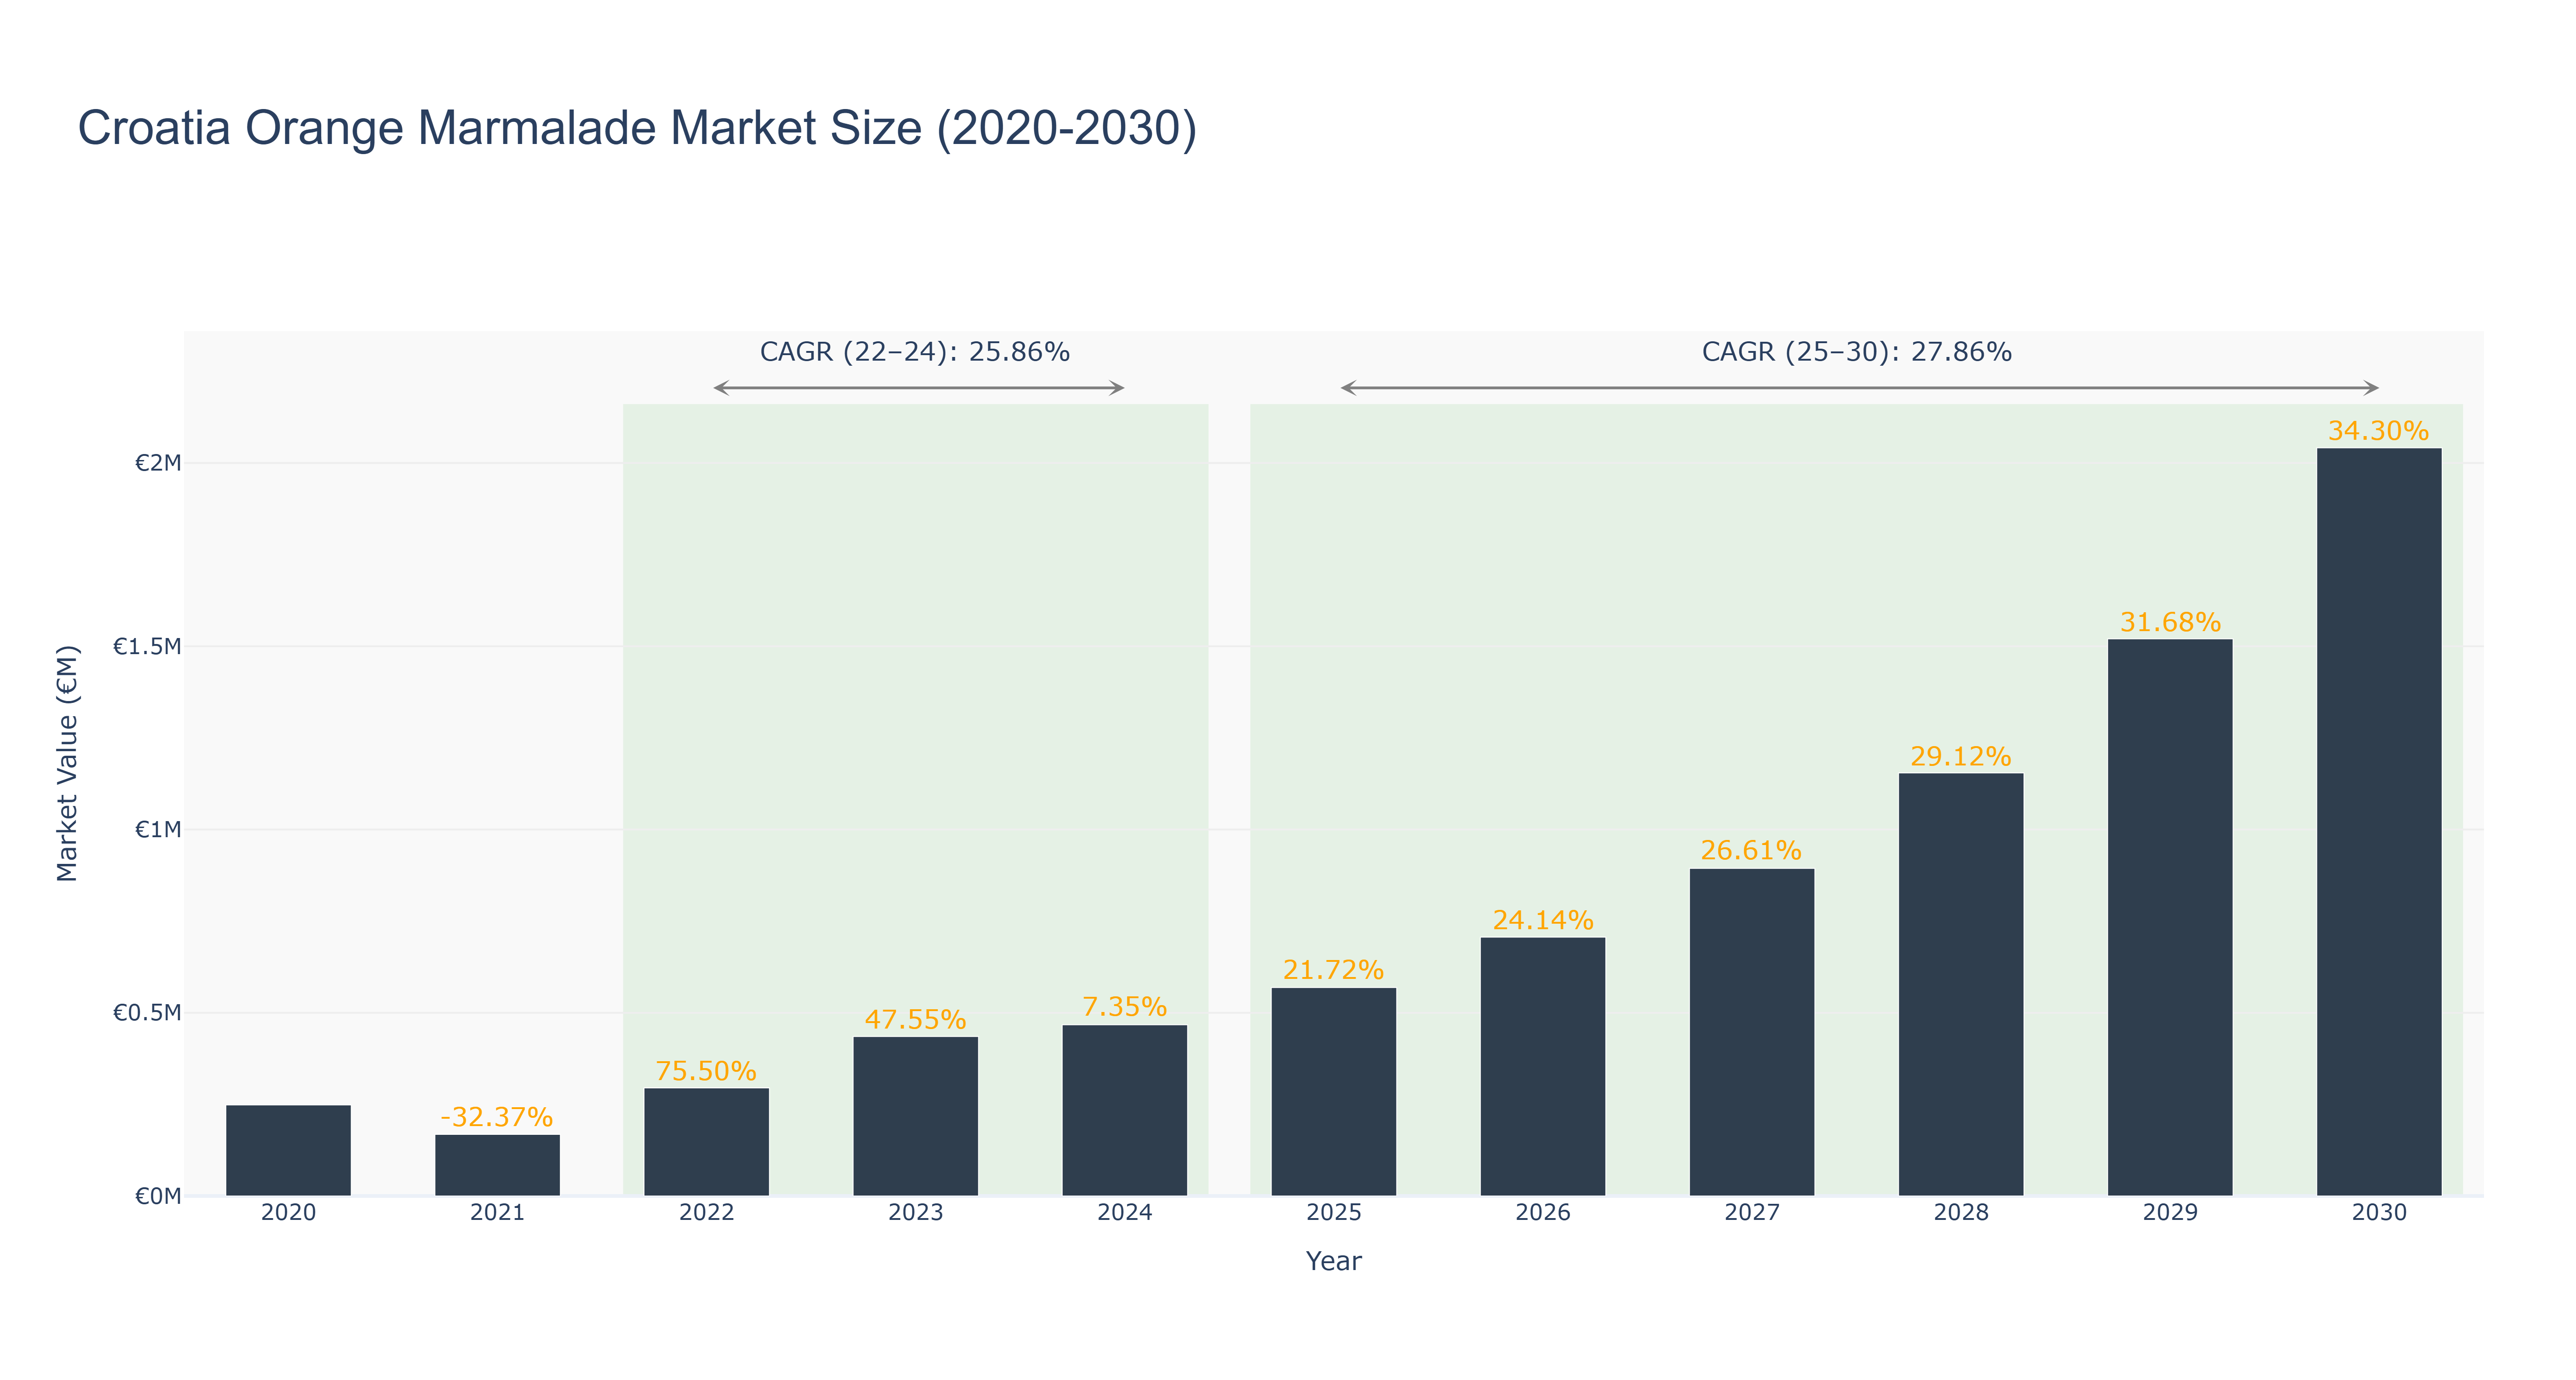
The Croatia Orange Marmalade Market has demonstrated significant volatility in recent years, with its peak market size of €435.31 thousand recorded in 2023, following substantial growth of 47.55% from 2022. The market experienced a notable decline in 2021, attributed to shifts in consumer preferences and supply chain disruptions, but rebounded strongly in 2022 with a growth of 75.50%. As we look ahead to the forecasted period from 2025 to 2030, the market is projected to grow at a compound annual growth rate (CAGR) of 27.86%, reaching €2.04 million by 2030. Key drivers for this growth include increasing health consciousness among consumers and rising demand for organic products. With ongoing innovations in product formulations and potential expansions in distribution networks, the Croatia Orange Marmalade Market is poised for continued expansion, reflecting broader trends in the food sector aimed at enhancing consumer engagement and product variety.
Croatia Orange Marmalade Market: Production & Trade Performance (2019-2025)
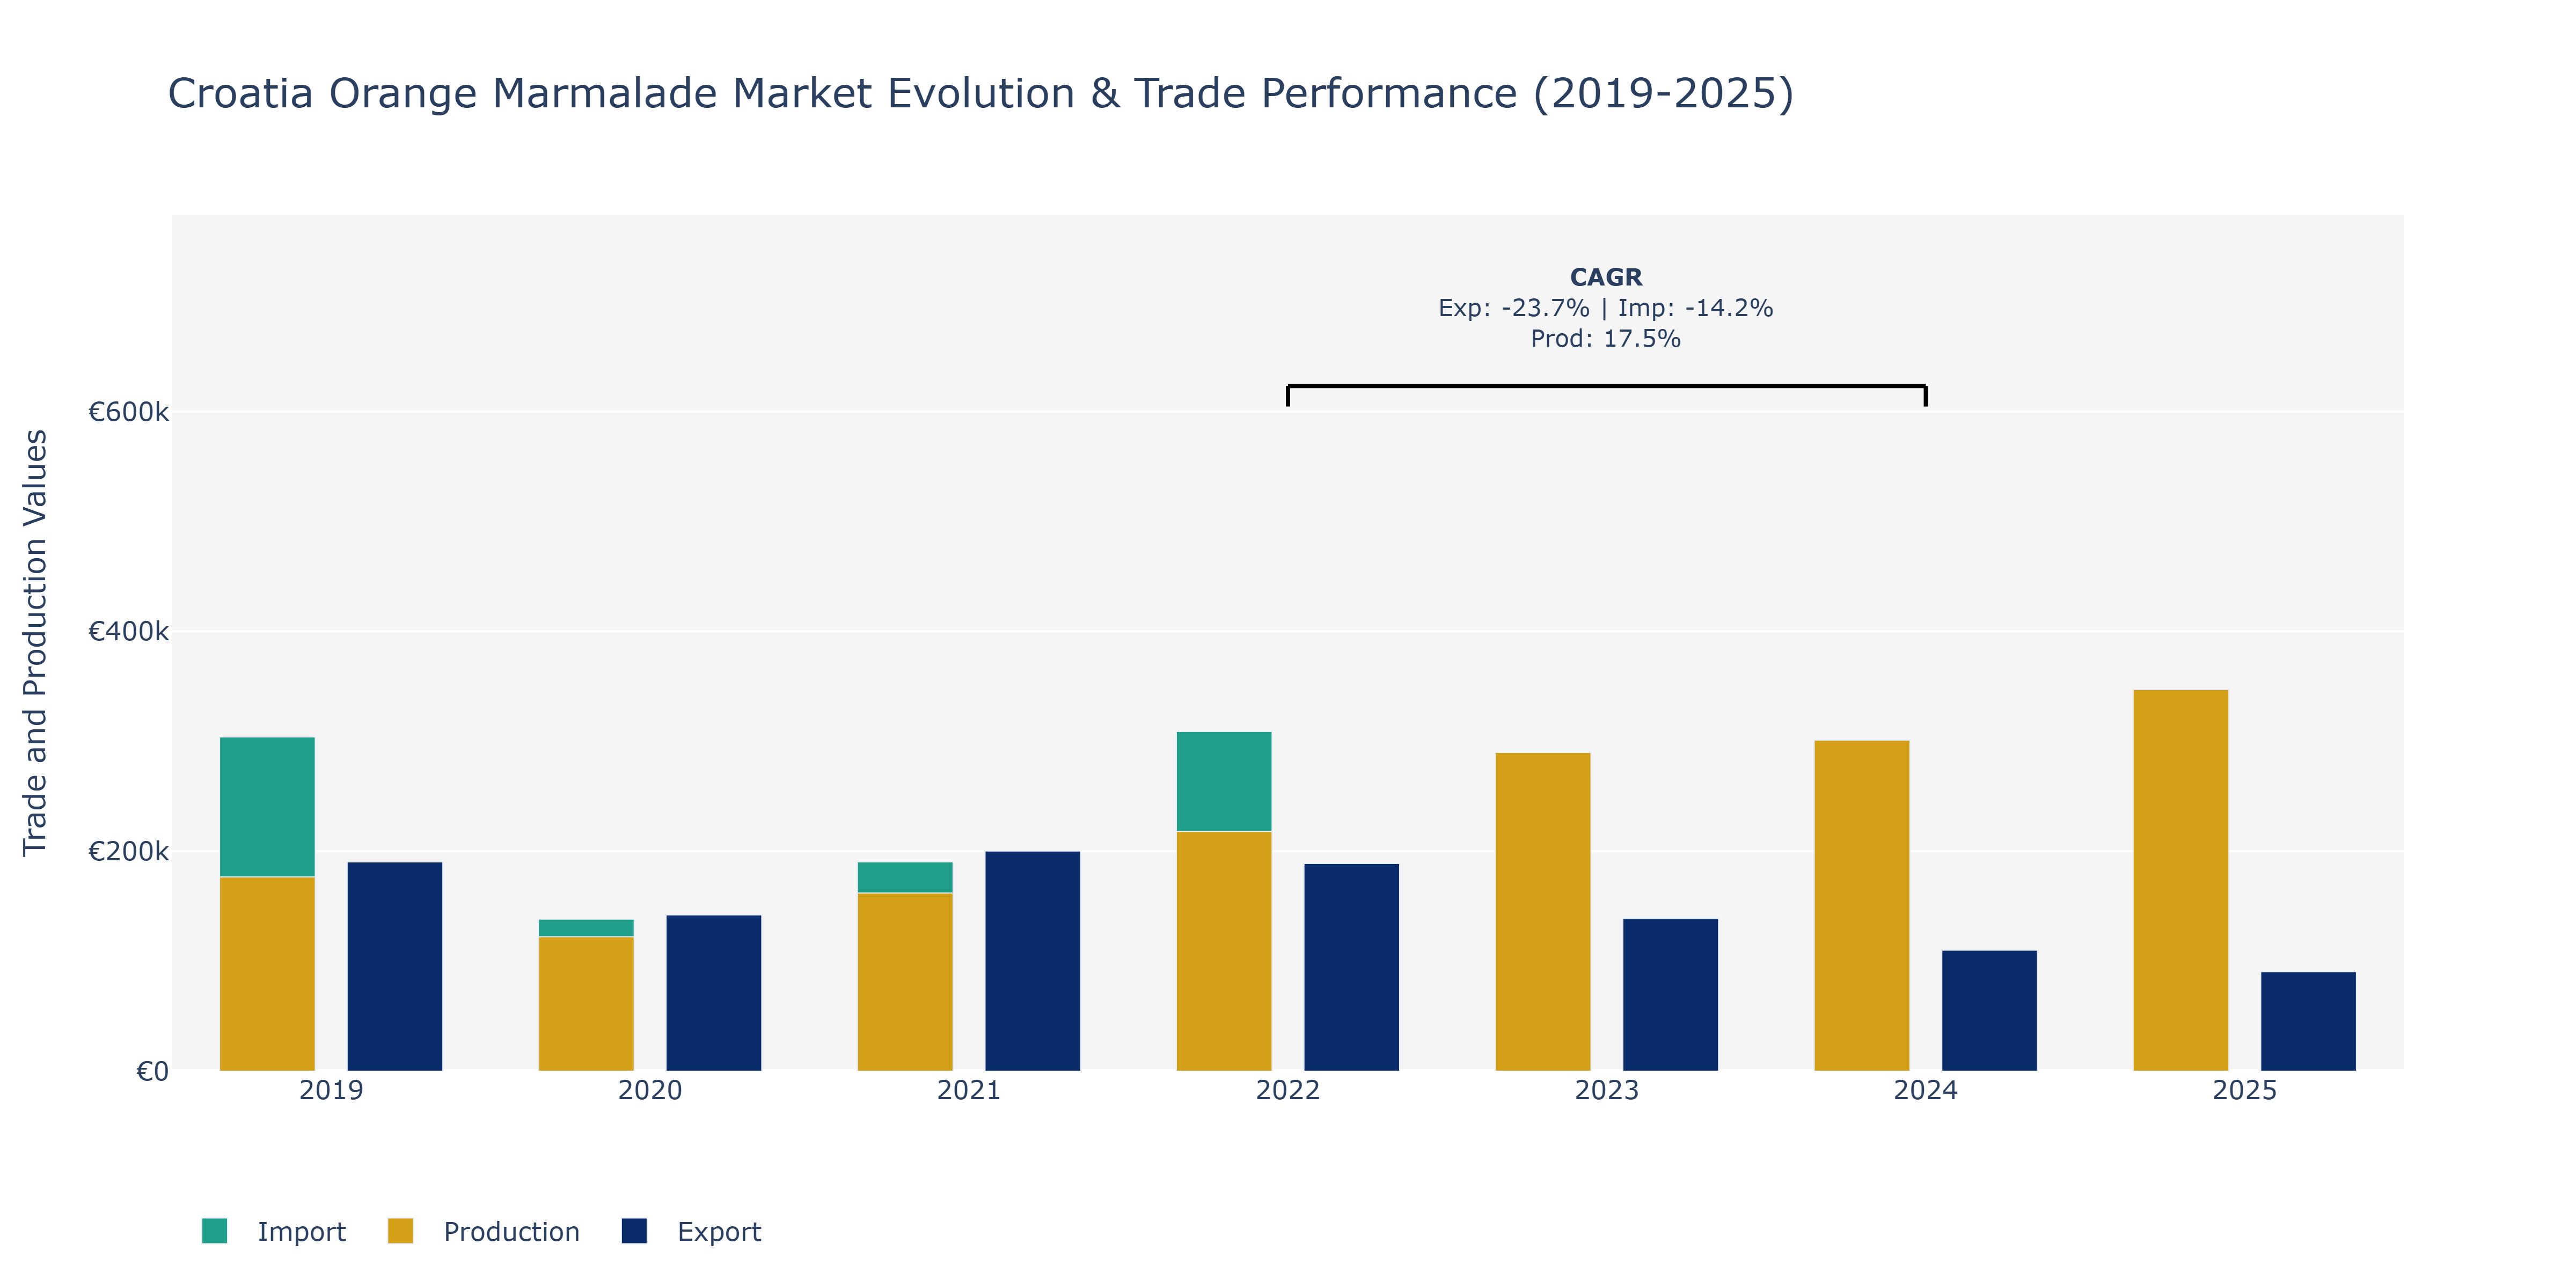
In the Croatia Orange Marmalade Market, exports experienced fluctuations over the years, starting at €190.33 thousand in 2019, declining to €90.48 thousand in 2025. This downward trend could be attributed to changes in consumer preferences towards healthier alternatives, such as fruit spreads with reduced sugar content, impacting traditional orange marmalade demand. Conversely, imports showed a more stable pattern, with values ranging from €138.31 thousand in 2020 to €204.97 thousand in 2025. This consistency might be influenced by ongoing supply agreements with international marmalade producers or fluctuations in domestic orange production affecting the need for imports. Production value surged from €176.70 thousand in 2019 to €347.12 thousand in 2025, reflecting a notable 17.5% compound annual growth rate from 2022 to 2024. This growth could be linked to increased investments in modern production facilities, improved harvesting techniques, and enhanced distribution networks aimed at meeting rising domestic and export demands for high-quality orange marmalade.
Key Highlights of the Report:
- Croatia Orange Marmalade Market Outlook
- Market Size of Croatia Orange Marmalade Market, 2025
- Forecast of Croatia Orange Marmalade Market, 2032
- Historical Data and Forecast of Croatia Orange Marmalade Revenues & Volume for the Period 2022 - 2032F
- Croatia Orange Marmalade Market Trend Evolution
- Croatia Orange Marmalade Market Drivers and Challenges
- Croatia Orange Marmalade Price Trends
- Croatia Orange Marmalade Porter`s Five Forces
- Croatia Orange Marmalade Industry Life Cycle
- Historical Data and Forecast of Croatia Orange Marmalade Market Revenues & Volume By Type for the Period 2022 - 2032F
- Historical Data and Forecast of Croatia Orange Marmalade Market Revenues & Volume By Bitter Orange Marmalade for the Period 2022 - 2032F
- Historical Data and Forecast of Croatia Orange Marmalade Market Revenues & Volume By Sweet Orange Marmalade for the Period 2022 - 2032F
- Historical Data and Forecast of Croatia Orange Marmalade Market Revenues & Volume By Applications for the Period 2022 - 2032F
- Historical Data and Forecast of Croatia Orange Marmalade Market Revenues & Volume By Supermarkets for the Period 2022 - 2032F
- Historical Data and Forecast of Croatia Orange Marmalade Market Revenues & Volume By Convenience Store for the Period 2022 - 2032F
- Historical Data and Forecast of Croatia Orange Marmalade Market Revenues & Volume By Online Store for the Period 2022 - 2032F
- Historical Data and Forecast of Croatia Orange Marmalade Market Revenues & Volume By Others for the Period 2022 - 2032F
- Croatia Orange Marmalade Import Export Trade Statistics
- Market Opportunity Assessment By Type
- Market Opportunity Assessment By Applications
- Croatia Orange Marmalade Top Companies Market Share
- Croatia Orange Marmalade Competitive Benchmarking By Technical and Operational Parameters
- Croatia Orange Marmalade Company Profiles
- Croatia Orange Marmalade Key Strategic Recommendations
Frequently Asked Questions About the Market Study (FAQs):
6Wresearch actively monitors the Croatia Orange Marmalade Market and publishes its comprehensive annual report, highlighting emerging trends, growth drivers, revenue analysis, and forecast outlook. Our insights help businesses to make data-backed strategic decisions with ongoing market dynamics. Our analysts track relevent industries related to the Croatia Orange Marmalade Market, allowing our clients with actionable intelligence and reliable forecasts tailored to emerging regional needs.
Yes, we provide customisation as per your requirements. To learn more, feel free to contact us on sales@6wresearch.com
1 Executive Summary |
2 Introduction |
2.1 Key Highlights of the Report |
2.2 Report Description |
2.3 Market Scope & Segmentation |
2.4 Research Methodology |
2.5 Assumptions |
3 Croatia Orange Marmalade Market Overview |
3.1 Croatia Country Macro Economic Indicators |
3.2 Croatia Orange Marmalade Market Revenues & Volume, 2022 & 2032F |
3.3 Croatia Orange Marmalade Market - Industry Life Cycle |
3.4 Croatia Orange Marmalade Market - Porter's Five Forces |
3.5 Croatia Orange Marmalade Market Revenues & Volume Share, By Type, 2022 & 2032F |
3.6 Croatia Orange Marmalade Market Revenues & Volume Share, By Applications, 2022 & 2032F |
4 Croatia Orange Marmalade Market Dynamics |
4.1 Impact Analysis |
4.2 Market Drivers |
4.2.1 Growing consumer demand for healthier breakfast options |
4.2.2 Increasing awareness about the health benefits of orange marmalade |
4.2.3 Rising popularity of orange-flavored products in the food industry |
4.3 Market Restraints |
4.3.1 Fluctuating prices of raw materials such as oranges and sugar |
4.3.2 Competition from other fruit preserves and spreads in the market |
5 Croatia Orange Marmalade Market Trends |
6 Croatia Orange Marmalade Market Segmentations |
6.1 Croatia Orange Marmalade Market, By Type |
6.1.1 Overview and Analysis |
6.1.2 Croatia Orange Marmalade Market Revenues & Volume, By Bitter Orange Marmalade, 2022 - 2032F |
6.1.3 Croatia Orange Marmalade Market Revenues & Volume, By Sweet Orange Marmalade, 2022 - 2032F |
6.2 Croatia Orange Marmalade Market, By Applications |
6.2.1 Overview and Analysis |
6.2.2 Croatia Orange Marmalade Market Revenues & Volume, By Supermarkets, 2022 - 2032F |
6.2.3 Croatia Orange Marmalade Market Revenues & Volume, By Convenience Store, 2022 - 2032F |
6.2.4 Croatia Orange Marmalade Market Revenues & Volume, By Online Store, 2022 - 2032F |
6.2.5 Croatia Orange Marmalade Market Revenues & Volume, By Others, 2022 - 2032F |
7 Croatia Orange Marmalade Market Import-Export Trade Statistics |
7.1 Croatia Orange Marmalade Market Export to Major Countries |
7.2 Croatia Orange Marmalade Market Imports from Major Countries |
8 Croatia Orange Marmalade Market Key Performance Indicators |
8.1 Consumer engagement on social media platforms (likes, shares, comments) |
8.2 Number of new product launches and innovations in the orange marmalade market |
8.3 Customer satisfaction ratings and feedback on product quality and taste. |
9 Croatia Orange Marmalade Market - Opportunity Assessment |
9.1 Croatia Orange Marmalade Market Opportunity Assessment, By Type, 2022 & 2032F |
9.2 Croatia Orange Marmalade Market Opportunity Assessment, By Applications, 2022 & 2032F |
10 Croatia Orange Marmalade Market - Competitive Landscape |
10.1 Croatia Orange Marmalade Market Revenue Share, By Companies, 2025 |
10.2 Croatia Orange Marmalade Market Competitive Benchmarking, By Operating and Technical Parameters |
11 Company Profiles |
12 Recommendations | 13 Disclaimer |
Global Go To Market Strategy - 2030
Export potential enables firms to identify high-growth global markets with greater confidence by combining advanced trade intelligence with a structured quantitative methodology. The framework analyzes emerging demand trends and country-level import patterns while integrating macroeconomic and trade datasets such as GDP and population forecasts, bilateral import–export flows, tariff structures, elasticity differentials between developed and developing economies, geographic distance, and import demand projections. Using weighted trade values from 2020–2024 as the base period to project country-to-country export potential for 2030, these inputs are operationalized through calculated drivers such as gravity model parameters, tariff impact factors, and projected GDP per-capita growth. Through an analysis of hidden potentials, demand hotspots, and market conditions that are most favorable to success, this method enables firms to focus on target countries, maximize returns, and global expansion with data, backed by accuracy.
By factoring in the projected importer demand gap that is currently unmet and could be potential opportunity, it identifies the potential for the Exporter (Country) among 190 countries, against the general trade analysis, which identifies the biggest importer or exporter.
To discover high-growth global markets and optimize your business strategy:
Click Here
Pricing
- Single User License$ 1,995
- Department License$ 2,400
- Site License$ 3,120
- Global License$ 3,795

Leadership Perspectives from Industry Events
Search
Thought Leadership and Analyst Meet


Our Clients
6WResearch In News
- India Export Attractiveness Tracker 2026
- India Air Conditioner Market Set for Strong Rebound in 2026 After Weather-Led Correction and GST-Driven Recovery: 6Wresearch
- ADAS in India: How Automatic Emergency Braking, Blind Spot Detection & Driver Monitoring are Transforming Road Safety
- Doha a strategic location for EV manufacturing hub: IPA Qatar
- Demand for luxury TVs surging in the GCC, says Samsung
- Empowering Growth: The Thriving Journey of Bangladesh’s Cable Industry
Latest Reports
- Nicaragua RPG Gaming Market (2026-2032)
- New Zealand RPG Gaming Market (2026-2032)
- Netherlands RPG Gaming Market (2026-2032)
- Nauru RPG Gaming Market (2026-2032)
- Namibia RPG Gaming Market (2026-2032)
- Mozambique RPG Gaming Market (2026-2032)
- Montenegro RPG Gaming Market (2026-2032)
- Mongolia RPG Gaming Market (2026-2032)
- Monaco RPG Gaming Market (2026-2032)
- Micronesia RPG Gaming Market (2026-2032)
Industry Events and Analyst Meet

EV India Expo 2026

HIMTEX 2026

India Refining Summit 2026

India EV Show 2026

EV tech India Expo 2026
Whitepaper
- Middle East & Africa Commercial Security Market Click here to view more.
- Middle East & Africa Fire Safety Systems & Equipment Market Click here to view more.
- GCC Drone Market Click here to view more.
- Middle East Lighting Fixture Market Click here to view more.
- GCC Physical & Perimeter Security Market Click here to view more.