Croatia Pen Nib Market (2026-2032) | Revenue, Analysis, Growth, Share, Size, Value, Outlook, Industry, Trends, Companies, Forecast & Segmentation
Market Forecast By Type (Stainless Nib, Gold Nib), By Application (OEM, Aftermarket) And Competitive Landscape
| Product Code: ETC5101636 | Publication Date: Nov 2023 | Updated Date: Apr 2026 | Product Type: Market Research Report | |
| Publisher: 6Wresearch | Author: Shubham Padhi | No. of Pages: 60 | No. of Figures: 30 | No. of Tables: 5 |
Croatia Pen Nib Market Size (2020-2030)
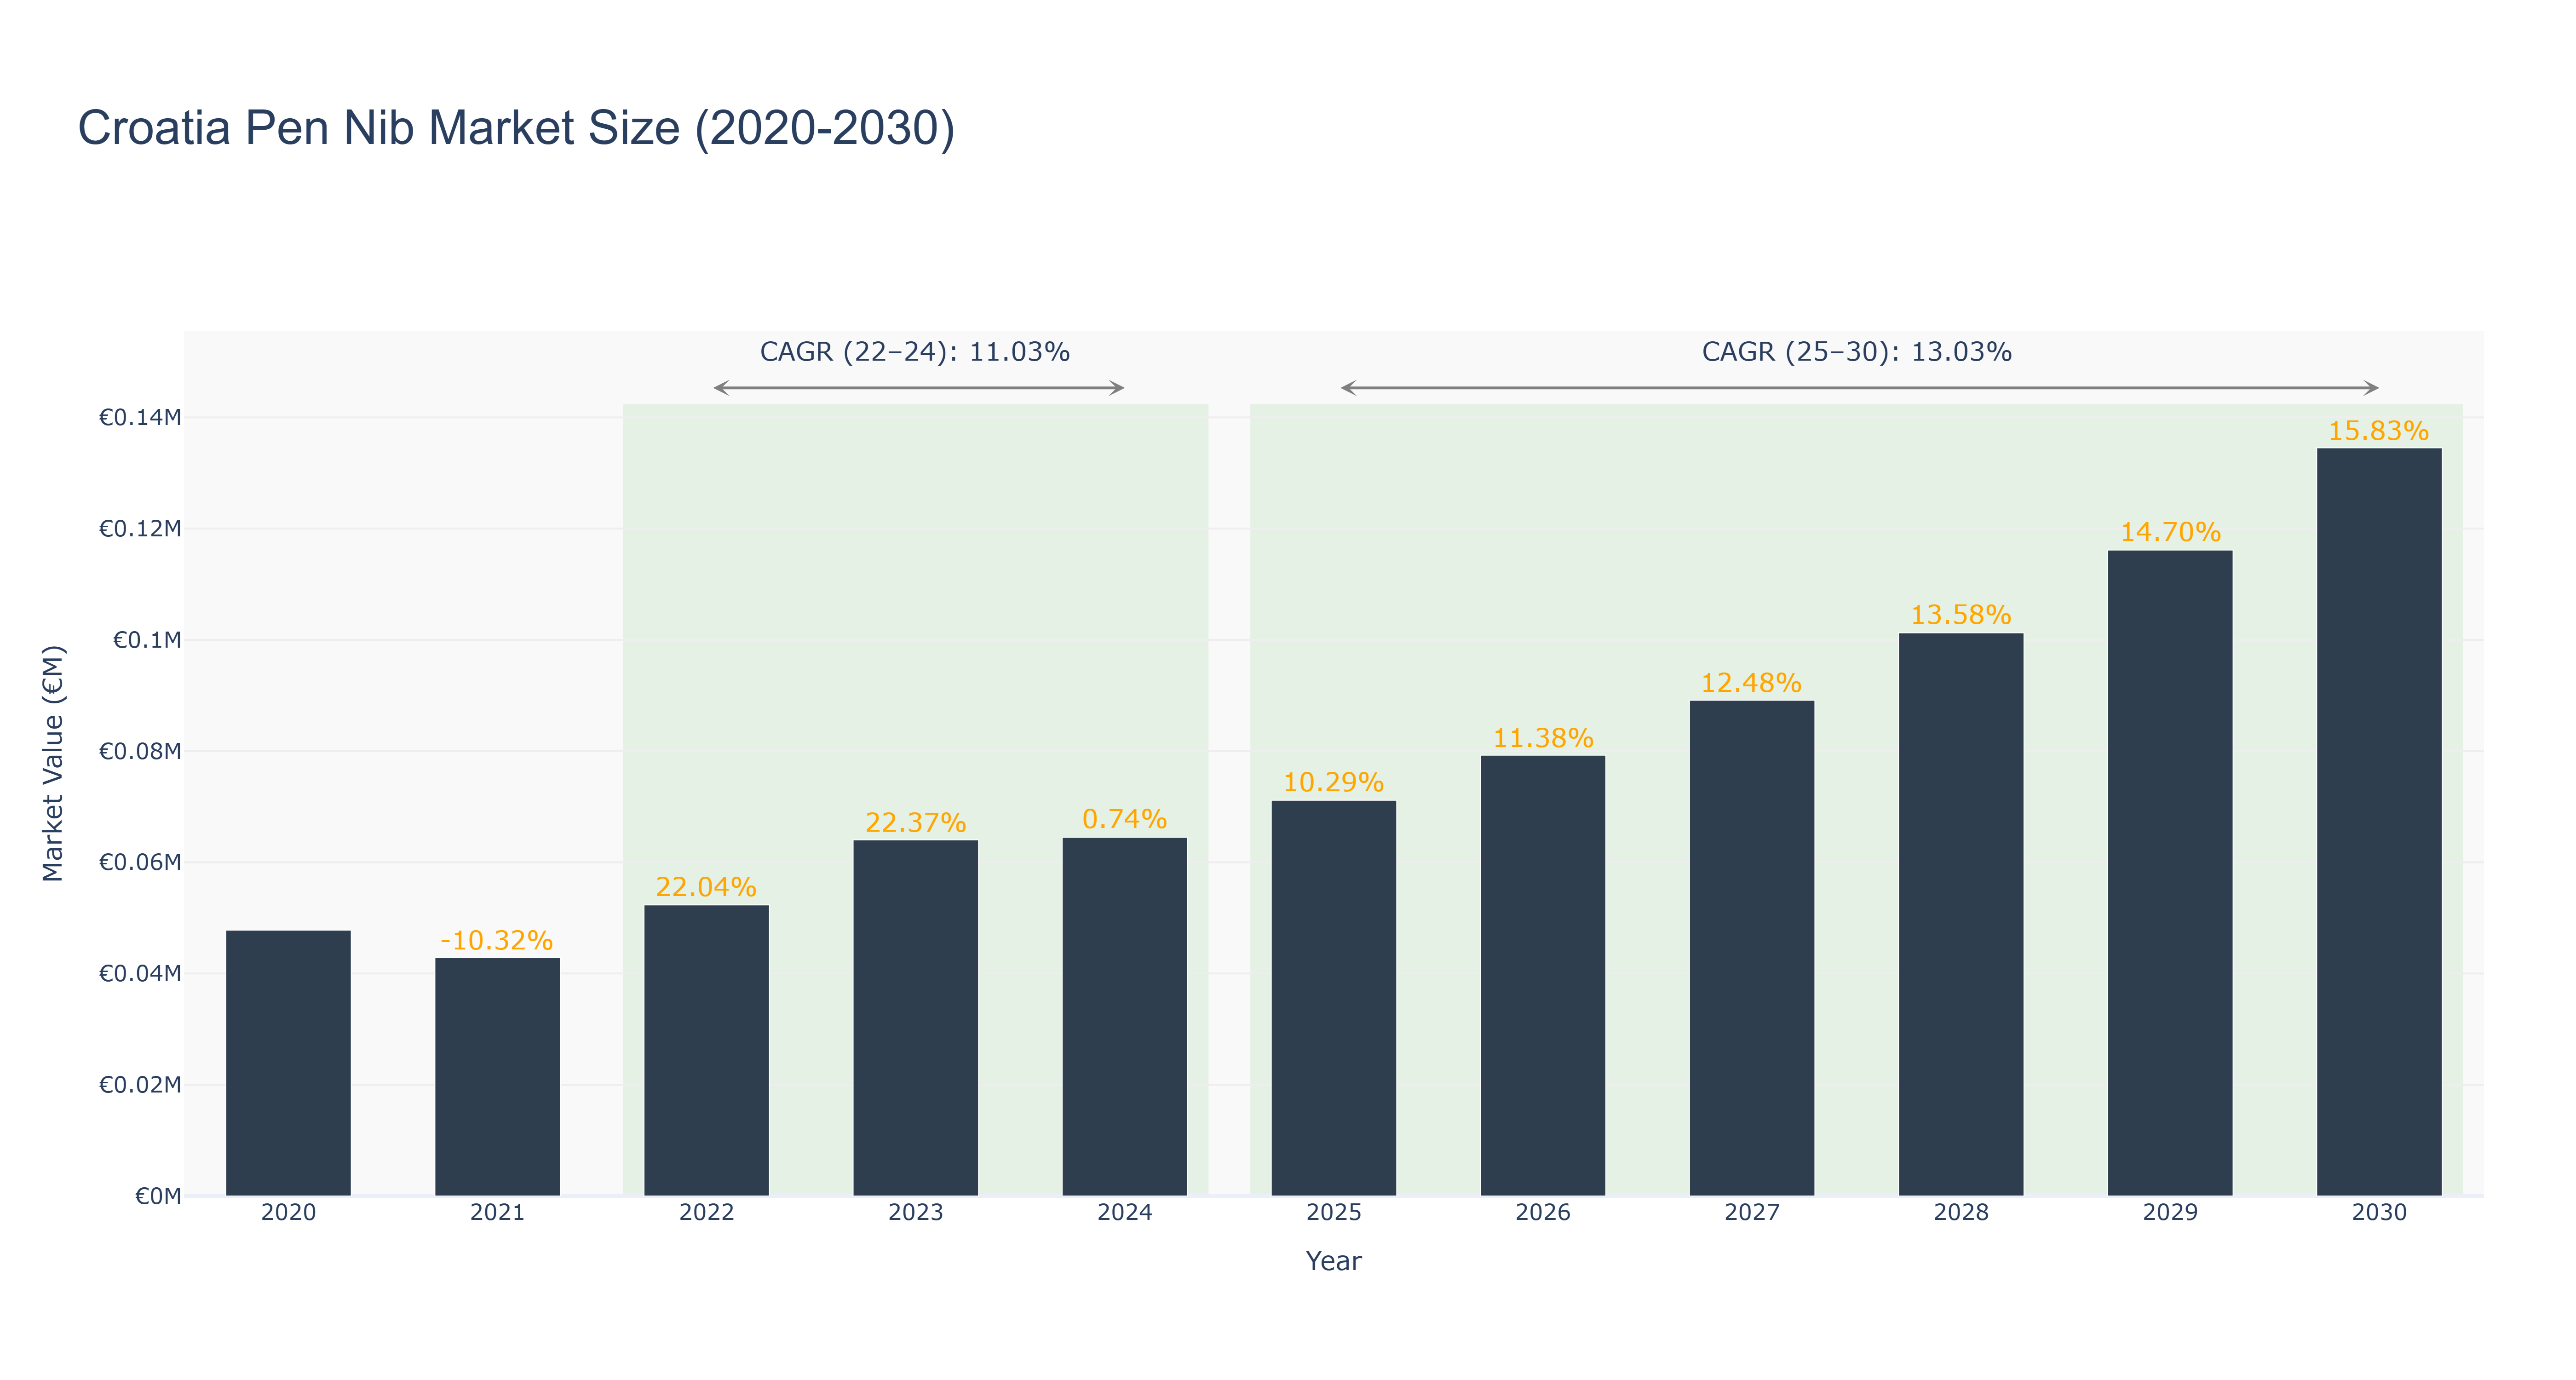
Croatia Pen Nib Market has shown a fluctuating trend over the years. The peak market size of €0.13 million is expected in 2030, with a steady growth trajectory. From 2020 to 2024, the market size varied between €0.05 million to €0.06 million, experiencing minimal growth rates. Notably, the market saw a significant increase in size from 2025 onwards, with a forecasted size of €0.13 million in 2030. The CAGR for the periods 2022-24 and 2025-30 stand at 11.03% and 13.03% respectively. Industry drivers such as technological advancements and increasing demand for premium writing instruments have contributed to this growth. Looking ahead, Croatia is set to launch a national campaign promoting locally-produced pen nibs, aiming to boost domestic manufacturing and stimulate market competitiveness.
Croatia Pen Nib Market: Production & Trade Performance (2019-2025)
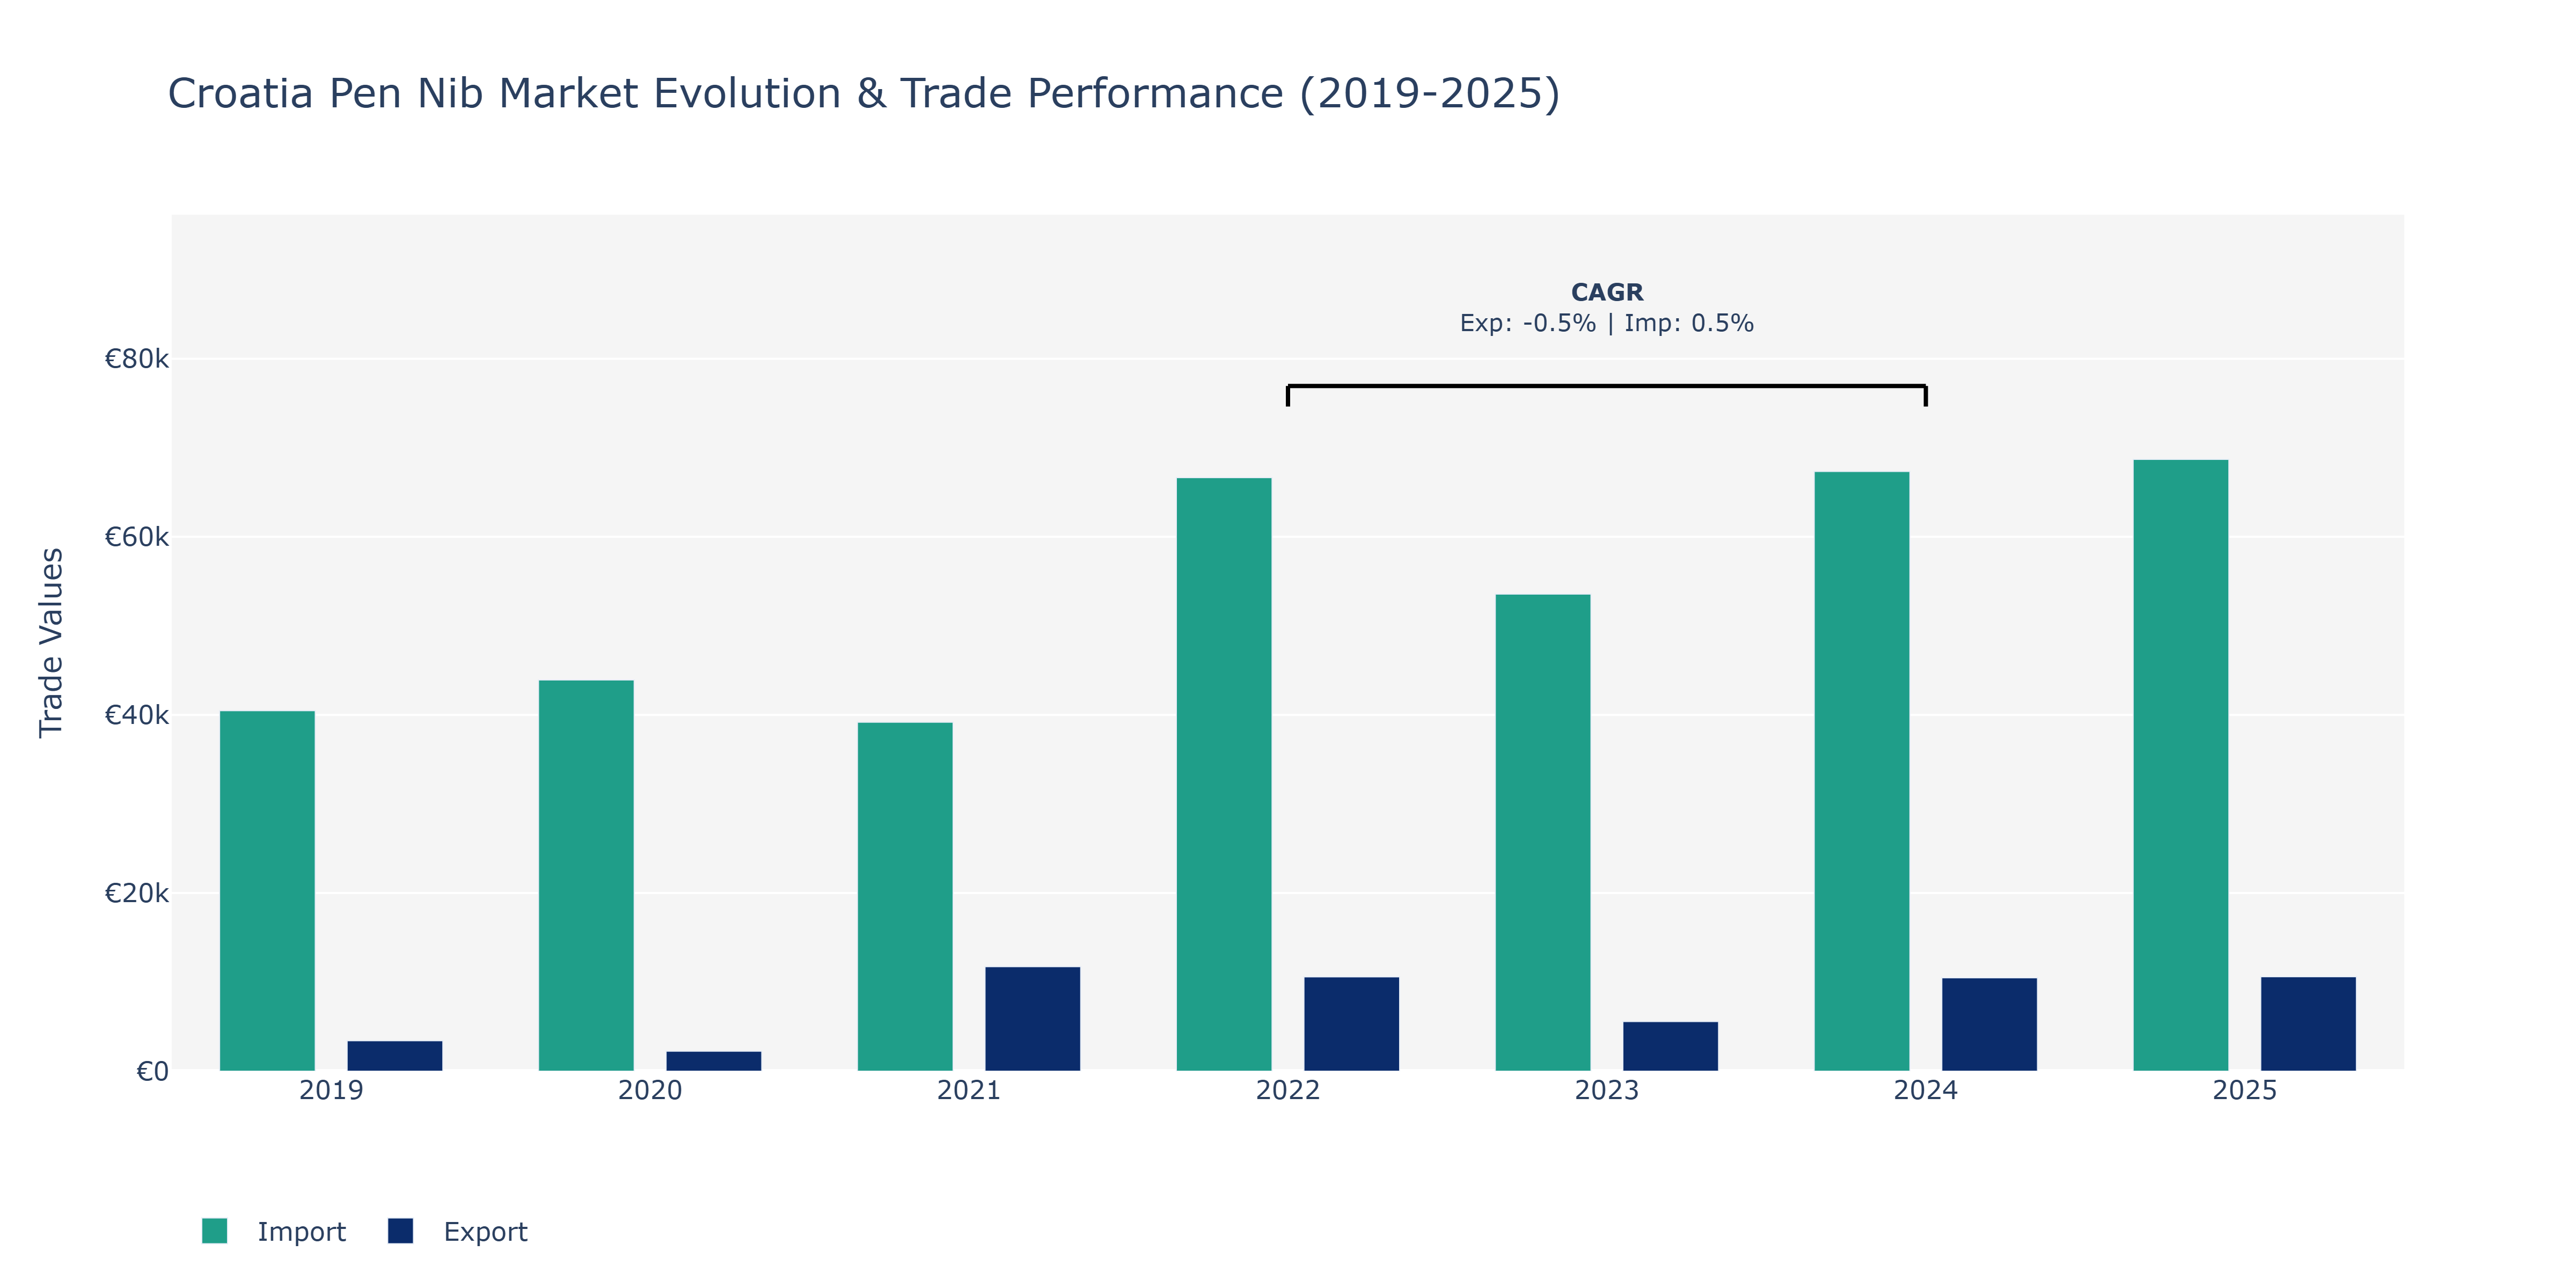
The Croatia Pen Nib Market witnessed fluctuating trends in both Exports and Imports from 2019 to 2025. The Exports peaked in 2021 at €11.73 thousand, demonstrating a substantial increase from the €3.42 thousand recorded in 2019. However, there was a notable decline in 2022 to €10.6 thousand, followed by a slight recovery in 2024 to €10.49 thousand. On the other hand, Imports experienced a consistent growth trajectory during the period, reaching their highest point in 2025 at €68.7 thousand, showing a steady increase from €40.48 thousand in 2019. The market's Imports surpassed Exports consistently, indicating a growing demand for pen nib products in Croatia. The surge in Imports can be attributed to increasing consumer preferences for premium writing instruments and the expansion of the stationery market in the region. Despite the slight volatility in Exports, the market remains dynamic and responsive to evolving consumer needs, presenting opportunities for further growth and innovation in the pen nib segment.
Key Highlights of the Report:
- Croatia Pen Nib Market Outlook
- Market Size of Croatia Pen Nib Market, 2025
- Forecast of Croatia Pen Nib Market, 2032
- Historical Data and Forecast of Croatia Pen Nib Revenues & Volume for the Period 2022 - 2032F
- Croatia Pen Nib Market Trend Evolution
- Croatia Pen Nib Market Drivers and Challenges
- Croatia Pen Nib Price Trends
- Croatia Pen Nib Porter`s Five Forces
- Croatia Pen Nib Industry Life Cycle
- Historical Data and Forecast of Croatia Pen Nib Market Revenues & Volume By Type for the Period 2022 - 2032F
- Historical Data and Forecast of Croatia Pen Nib Market Revenues & Volume By Stainless Nib for the Period 2022 - 2032F
- Historical Data and Forecast of Croatia Pen Nib Market Revenues & Volume By Gold Nib for the Period 2022 - 2032F
- Historical Data and Forecast of Croatia Pen Nib Market Revenues & Volume By Application for the Period 2022 - 2032F
- Historical Data and Forecast of Croatia Pen Nib Market Revenues & Volume By OEM for the Period 2022 - 2032F
- Historical Data and Forecast of Croatia Pen Nib Market Revenues & Volume By Aftermarket for the Period 2022 - 2032F
- Croatia Pen Nib Import Export Trade Statistics
- Market Opportunity Assessment By Type
- Market Opportunity Assessment By Application
- Croatia Pen Nib Top Companies Market Share
- Croatia Pen Nib Competitive Benchmarking By Technical and Operational Parameters
- Croatia Pen Nib Company Profiles
- Croatia Pen Nib Key Strategic Recommendations
Frequently Asked Questions About the Market Study (FAQs):
6Wresearch actively monitors the Croatia Pen Nib Market and publishes its comprehensive annual report, highlighting emerging trends, growth drivers, revenue analysis, and forecast outlook. Our insights help businesses to make data-backed strategic decisions with ongoing market dynamics. Our analysts track relevent industries related to the Croatia Pen Nib Market, allowing our clients with actionable intelligence and reliable forecasts tailored to emerging regional needs.
Yes, we provide customisation as per your requirements. To learn more, feel free to contact us on sales@6wresearch.com
1 Executive Summary |
2 Introduction |
2.1 Key Highlights of the Report |
2.2 Report Description |
2.3 Market Scope & Segmentation |
2.4 Research Methodology |
2.5 Assumptions |
3 Croatia Pen Nib Market Overview |
3.1 Croatia Country Macro Economic Indicators |
3.2 Croatia Pen Nib Market Revenues & Volume, 2022 & 2032F |
3.3 Croatia Pen Nib Market - Industry Life Cycle |
3.4 Croatia Pen Nib Market - Porter's Five Forces |
3.5 Croatia Pen Nib Market Revenues & Volume Share, By Type, 2022 & 2032F |
3.6 Croatia Pen Nib Market Revenues & Volume Share, By Application, 2022 & 2032F |
4 Croatia Pen Nib Market Dynamics |
4.1 Impact Analysis |
4.2 Market Drivers |
4.2.1 Increasing demand for premium writing instruments |
4.2.2 Growth in the education sector driving the need for writing supplies |
4.2.3 Innovation in pen nib technology leading to higher quality products |
4.3 Market Restraints |
4.3.1 Competition from digital devices impacting the use of traditional writing tools |
4.3.2 Fluctuating raw material prices affecting production costs |
5 Croatia Pen Nib Market Trends |
6 Croatia Pen Nib Market Segmentations |
6.1 Croatia Pen Nib Market, By Type |
6.1.1 Overview and Analysis |
6.1.2 Croatia Pen Nib Market Revenues & Volume, By Stainless Nib, 2022 - 2032F |
6.1.3 Croatia Pen Nib Market Revenues & Volume, By Gold Nib, 2022 - 2032F |
6.2 Croatia Pen Nib Market, By Application |
6.2.1 Overview and Analysis |
6.2.2 Croatia Pen Nib Market Revenues & Volume, By OEM, 2022 - 2032F |
6.2.3 Croatia Pen Nib Market Revenues & Volume, By Aftermarket, 2022 - 2032F |
7 Croatia Pen Nib Market Import-Export Trade Statistics |
7.1 Croatia Pen Nib Market Export to Major Countries |
7.2 Croatia Pen Nib Market Imports from Major Countries |
8 Croatia Pen Nib Market Key Performance Indicators |
8.1 Average selling price of pen nibs |
8.2 Number of patents filed for pen nib technology |
8.3 Customer satisfaction ratings for pen nib products |
8.4 Percentage of revenue invested in research and development |
8.5 Environmental sustainability practices in pen nib manufacturing |
9 Croatia Pen Nib Market - Opportunity Assessment |
9.1 Croatia Pen Nib Market Opportunity Assessment, By Type, 2022 & 2032F |
9.2 Croatia Pen Nib Market Opportunity Assessment, By Application, 2022 & 2032F |
10 Croatia Pen Nib Market - Competitive Landscape |
10.1 Croatia Pen Nib Market Revenue Share, By Companies, 2025 |
10.2 Croatia Pen Nib Market Competitive Benchmarking, By Operating and Technical Parameters |
11 Company Profiles |
12 Recommendations | 13 Disclaimer |
Global Go To Market Strategy - 2030
Export potential enables firms to identify high-growth global markets with greater confidence by combining advanced trade intelligence with a structured quantitative methodology. The framework analyzes emerging demand trends and country-level import patterns while integrating macroeconomic and trade datasets such as GDP and population forecasts, bilateral import–export flows, tariff structures, elasticity differentials between developed and developing economies, geographic distance, and import demand projections. Using weighted trade values from 2020–2024 as the base period to project country-to-country export potential for 2030, these inputs are operationalized through calculated drivers such as gravity model parameters, tariff impact factors, and projected GDP per-capita growth. Through an analysis of hidden potentials, demand hotspots, and market conditions that are most favorable to success, this method enables firms to focus on target countries, maximize returns, and global expansion with data, backed by accuracy.
By factoring in the projected importer demand gap that is currently unmet and could be potential opportunity, it identifies the potential for the Exporter (Country) among 190 countries, against the general trade analysis, which identifies the biggest importer or exporter.
To discover high-growth global markets and optimize your business strategy:
Click Here
Pricing
- Single User License$ 1,995
- Department License$ 2,400
- Site License$ 3,120
- Global License$ 3,795

Leadership Perspectives from Industry Events
Search
Thought Leadership and Analyst Meet


Our Clients
6WResearch In News
- India Export Attractiveness Tracker 2026
- India Air Conditioner Market Set for Strong Rebound in 2026 After Weather-Led Correction and GST-Driven Recovery: 6Wresearch
- ADAS in India: How Automatic Emergency Braking, Blind Spot Detection & Driver Monitoring are Transforming Road Safety
- Doha a strategic location for EV manufacturing hub: IPA Qatar
- Demand for luxury TVs surging in the GCC, says Samsung
- Empowering Growth: The Thriving Journey of Bangladesh’s Cable Industry
Latest Reports
- Nicaragua RPG Gaming Market (2026-2032)
- New Zealand RPG Gaming Market (2026-2032)
- Netherlands RPG Gaming Market (2026-2032)
- Nauru RPG Gaming Market (2026-2032)
- Namibia RPG Gaming Market (2026-2032)
- Mozambique RPG Gaming Market (2026-2032)
- Montenegro RPG Gaming Market (2026-2032)
- Mongolia RPG Gaming Market (2026-2032)
- Monaco RPG Gaming Market (2026-2032)
- Micronesia RPG Gaming Market (2026-2032)
Industry Events and Analyst Meet

EV India Expo 2026

HIMTEX 2026

India Refining Summit 2026

India EV Show 2026

EV tech India Expo 2026
Whitepaper
- Middle East & Africa Commercial Security Market Click here to view more.
- Middle East & Africa Fire Safety Systems & Equipment Market Click here to view more.
- GCC Drone Market Click here to view more.
- Middle East Lighting Fixture Market Click here to view more.
- GCC Physical & Perimeter Security Market Click here to view more.