Croatia Polysilicon Market (2026-2032) | Segmentation, Forecast, Outlook, Revenue, Growth, Share, Industry, Analysis, Companies, Size, Value & Trends
Market Forecast By End Use Industry (Solar PV, Electronics), By Form (Chunks, Granules, Rods) And Competitive Landscape
| Product Code: ETC5737357 | Publication Date: Nov 2023 | Updated Date: Apr 2026 | Product Type: Market Research Report | |
| Publisher: 6Wresearch | Author: Ravi Bhandari | No. of Pages: 60 | No. of Figures: 30 | No. of Tables: 5 |
Croatia Polysilicon Market Size (2020-2030)
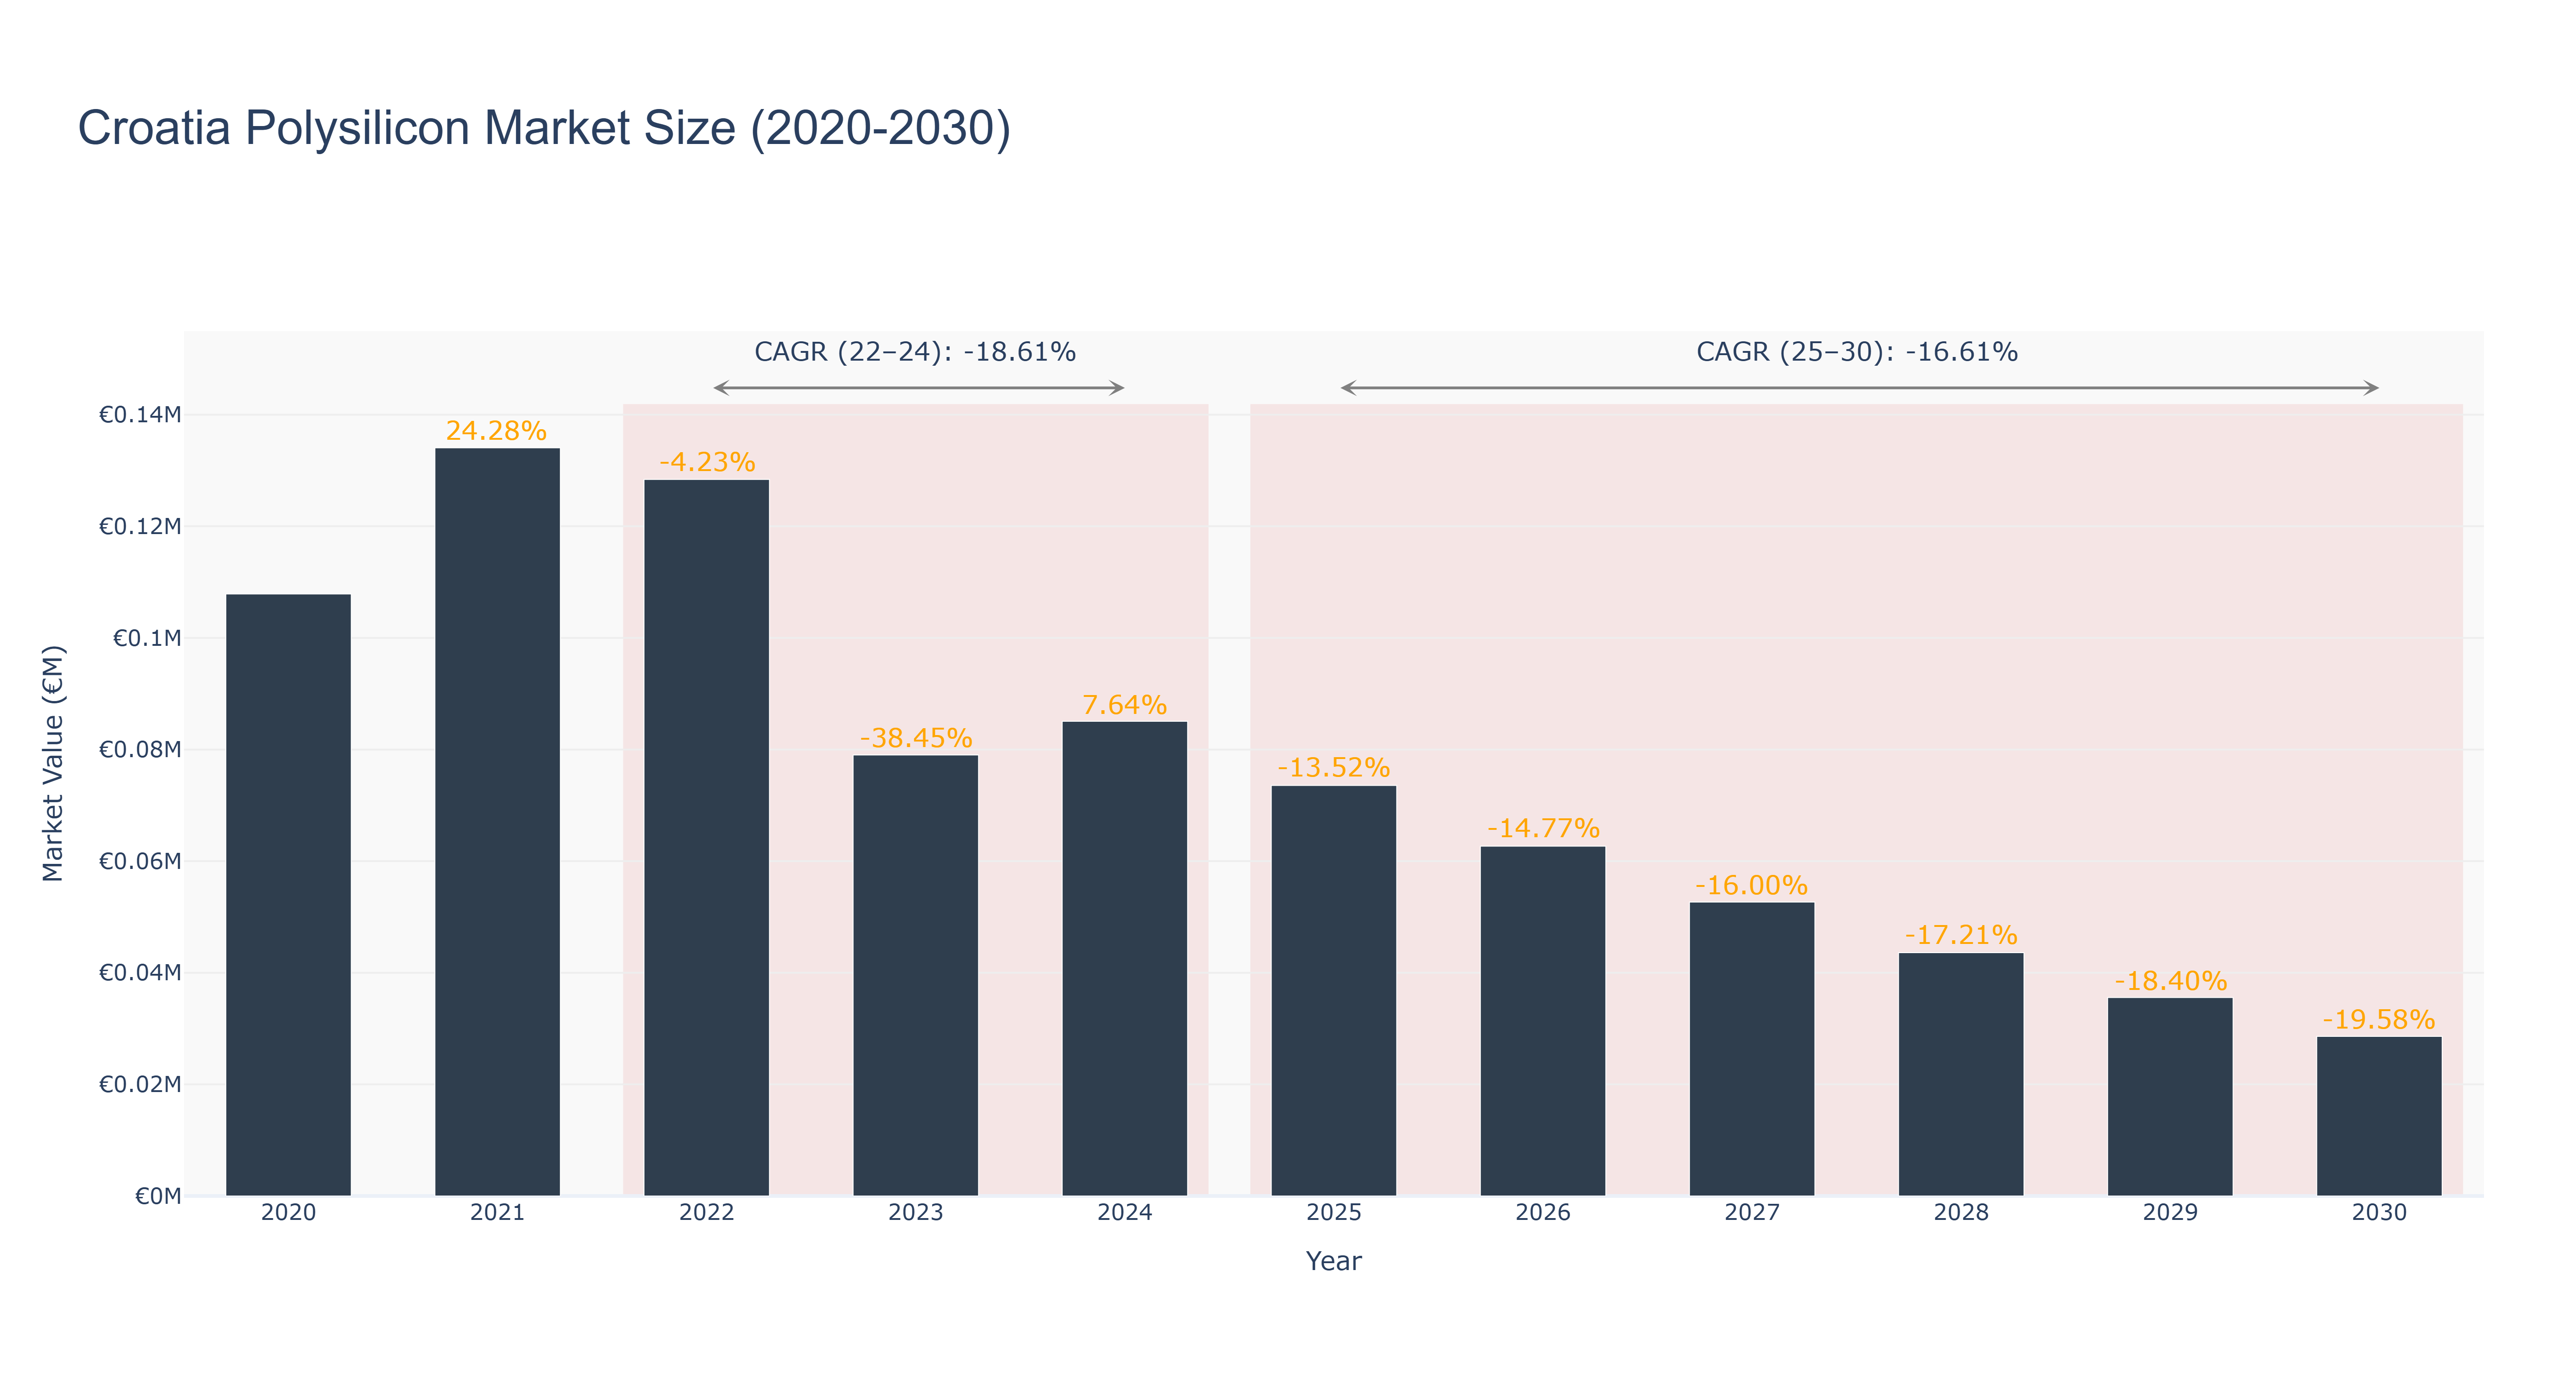
Croatia's Polysilicon Market experienced a peak market size of €0.13 million in 2021, with a subsequent decline to €0.07 million in 2025. The market is forecasted to further decrease to €0.03 million by 2030, reflecting a downward trend. The CAGR from 2022-24 stands at -18.61%, while the CAGR from 2025-30 is projected at -16.61%. The market's contraction can be attributed to global oversupply, leading to price erosion and decreased demand. However, Croatia is actively investing in renewable energy projects, including solar power initiatives, which could potentially stimulate the demand for polysilicon in the future. These developments aim to diversify the energy mix and reduce carbon emissions, indicating a shift towards sustainable practices in the country's energy sector.
Croatia Polysilicon Market: Production & Trade Performance (2019-2025)
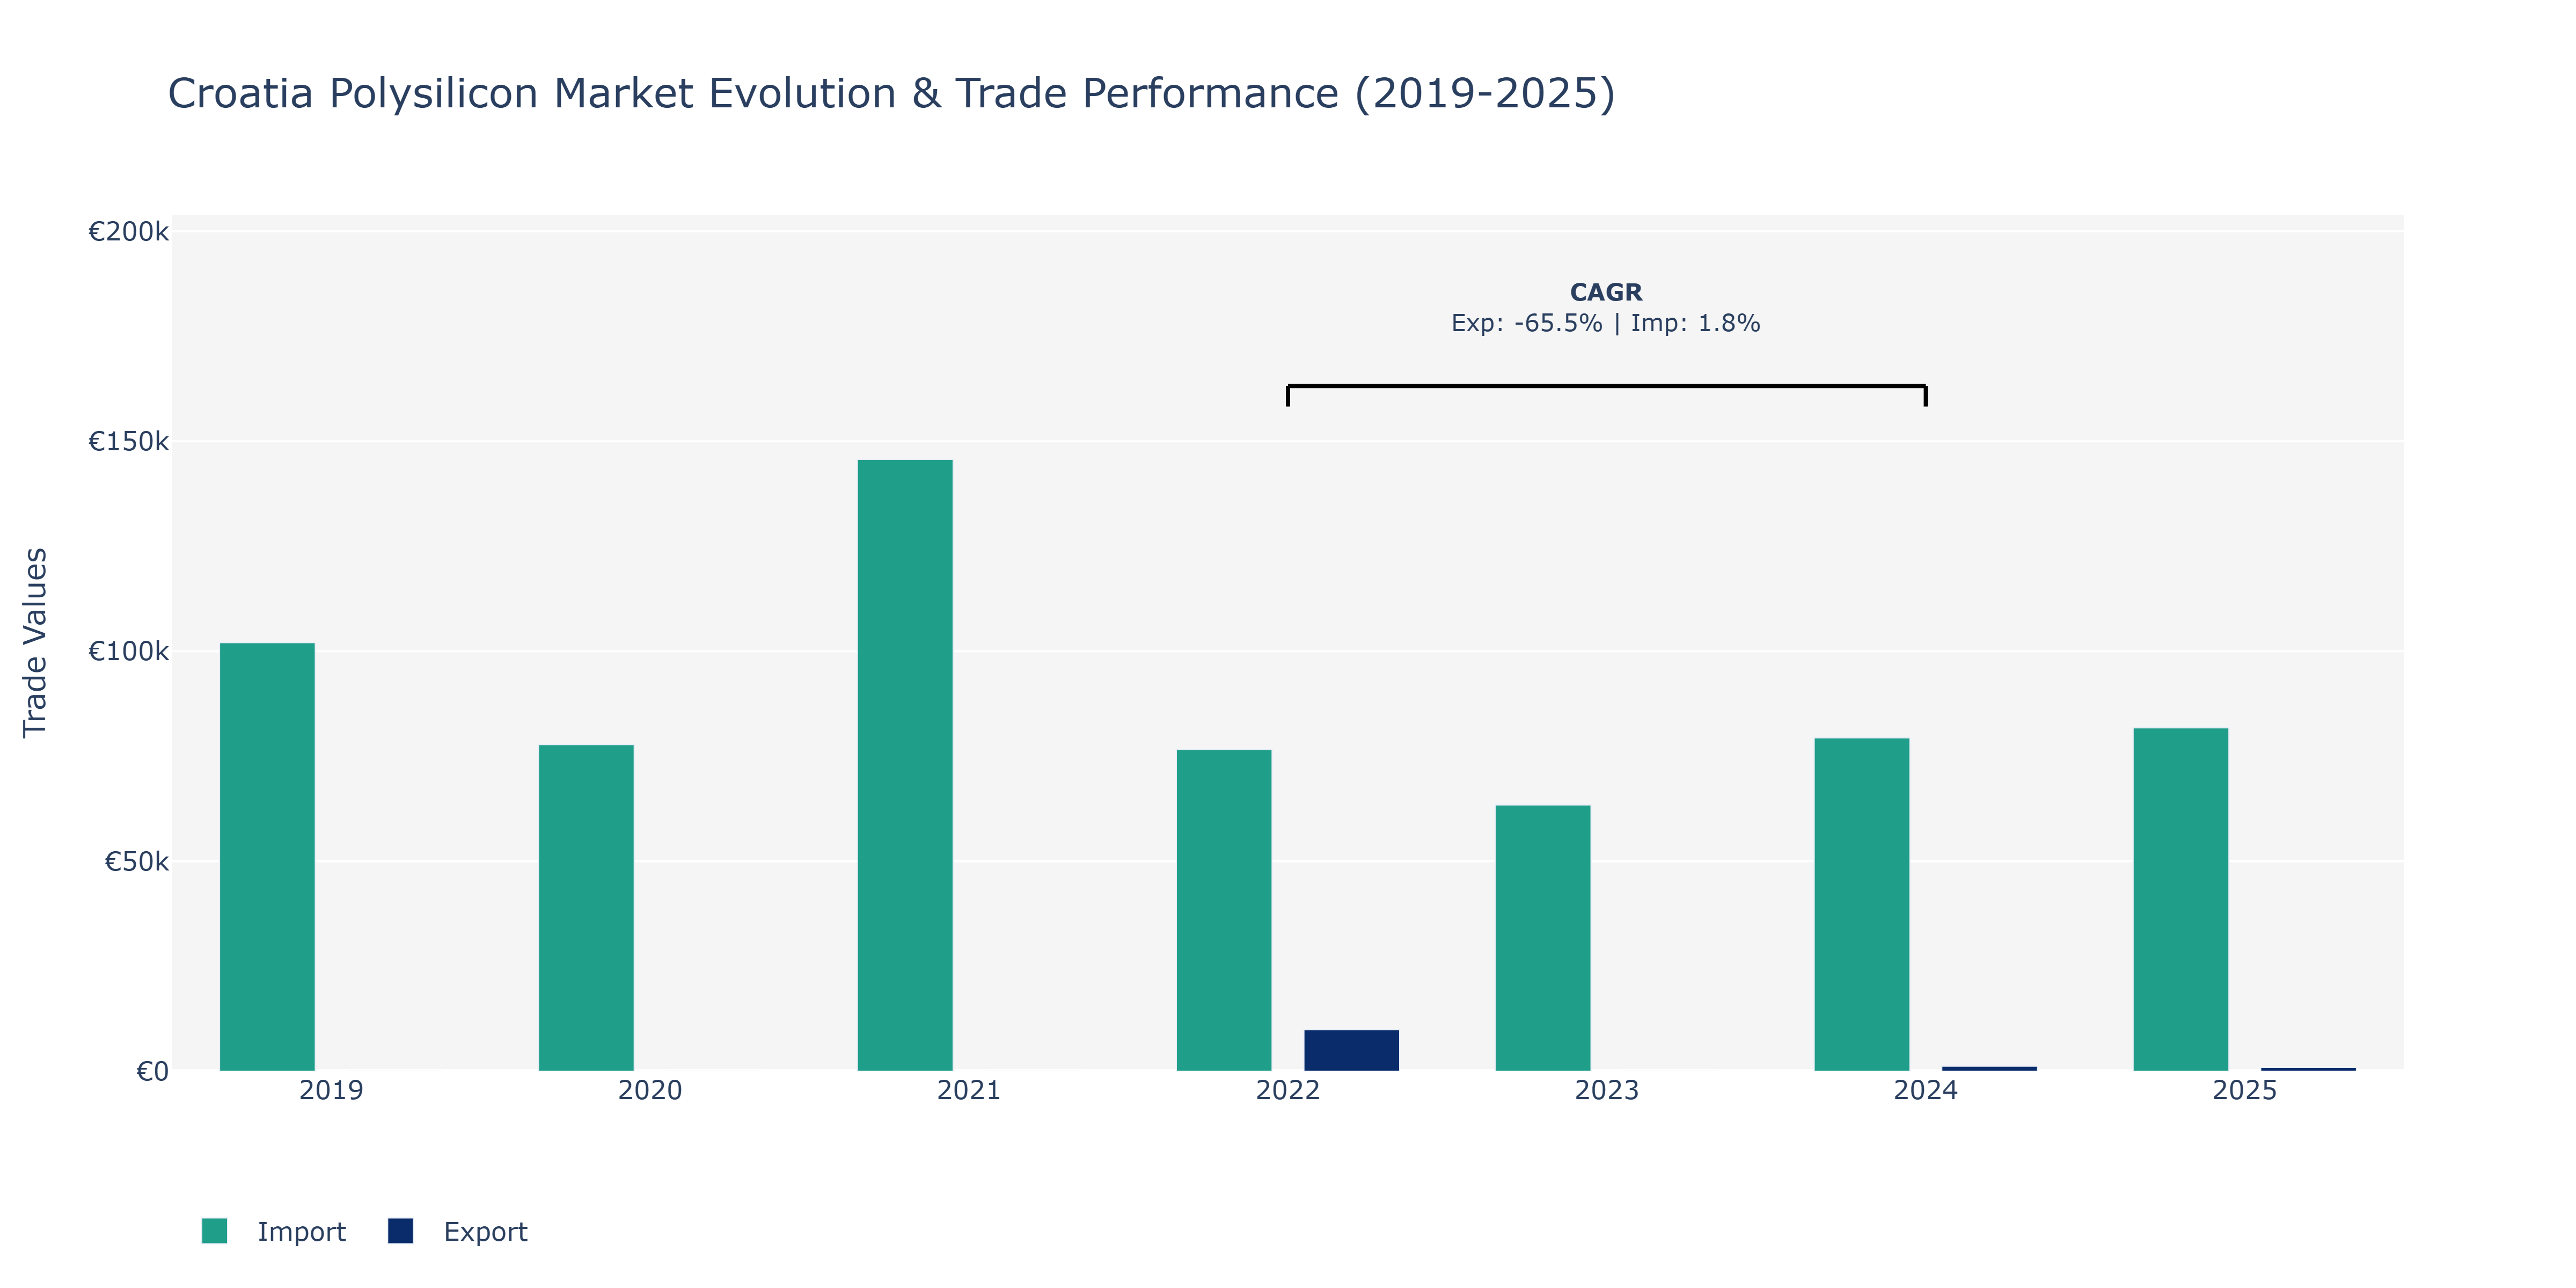
Between 2019 and 2025, Croatia's Polysilicon Market showcased notable fluctuations in both exports and imports. In 2019, imports stood at €102.03 thousand, decreasing to €77.76 thousand in 2020, before witnessing a significant surge to €145.68 thousand in 2021. The year 2022 marked the entry of exports at €9.89 thousand, complemented by imports amounting to €76.54 thousand. Subsequently, 2023 saw a slight decline in imports to €63.39 thousand, while in 2024, exports dropped to €1.18 thousand alongside imports rising to €79.35 thousand. The year 2025 continued the upward trend in imports, reaching €81.76 thousand. These fluctuations can be attributed to market dynamics, such as shifts in demand-supply dynamics, global trade policies, and technological advancements impacting the polysilicon industry. Croatia's strategic positioning in the European market and its efforts to enhance industrial competitiveness might have influenced these trends, aligning with the overall industry landscape and economic conditions.
Key Highlights of the Report:
- Croatia Polysilicon Market Outlook
- Market Size of Croatia Polysilicon Market, 2025
- Forecast of Croatia Polysilicon Market, 2032
- Historical Data and Forecast of Croatia Polysilicon Revenues & Volume for the Period 2022 - 2032F
- Croatia Polysilicon Market Trend Evolution
- Croatia Polysilicon Market Drivers and Challenges
- Croatia Polysilicon Price Trends
- Croatia Polysilicon Porter`s Five Forces
- Croatia Polysilicon Industry Life Cycle
- Historical Data and Forecast of Croatia Polysilicon Market Revenues & Volume By End Use Industry for the Period 2022 - 2032F
- Historical Data and Forecast of Croatia Polysilicon Market Revenues & Volume By Solar PV for the Period 2022 - 2032F
- Historical Data and Forecast of Croatia Polysilicon Market Revenues & Volume By Electronics for the Period 2022 - 2032F
- Historical Data and Forecast of Croatia Polysilicon Market Revenues & Volume By Form for the Period 2022 - 2032F
- Historical Data and Forecast of Croatia Polysilicon Market Revenues & Volume By Chunks for the Period 2022 - 2032F
- Historical Data and Forecast of Croatia Polysilicon Market Revenues & Volume By Granules for the Period 2022 - 2032F
- Historical Data and Forecast of Croatia Polysilicon Market Revenues & Volume By Rods for the Period 2022 - 2032F
- Croatia Polysilicon Import Export Trade Statistics
- Market Opportunity Assessment By End Use Industry
- Market Opportunity Assessment By Form
- Croatia Polysilicon Top Companies Market Share
- Croatia Polysilicon Competitive Benchmarking By Technical and Operational Parameters
- Croatia Polysilicon Company Profiles
- Croatia Polysilicon Key Strategic Recommendations
Frequently Asked Questions About the Market Study (FAQs):
6Wresearch actively monitors the Croatia Polysilicon Market and publishes its comprehensive annual report, highlighting emerging trends, growth drivers, revenue analysis, and forecast outlook. Our insights help businesses to make data-backed strategic decisions with ongoing market dynamics. Our analysts track relevent industries related to the Croatia Polysilicon Market, allowing our clients with actionable intelligence and reliable forecasts tailored to emerging regional needs.
Yes, we provide customisation as per your requirements. To learn more, feel free to contact us on sales@6wresearch.com
1 Executive Summary |
2 Introduction |
2.1 Key Highlights of the Report |
2.2 Report Description |
2.3 Market Scope & Segmentation |
2.4 Research Methodology |
2.5 Assumptions |
3 Croatia Polysilicon Market Overview |
3.1 Croatia Country Macro Economic Indicators |
3.2 Croatia Polysilicon Market Revenues & Volume, 2022 & 2032F |
3.3 Croatia Polysilicon Market - Industry Life Cycle |
3.4 Croatia Polysilicon Market - Porter's Five Forces |
3.5 Croatia Polysilicon Market Revenues & Volume Share, By End Use Industry, 2022 & 2032F |
3.6 Croatia Polysilicon Market Revenues & Volume Share, By Form, 2022 & 2032F |
4 Croatia Polysilicon Market Dynamics |
4.1 Impact Analysis |
4.2 Market Drivers |
4.2.1 Growing demand for solar energy solutions in Croatia |
4.2.2 Government incentives and policies supporting renewable energy development |
4.2.3 Increasing awareness about the environmental benefits of using polysilicon in solar panels |
4.3 Market Restraints |
4.3.1 High initial investment required for setting up polysilicon manufacturing facilities |
4.3.2 Fluctuating raw material prices impacting production costs |
4.3.3 Competition from other renewable energy sources like wind and hydroelectric power |
5 Croatia Polysilicon Market Trends |
6 Croatia Polysilicon Market Segmentations |
6.1 Croatia Polysilicon Market, By End Use Industry |
6.1.1 Overview and Analysis |
6.1.2 Croatia Polysilicon Market Revenues & Volume, By Solar PV, 2022 - 2032F |
6.1.3 Croatia Polysilicon Market Revenues & Volume, By Electronics, 2022 - 2032F |
6.2 Croatia Polysilicon Market, By Form |
6.2.1 Overview and Analysis |
6.2.2 Croatia Polysilicon Market Revenues & Volume, By Chunks, 2022 - 2032F |
6.2.3 Croatia Polysilicon Market Revenues & Volume, By Granules, 2022 - 2032F |
6.2.4 Croatia Polysilicon Market Revenues & Volume, By Rods, 2022 - 2032F |
7 Croatia Polysilicon Market Import-Export Trade Statistics |
7.1 Croatia Polysilicon Market Export to Major Countries |
7.2 Croatia Polysilicon Market Imports from Major Countries |
8 Croatia Polysilicon Market Key Performance Indicators |
8.1 Research and development investments in polysilicon technology |
8.2 Number of new solar energy projects initiated in Croatia |
8.3 Percentage of energy consumption in Croatia derived from solar sources |
8.4 Environmental impact assessments related to polysilicon production and usage |
8.5 Adoption rate of polysilicon technology in various industries in Croatia |
9 Croatia Polysilicon Market - Opportunity Assessment |
9.1 Croatia Polysilicon Market Opportunity Assessment, By End Use Industry, 2022 & 2032F |
9.2 Croatia Polysilicon Market Opportunity Assessment, By Form, 2022 & 2032F |
10 Croatia Polysilicon Market - Competitive Landscape |
10.1 Croatia Polysilicon Market Revenue Share, By Companies, 2025 |
10.2 Croatia Polysilicon Market Competitive Benchmarking, By Operating and Technical Parameters |
11 Company Profiles |
12 Recommendations | 13 Disclaimer |
Global Go To Market Strategy - 2030
Export potential enables firms to identify high-growth global markets with greater confidence by combining advanced trade intelligence with a structured quantitative methodology. The framework analyzes emerging demand trends and country-level import patterns while integrating macroeconomic and trade datasets such as GDP and population forecasts, bilateral import–export flows, tariff structures, elasticity differentials between developed and developing economies, geographic distance, and import demand projections. Using weighted trade values from 2020–2024 as the base period to project country-to-country export potential for 2030, these inputs are operationalized through calculated drivers such as gravity model parameters, tariff impact factors, and projected GDP per-capita growth. Through an analysis of hidden potentials, demand hotspots, and market conditions that are most favorable to success, this method enables firms to focus on target countries, maximize returns, and global expansion with data, backed by accuracy.
By factoring in the projected importer demand gap that is currently unmet and could be potential opportunity, it identifies the potential for the Exporter (Country) among 190 countries, against the general trade analysis, which identifies the biggest importer or exporter.
To discover high-growth global markets and optimize your business strategy:
Click Here
Pricing
- Single User License$ 1,995
- Department License$ 2,400
- Site License$ 3,120
- Global License$ 3,795

Leadership Perspectives from Industry Events
Search
Thought Leadership and Analyst Meet


Our Clients
6WResearch In News
- India Export Attractiveness Tracker 2026
- India Air Conditioner Market Set for Strong Rebound in 2026 After Weather-Led Correction and GST-Driven Recovery: 6Wresearch
- ADAS in India: How Automatic Emergency Braking, Blind Spot Detection & Driver Monitoring are Transforming Road Safety
- Doha a strategic location for EV manufacturing hub: IPA Qatar
- Demand for luxury TVs surging in the GCC, says Samsung
- Empowering Growth: The Thriving Journey of Bangladesh’s Cable Industry
Latest Reports
- Nicaragua RPG Gaming Market (2026-2032)
- New Zealand RPG Gaming Market (2026-2032)
- Netherlands RPG Gaming Market (2026-2032)
- Nauru RPG Gaming Market (2026-2032)
- Namibia RPG Gaming Market (2026-2032)
- Mozambique RPG Gaming Market (2026-2032)
- Montenegro RPG Gaming Market (2026-2032)
- Mongolia RPG Gaming Market (2026-2032)
- Monaco RPG Gaming Market (2026-2032)
- Micronesia RPG Gaming Market (2026-2032)
Industry Events and Analyst Meet

EV India Expo 2026

HIMTEX 2026

India Refining Summit 2026

India EV Show 2026

EV tech India Expo 2026
Whitepaper
- Middle East & Africa Commercial Security Market Click here to view more.
- Middle East & Africa Fire Safety Systems & Equipment Market Click here to view more.
- GCC Drone Market Click here to view more.
- Middle East Lighting Fixture Market Click here to view more.
- GCC Physical & Perimeter Security Market Click here to view more.