Croatia Shoe Polish Market (2026-2032) | Growth, Trends, Share, Forecast, Industry, Size, Analysis, Outlook, Value, Segmentation, Companies & Revenue
Market Forecast By Type (Cream Polish, Liquid Polish, Wax Polish, Others), By Product (Shoe Shine Oil, Shoe Leather Nourishing Cream, Shoe Leather Softener, Others), By Application (Household, Commercial), By Location (Urban, Rural), By Distribution Channel (Supermarkets/Hypermarkets, Convenience Stores, Footwear Showrooms/Specialty Stores, Online Retail, Others) And Competitive Landscape
| Product Code: ETC4720857 | Publication Date: Nov 2023 | Updated Date: Apr 2026 | Product Type: Market Research Report | |
| Publisher: 6Wresearch | Author: Shubham Padhi | No. of Pages: 60 | No. of Figures: 30 | No. of Tables: 5 |
Croatia Shoe Polish Market Size (2020-2030)
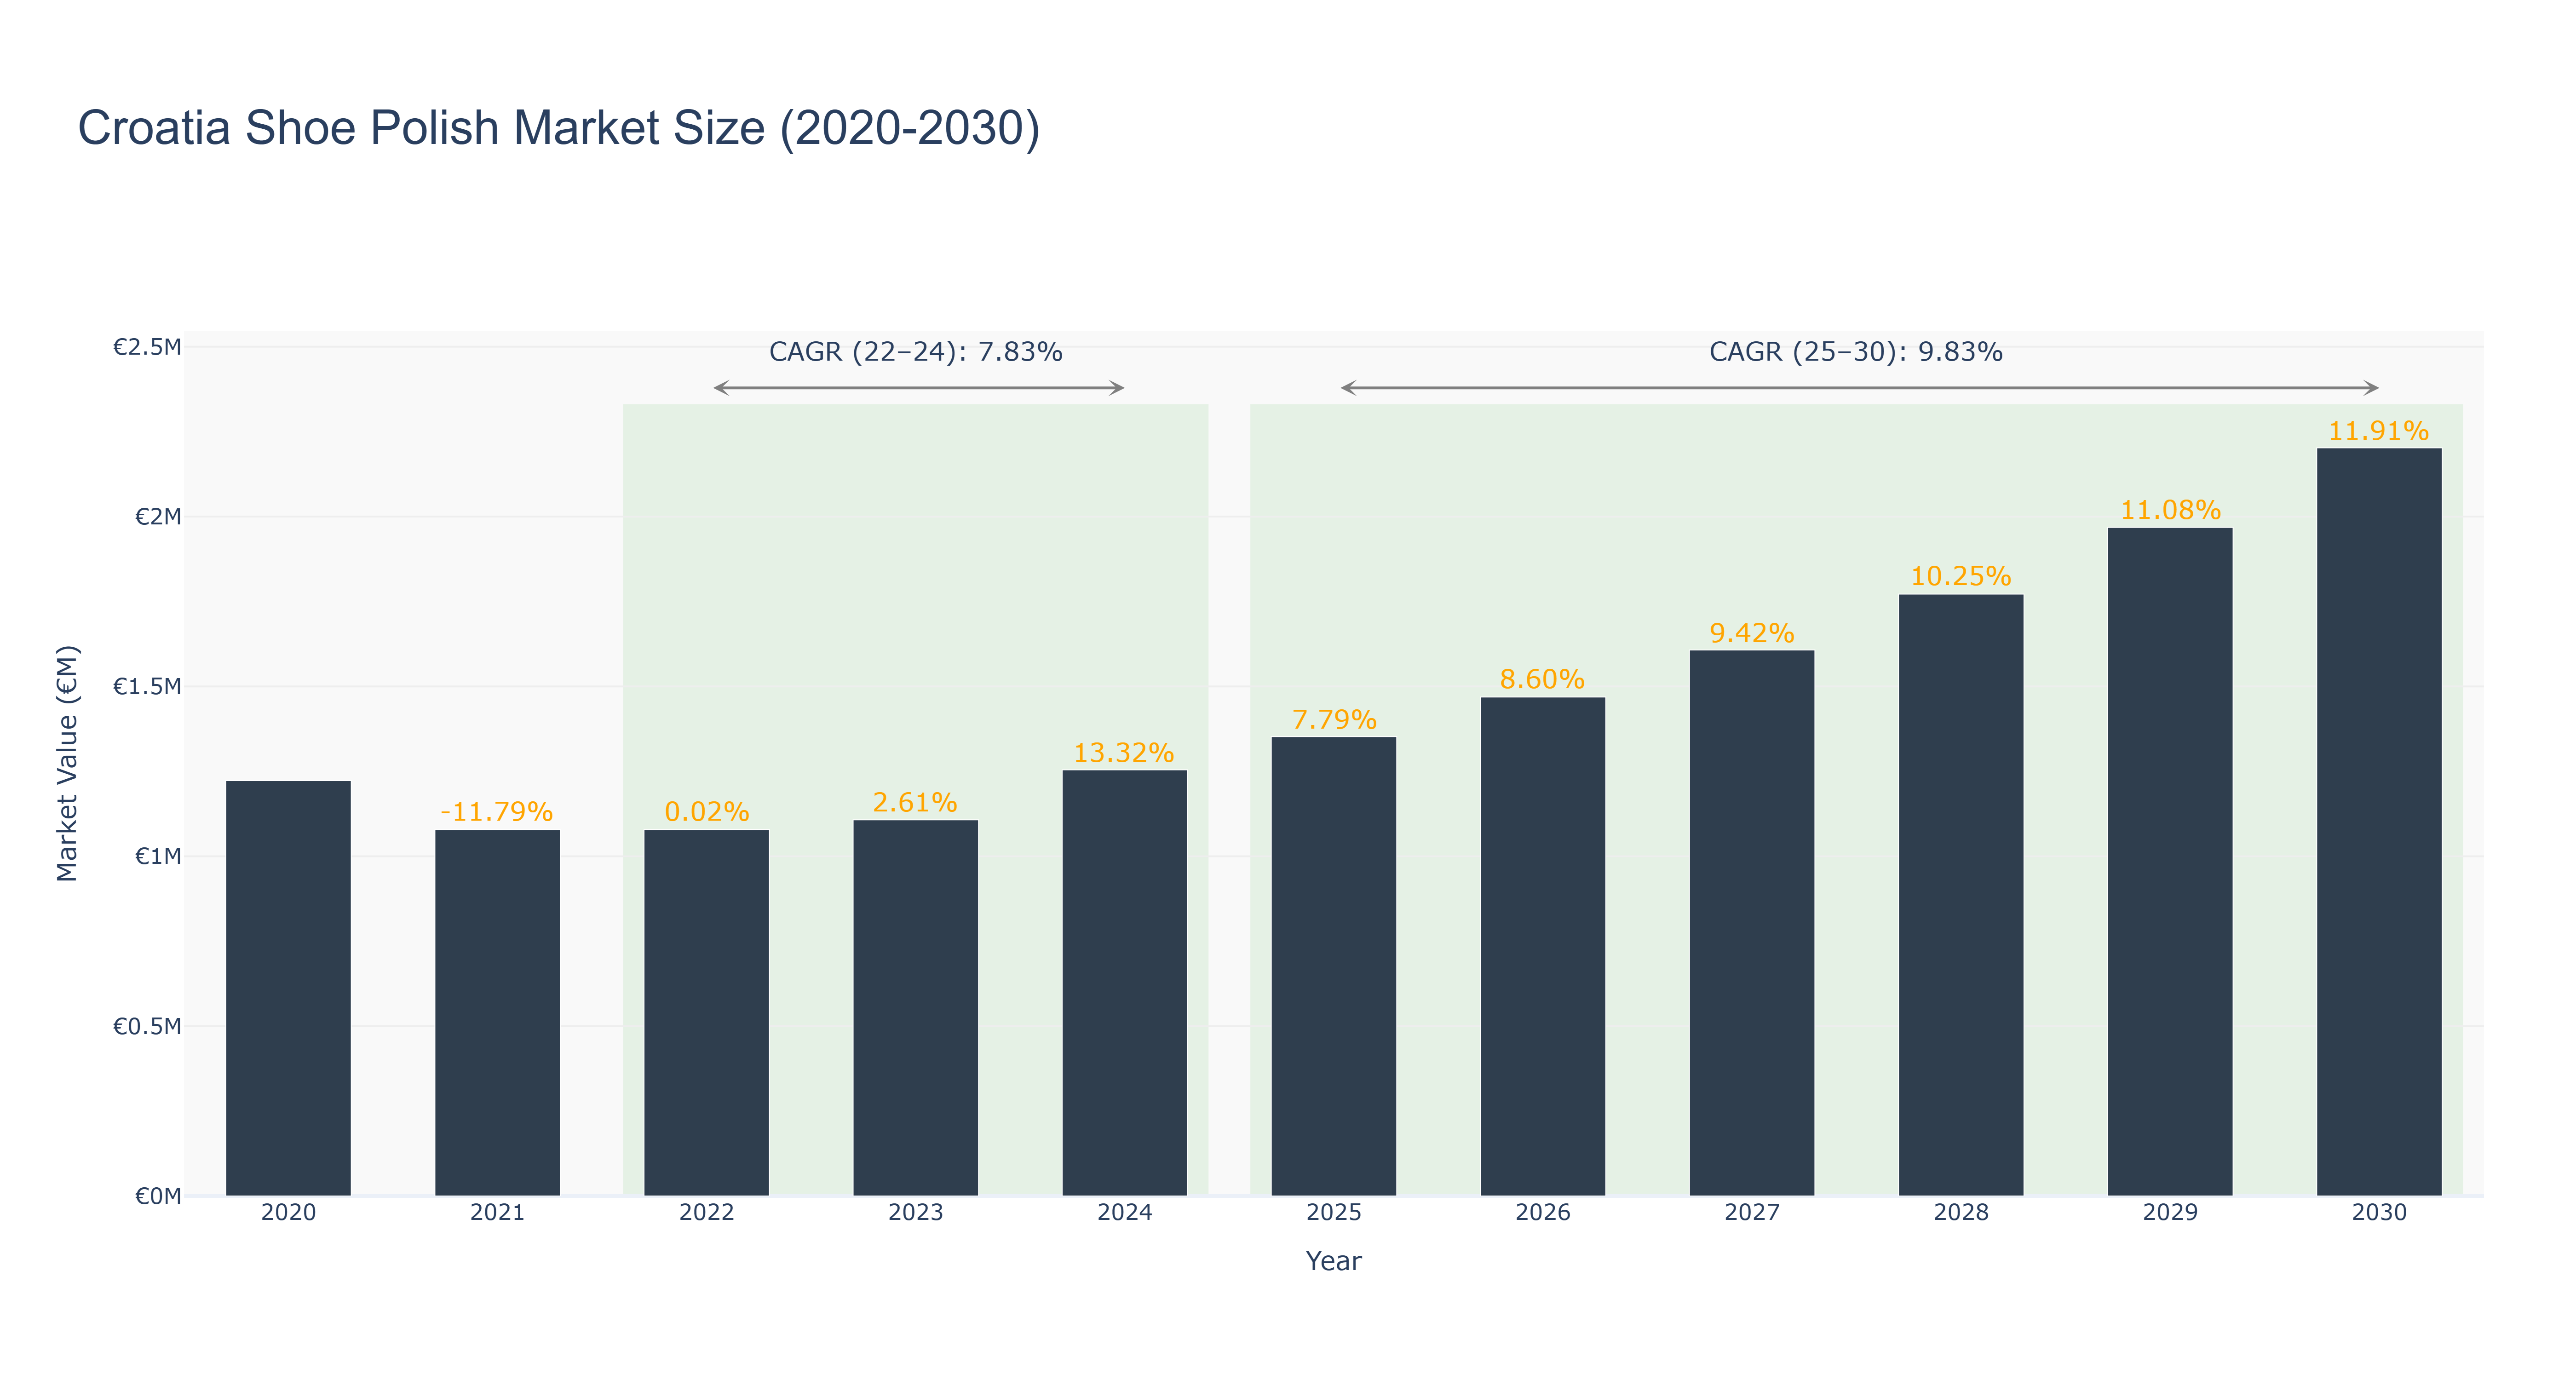
Croatia Shoe Polish Market has shown a steady growth trajectory over the past decade. The peak market size was €2.20 million in 2030, with a notable increase in market size from €1.08 million in 2020 to €1.25 million in 2024. The forecasted market size is expected to reach €2.54 million by 2030. The CAGR for the period 2022-24 was 7.83%, while for 2025-30, it is projected at 9.83%. The market's growth can be attributed to increasing consumer awareness of shoe care products and a growing emphasis on personal grooming. Looking ahead, Croatia is set to witness new investments in eco-friendly shoe polish products to align with sustainability trends, further boosting market growth. With a positive growth outlook and evolving consumer preferences, the Croatia Shoe Polish Market is poised for continued expansion.
Croatia Shoe Polish Market: Production & Trade Performance (2019-2025)
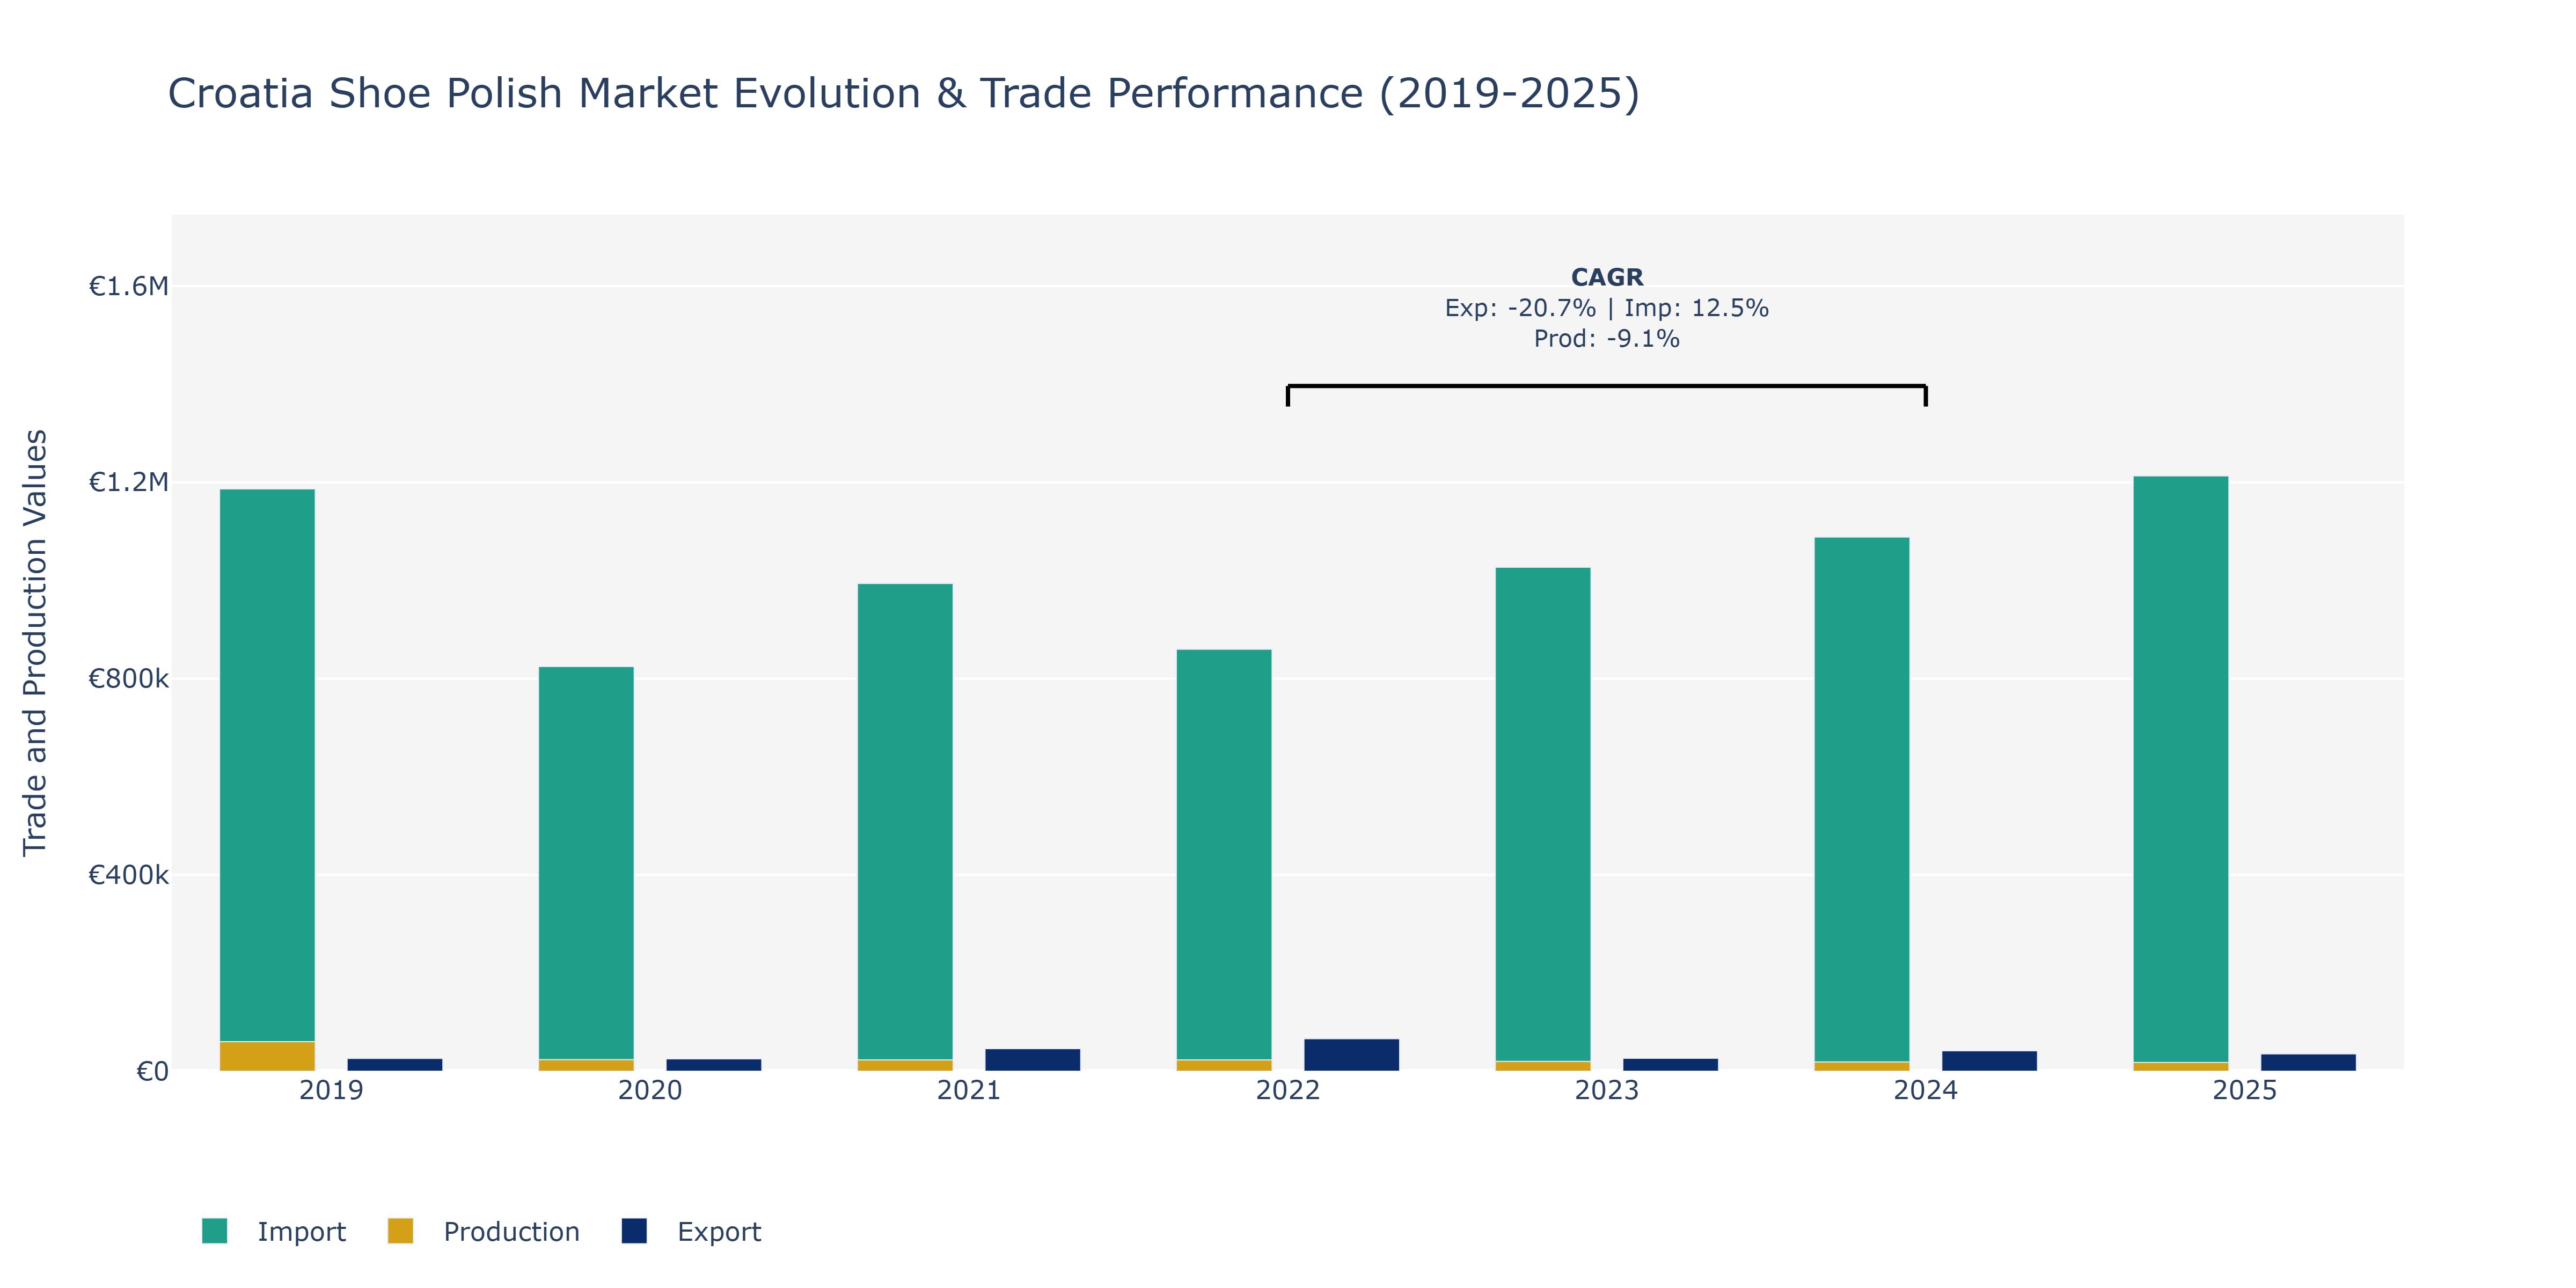
In the Croatia Shoe Polish Market, exports experienced fluctuations over the years, reaching a peak in 2022 at €66.29 thousand and then declining notably to €26.21 thousand in 2023 before partially recovering to €41.7 thousand in 2024. Conversely, imports consistently exceeded exports by a significant margin, with a peak in 2019 at €1.19 million and stabilizing around €1.08 million from 2022 to 2024. Production levels remained relatively stable from 2020 to 2022 but saw a substantial decrease in 2023 to €20.00 thousand, followed by a further decline to €17.91 thousand in 2025. These fluctuations in exports, imports, and production can be attributed to various factors, including changes in consumer demand, global economic conditions impacting trade volumes, and shifts in manufacturing capabilities within the shoe polish industry. As the market continues to evolve, stakeholders may need to adapt their strategies to navigate these dynamic trends and remain competitive.
Key Highlights of the Report:
- Croatia Shoe Polish Market Outlook
- Market Size of Croatia Shoe Polish Market, 2025
- Forecast of Croatia Shoe Polish Market, 2032
- Historical Data and Forecast of Croatia Shoe Polish Revenues & Volume for the Period 2022 - 2032F
- Croatia Shoe Polish Market Trend Evolution
- Croatia Shoe Polish Market Drivers and Challenges
- Croatia Shoe Polish Price Trends
- Croatia Shoe Polish Porter`s Five Forces
- Croatia Shoe Polish Industry Life Cycle
- Historical Data and Forecast of Croatia Shoe Polish Market Revenues & Volume By Type for the Period 2022 - 2032F
- Historical Data and Forecast of Croatia Shoe Polish Market Revenues & Volume By Cream Polish for the Period 2022 - 2032F
- Historical Data and Forecast of Croatia Shoe Polish Market Revenues & Volume By Liquid Polish for the Period 2022 - 2032F
- Historical Data and Forecast of Croatia Shoe Polish Market Revenues & Volume By Wax Polish for the Period 2022 - 2032F
- Historical Data and Forecast of Croatia Shoe Polish Market Revenues & Volume By Others for the Period 2022 - 2032F
- Historical Data and Forecast of Croatia Shoe Polish Market Revenues & Volume By Product for the Period 2022 - 2032F
- Historical Data and Forecast of Croatia Shoe Polish Market Revenues & Volume By Shoe Shine Oil for the Period 2022 - 2032F
- Historical Data and Forecast of Croatia Shoe Polish Market Revenues & Volume By Shoe Leather Nourishing Cream for the Period 2022 - 2032F
- Historical Data and Forecast of Croatia Shoe Polish Market Revenues & Volume By Shoe Leather Softener for the Period 2022 - 2032F
- Historical Data and Forecast of Croatia Shoe Polish Market Revenues & Volume By Others for the Period 2022 - 2032F
- Historical Data and Forecast of Croatia Shoe Polish Market Revenues & Volume By Application for the Period 2022 - 2032F
- Historical Data and Forecast of Croatia Shoe Polish Market Revenues & Volume By Household for the Period 2022 - 2032F
- Historical Data and Forecast of Croatia Shoe Polish Market Revenues & Volume By Commercial for the Period 2022 - 2032F
- Historical Data and Forecast of Croatia Shoe Polish Market Revenues & Volume By Location for the Period 2022 - 2032F
- Historical Data and Forecast of Croatia Shoe Polish Market Revenues & Volume By Urban for the Period 2022 - 2032F
- Historical Data and Forecast of Croatia Shoe Polish Market Revenues & Volume By Rural for the Period 2022 - 2032F
- Historical Data and Forecast of Croatia Shoe Polish Market Revenues & Volume By Distribution Channel for the Period 2022 - 2032F
- Historical Data and Forecast of Croatia Shoe Polish Market Revenues & Volume By Supermarkets/Hypermarkets for the Period 2022 - 2032F
- Historical Data and Forecast of Croatia Shoe Polish Market Revenues & Volume By Convenience Stores for the Period 2022 - 2032F
- Historical Data and Forecast of Croatia Shoe Polish Market Revenues & Volume By Footwear Showrooms/Specialty Stores for the Period 2022 - 2032F
- Historical Data and Forecast of Croatia Shoe Polish Market Revenues & Volume By Online Retail for the Period 2022 - 2032F
- Historical Data and Forecast of Croatia Shoe Polish Market Revenues & Volume By Others for the Period 2022 - 2032F
- Croatia Shoe Polish Import Export Trade Statistics
- Market Opportunity Assessment By Type
- Market Opportunity Assessment By Product
- Market Opportunity Assessment By Application
- Market Opportunity Assessment By Location
- Market Opportunity Assessment By Distribution Channel
- Croatia Shoe Polish Top Companies Market Share
- Croatia Shoe Polish Competitive Benchmarking By Technical and Operational Parameters
- Croatia Shoe Polish Company Profiles
- Croatia Shoe Polish Key Strategic Recommendations
Frequently Asked Questions About the Market Study (FAQs):
6Wresearch actively monitors the Croatia Shoe Polish Market and publishes its comprehensive annual report, highlighting emerging trends, growth drivers, revenue analysis, and forecast outlook. Our insights help businesses to make data-backed strategic decisions with ongoing market dynamics. Our analysts track relevent industries related to the Croatia Shoe Polish Market, allowing our clients with actionable intelligence and reliable forecasts tailored to emerging regional needs.
Yes, we provide customisation as per your requirements. To learn more, feel free to contact us on sales@6wresearch.com
1 Executive Summary |
2 Introduction |
2.1 Key Highlights of the Report |
2.2 Report Description |
2.3 Market Scope & Segmentation |
2.4 Research Methodology |
2.5 Assumptions |
3 Croatia Shoe Polish Market Overview |
3.1 Croatia Country Macro Economic Indicators |
3.2 Croatia Shoe Polish Market Revenues & Volume, 2022 & 2032F |
3.3 Croatia Shoe Polish Market - Industry Life Cycle |
3.4 Croatia Shoe Polish Market - Porter's Five Forces |
3.5 Croatia Shoe Polish Market Revenues & Volume Share, By Type, 2022 & 2032F |
3.6 Croatia Shoe Polish Market Revenues & Volume Share, By Product, 2022 & 2032F |
3.7 Croatia Shoe Polish Market Revenues & Volume Share, By Application, 2022 & 2032F |
3.8 Croatia Shoe Polish Market Revenues & Volume Share, By Location, 2022 & 2032F |
3.9 Croatia Shoe Polish Market Revenues & Volume Share, By Distribution Channel, 2022 & 2032F |
4 Croatia Shoe Polish Market Dynamics |
4.1 Impact Analysis |
4.2 Market Drivers |
4.2.1 Increasing disposable income of consumers in Croatia, leading to higher spending on shoe care products. |
4.2.2 Growing awareness about personal grooming and the importance of maintaining footwear, driving demand for shoe polish. |
4.2.3 Expansion of the footwear industry in Croatia, creating a larger market for shoe polish products. |
4.3 Market Restraints |
4.3.1 Seasonality of demand, with higher sales in certain periods such as winter. |
4.3.2 Competition from alternative shoe care products like sprays and wipes. |
4.3.3 Environmental concerns leading to a shift towards eco-friendly and sustainable shoe care solutions. |
5 Croatia Shoe Polish Market Trends |
6 Croatia Shoe Polish Market Segmentations |
6.1 Croatia Shoe Polish Market, By Type |
6.1.1 Overview and Analysis |
6.1.2 Croatia Shoe Polish Market Revenues & Volume, By Cream Polish, 2022 - 2032F |
6.1.3 Croatia Shoe Polish Market Revenues & Volume, By Liquid Polish, 2022 - 2032F |
6.1.4 Croatia Shoe Polish Market Revenues & Volume, By Wax Polish, 2022 - 2032F |
6.1.5 Croatia Shoe Polish Market Revenues & Volume, By Others, 2022 - 2032F |
6.2 Croatia Shoe Polish Market, By Product |
6.2.1 Overview and Analysis |
6.2.2 Croatia Shoe Polish Market Revenues & Volume, By Shoe Shine Oil, 2022 - 2032F |
6.2.3 Croatia Shoe Polish Market Revenues & Volume, By Shoe Leather Nourishing Cream, 2022 - 2032F |
6.2.4 Croatia Shoe Polish Market Revenues & Volume, By Shoe Leather Softener, 2022 - 2032F |
6.2.5 Croatia Shoe Polish Market Revenues & Volume, By Others, 2022 - 2032F |
6.3 Croatia Shoe Polish Market, By Application |
6.3.1 Overview and Analysis |
6.3.2 Croatia Shoe Polish Market Revenues & Volume, By Household, 2022 - 2032F |
6.3.3 Croatia Shoe Polish Market Revenues & Volume, By Commercial, 2022 - 2032F |
6.4 Croatia Shoe Polish Market, By Location |
6.4.1 Overview and Analysis |
6.4.2 Croatia Shoe Polish Market Revenues & Volume, By Urban, 2022 - 2032F |
6.4.3 Croatia Shoe Polish Market Revenues & Volume, By Rural, 2022 - 2032F |
6.5 Croatia Shoe Polish Market, By Distribution Channel |
6.5.1 Overview and Analysis |
6.5.2 Croatia Shoe Polish Market Revenues & Volume, By Supermarkets/Hypermarkets, 2022 - 2032F |
6.5.3 Croatia Shoe Polish Market Revenues & Volume, By Convenience Stores, 2022 - 2032F |
6.5.4 Croatia Shoe Polish Market Revenues & Volume, By Footwear Showrooms/Specialty Stores, 2022 - 2032F |
6.5.5 Croatia Shoe Polish Market Revenues & Volume, By Online Retail, 2022 - 2032F |
6.5.6 Croatia Shoe Polish Market Revenues & Volume, By Others, 2022 - 2032F |
7 Croatia Shoe Polish Market Import-Export Trade Statistics |
7.1 Croatia Shoe Polish Market Export to Major Countries |
7.2 Croatia Shoe Polish Market Imports from Major Countries |
8 Croatia Shoe Polish Market Key Performance Indicators |
8.1 Number of shoe polish units sold per capita in Croatia. |
8.2 Percentage of households in Croatia using shoe polish products. |
8.3 Customer satisfaction and loyalty metrics for shoe polish brands in Croatia. |
8.4 Average price per unit of shoe polish in the Croatian market. |
8.5 Innovation rate in the shoe polish market in Croatia. |
9 Croatia Shoe Polish Market - Opportunity Assessment |
9.1 Croatia Shoe Polish Market Opportunity Assessment, By Type, 2022 & 2032F |
9.2 Croatia Shoe Polish Market Opportunity Assessment, By Product, 2022 & 2032F |
9.3 Croatia Shoe Polish Market Opportunity Assessment, By Application, 2022 & 2032F |
9.4 Croatia Shoe Polish Market Opportunity Assessment, By Location, 2022 & 2032F |
9.5 Croatia Shoe Polish Market Opportunity Assessment, By Distribution Channel, 2022 & 2032F |
10 Croatia Shoe Polish Market - Competitive Landscape |
10.1 Croatia Shoe Polish Market Revenue Share, By Companies, 2025 |
10.2 Croatia Shoe Polish Market Competitive Benchmarking, By Operating and Technical Parameters |
11 Company Profiles |
12 Recommendations | 13 Disclaimer |
Global Go To Market Strategy - 2030
Export potential enables firms to identify high-growth global markets with greater confidence by combining advanced trade intelligence with a structured quantitative methodology. The framework analyzes emerging demand trends and country-level import patterns while integrating macroeconomic and trade datasets such as GDP and population forecasts, bilateral import–export flows, tariff structures, elasticity differentials between developed and developing economies, geographic distance, and import demand projections. Using weighted trade values from 2020–2024 as the base period to project country-to-country export potential for 2030, these inputs are operationalized through calculated drivers such as gravity model parameters, tariff impact factors, and projected GDP per-capita growth. Through an analysis of hidden potentials, demand hotspots, and market conditions that are most favorable to success, this method enables firms to focus on target countries, maximize returns, and global expansion with data, backed by accuracy.
By factoring in the projected importer demand gap that is currently unmet and could be potential opportunity, it identifies the potential for the Exporter (Country) among 190 countries, against the general trade analysis, which identifies the biggest importer or exporter.
To discover high-growth global markets and optimize your business strategy:
Click Here
Pricing
- Single User License$ 1,995
- Department License$ 2,400
- Site License$ 3,120
- Global License$ 3,795

Leadership Perspectives from Industry Events
Search
Thought Leadership and Analyst Meet


Our Clients
6WResearch In News
- India Export Attractiveness Tracker 2026
- India Air Conditioner Market Set for Strong Rebound in 2026 After Weather-Led Correction and GST-Driven Recovery: 6Wresearch
- ADAS in India: How Automatic Emergency Braking, Blind Spot Detection & Driver Monitoring are Transforming Road Safety
- Doha a strategic location for EV manufacturing hub: IPA Qatar
- Demand for luxury TVs surging in the GCC, says Samsung
- Empowering Growth: The Thriving Journey of Bangladesh’s Cable Industry
Latest Reports
- Nicaragua RPG Gaming Market (2026-2032)
- New Zealand RPG Gaming Market (2026-2032)
- Netherlands RPG Gaming Market (2026-2032)
- Nauru RPG Gaming Market (2026-2032)
- Namibia RPG Gaming Market (2026-2032)
- Mozambique RPG Gaming Market (2026-2032)
- Montenegro RPG Gaming Market (2026-2032)
- Mongolia RPG Gaming Market (2026-2032)
- Monaco RPG Gaming Market (2026-2032)
- Micronesia RPG Gaming Market (2026-2032)
Industry Events and Analyst Meet

EV India Expo 2026

HIMTEX 2026

India Refining Summit 2026

India EV Show 2026

EV tech India Expo 2026
Whitepaper
- Middle East & Africa Commercial Security Market Click here to view more.
- Middle East & Africa Fire Safety Systems & Equipment Market Click here to view more.
- GCC Drone Market Click here to view more.
- Middle East Lighting Fixture Market Click here to view more.
- GCC Physical & Perimeter Security Market Click here to view more.