Croatia Soy Flour Market (2026-2032) | Segmentation, Growth, Analysis, Share, Outlook, Forecast, Companies, Size, Value, Industry, Trends & Revenue
Market Forecast By Type (Full-fat Soy Flour, Defatted Soy Flour), By Application (Bakery & Confectionery, Meat Substitute, Soup & Sausages, Meat and Poultry, Others), By Distribution Channel (Online Stores, Convenience Store, Departmental Store, Direct Sales, Others) And Competitive Landscape
| Product Code: ETC5021969 | Publication Date: Nov 2023 | Updated Date: Apr 2026 | Product Type: Market Research Report | |
| Publisher: 6Wresearch | Author: Shubham Padhi | No. of Pages: 60 | No. of Figures: 30 | No. of Tables: 5 |
Croatia Soy Flour Market Size (2020-2030)
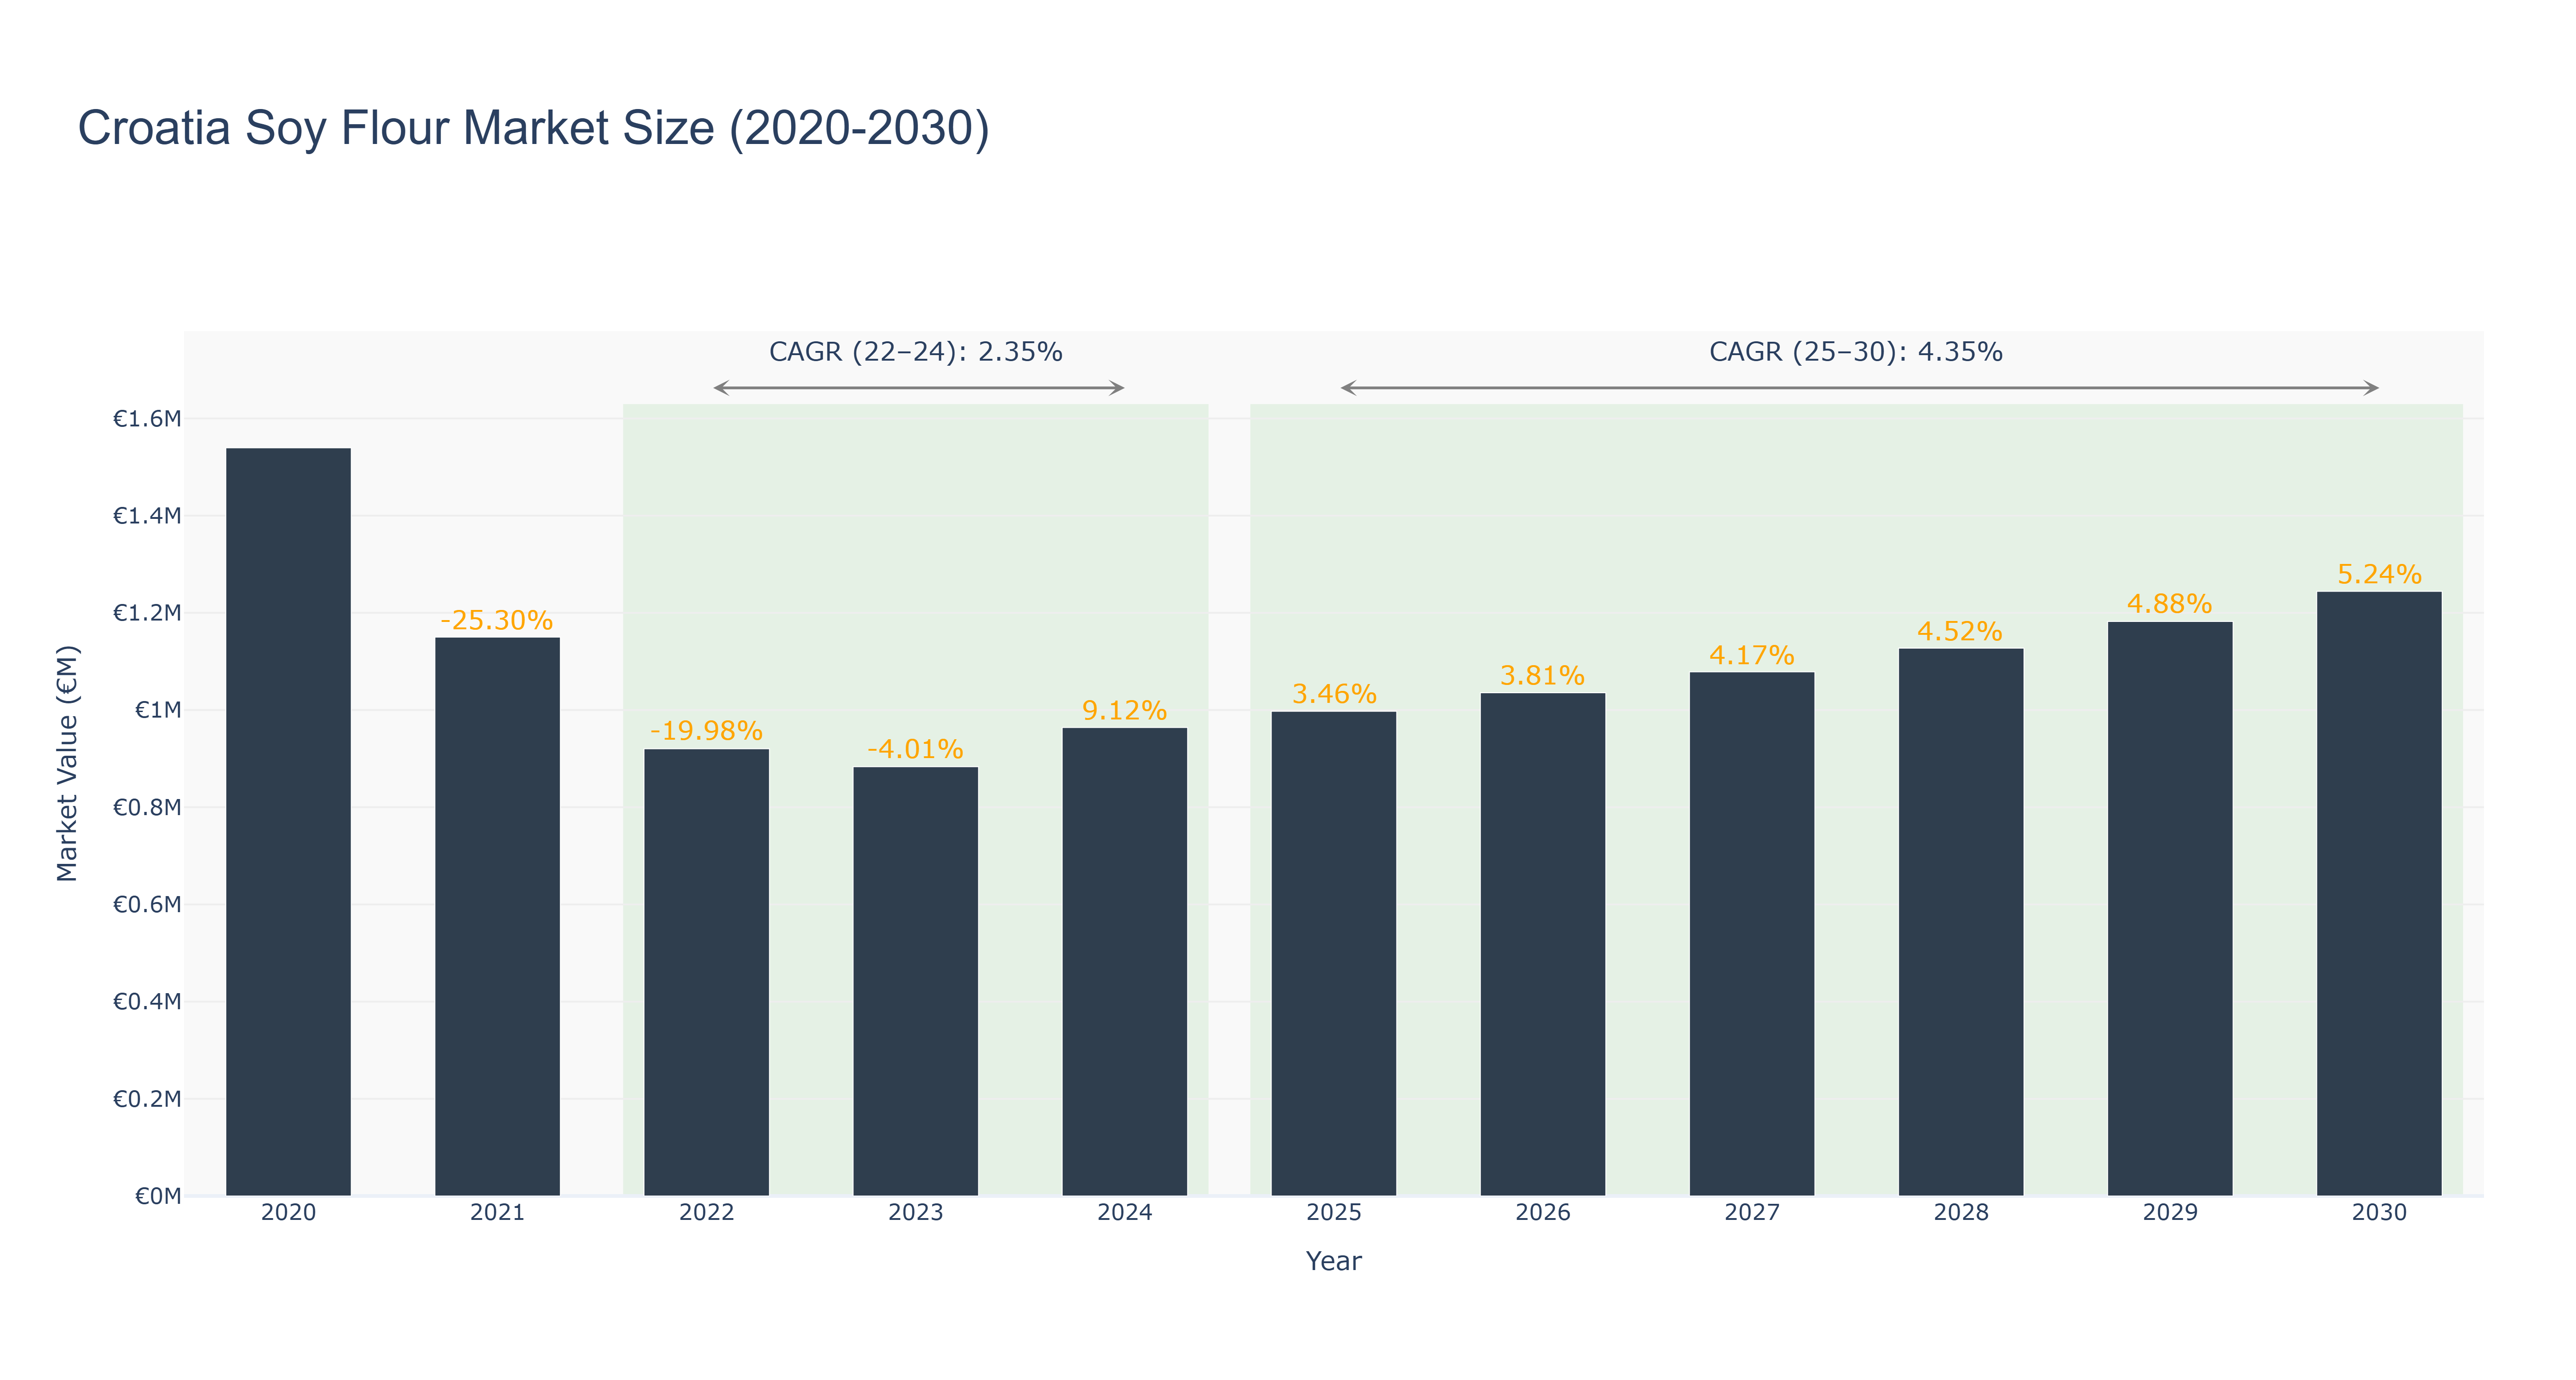
The Croatia Soy Flour Market experienced its peak size in 2020, reaching €1.54 million, followed by a decline to €920.36 thousand in 2022, reflecting a notable contraction with a CAGR of -25.30% from 2021 to 2022. This downward trend continued, albeit at a slowing pace, culminating in a slight recovery in 2024, where the market is projected to reach €964.03 thousand, resulting in a modest CAGR of 2.35% for the actual period from 2022 to 2024. Looking ahead, the forecasted period from 2025 to 2030 exhibits a more optimistic trajectory, driven by increasing health consciousness and a rising demand for plant-based alternatives, with a projected CAGR of 4.35% culminating in a market size of €1.24 million by 2030. Industry developments, such as enhanced production techniques and potential regulatory support for plant-based products, are likely to further bolster growth in this sector.
Croatia Soy Flour Market: Production & Trade Performance (2019-2025)
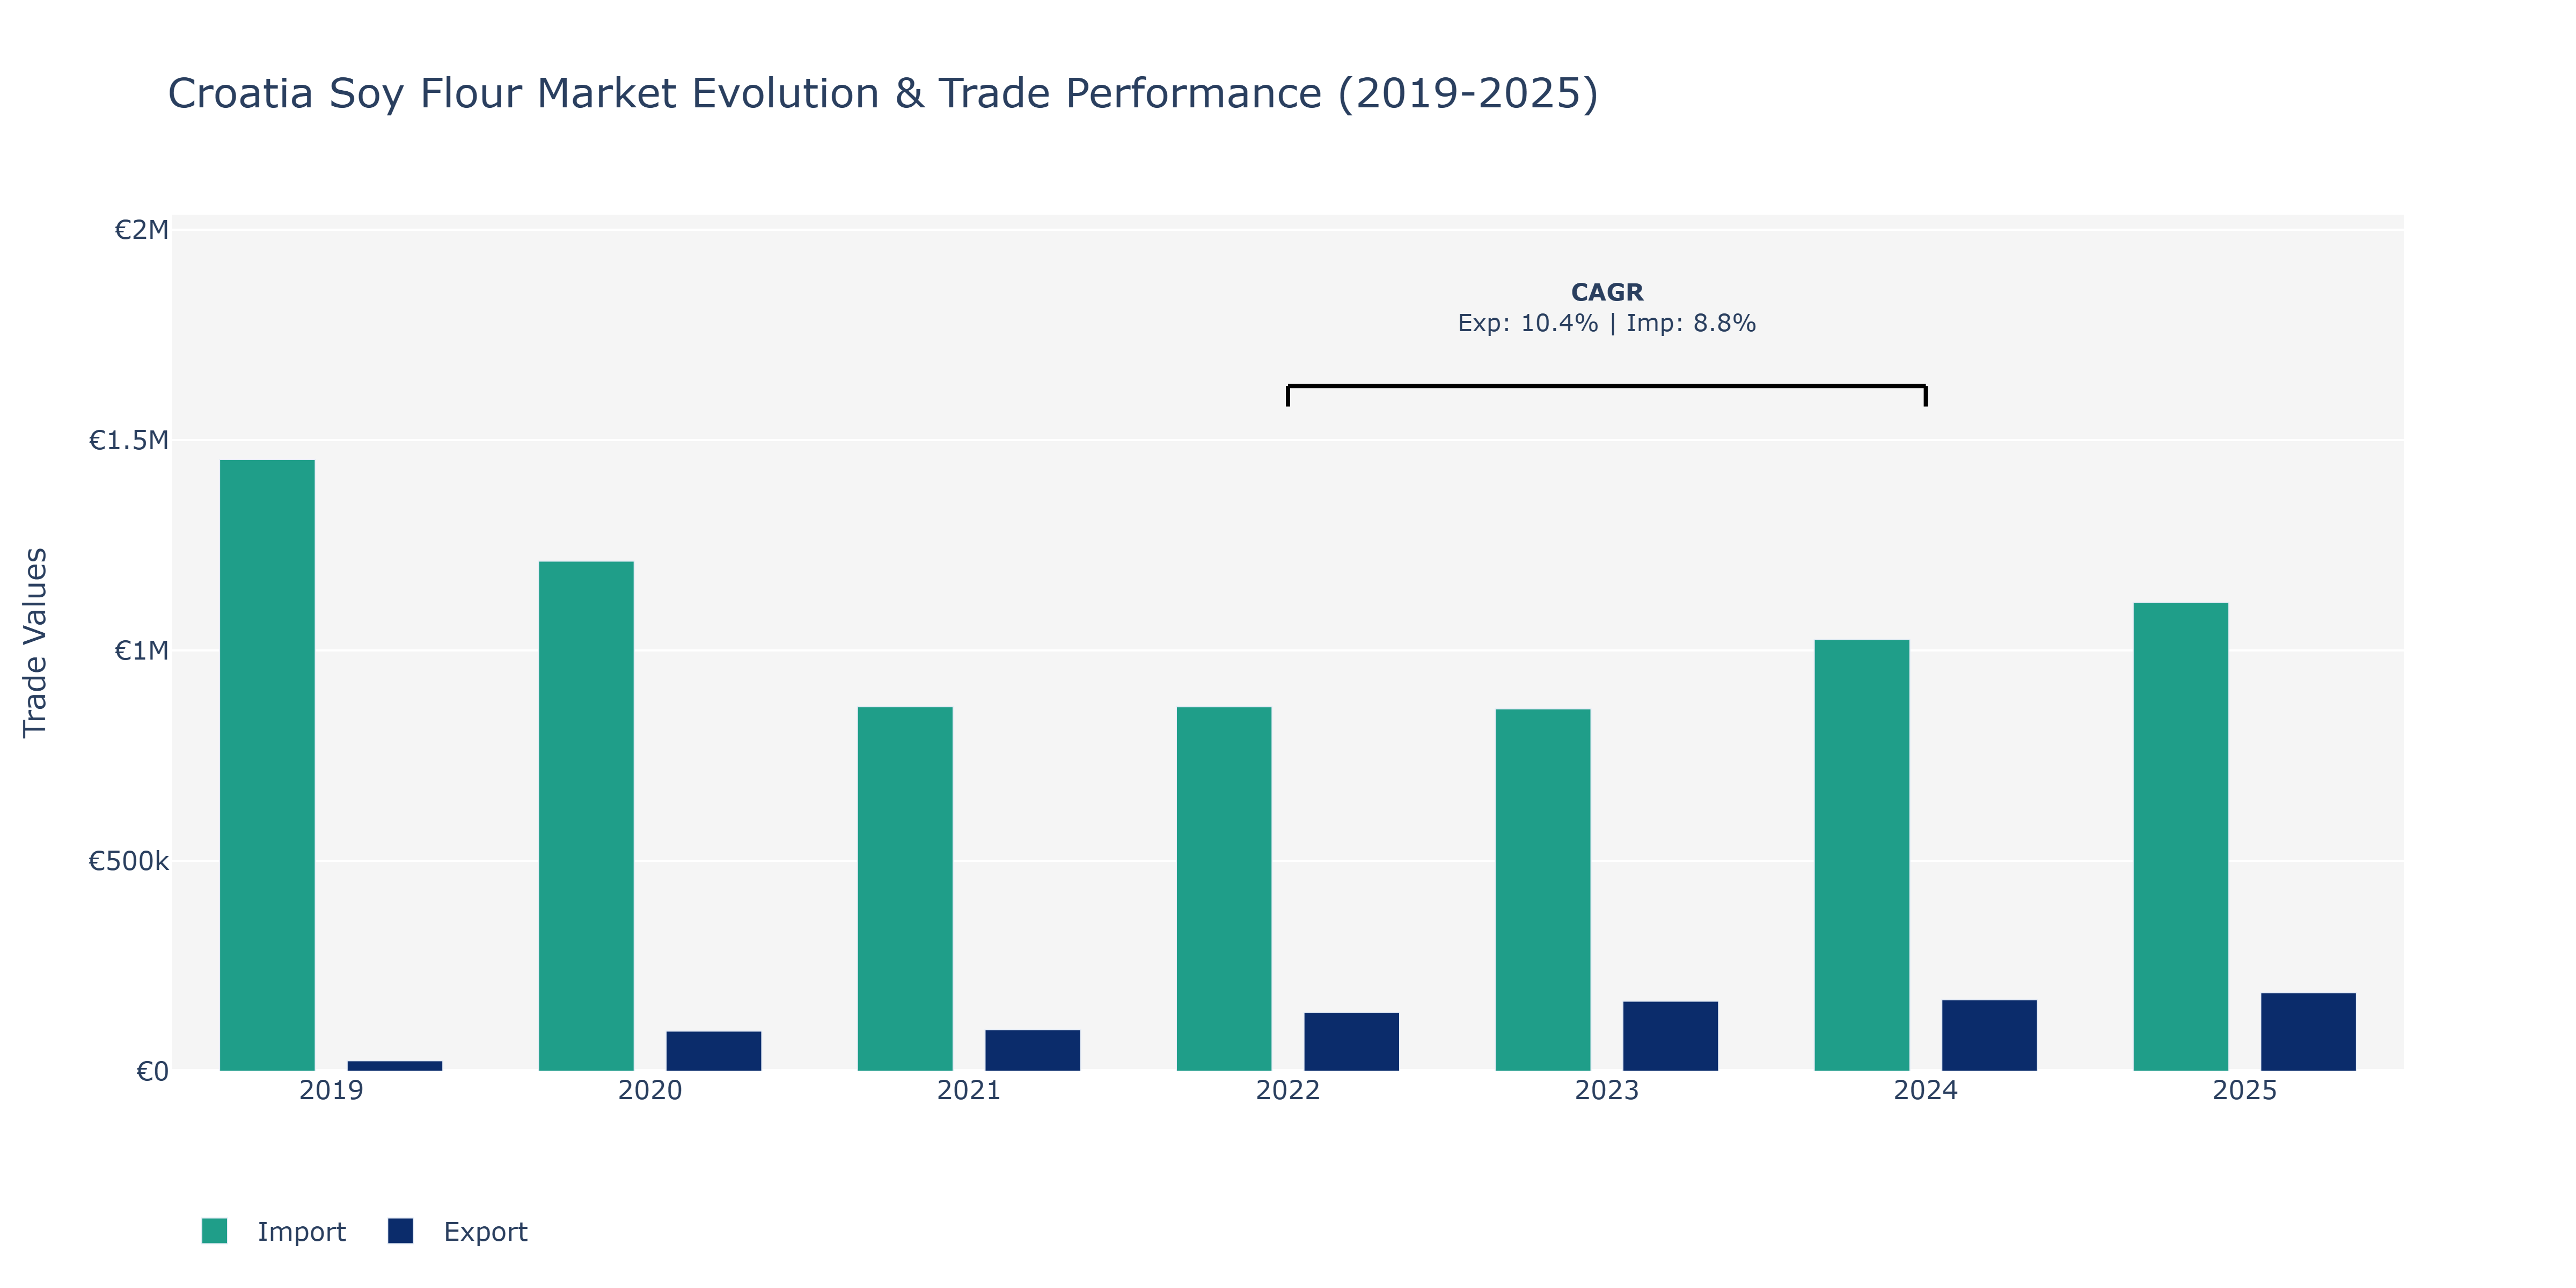
In the Croatia Soy Flour Market, exports have shown a consistent upward trajectory from 2019 to 2025, with a notable peak in 2025 at approximately €186.48 thousand. The growth in exports can be attributed to increasing global demand for soy-based products due to their perceived health benefits and versatility in various food applications. Conversely, imports experienced fluctuations during the same period, reaching a peak in 2024 at around €1.03 million before decreasing slightly in 2025. The fluctuations in imports could be influenced by changing domestic consumption patterns, currency exchange rates affecting import costs, and variations in international soy prices. The CAGR for exports between 2022 and 2024 was 10.43%, indicating a strong growth trend supported by factors such as expanding export markets and improved production efficiencies. For imports, the CAGR of 8.84% suggests a steady increase in demand driven by factors like evolving consumer preferences and trade agreements benefiting soy flour imports. To sustain export growth, market players could focus on product innovation, quality assurance, and strategic partnerships to access new markets. Similarly, importers may benefit from monitoring market trends, optimizing supply chains, and negotiating favorable trade terms to manage costs effectively.
Key Highlights of the Report:
- Croatia Soy Flour Market Outlook
- Market Size of Croatia Soy Flour Market, 2025
- Forecast of Croatia Soy Flour Market, 2032
- Historical Data and Forecast of Croatia Soy Flour Revenues & Volume for the Period 2022 - 2032F
- Croatia Soy Flour Market Trend Evolution
- Croatia Soy Flour Market Drivers and Challenges
- Croatia Soy Flour Price Trends
- Croatia Soy Flour Porter`s Five Forces
- Croatia Soy Flour Industry Life Cycle
- Historical Data and Forecast of Croatia Soy Flour Market Revenues & Volume By Type for the Period 2022 - 2032F
- Historical Data and Forecast of Croatia Soy Flour Market Revenues & Volume By Full-fat Soy Flour for the Period 2022 - 2032F
- Historical Data and Forecast of Croatia Soy Flour Market Revenues & Volume By Defatted Soy Flour for the Period 2022 - 2032F
- Historical Data and Forecast of Croatia Soy Flour Market Revenues & Volume By Application for the Period 2022 - 2032F
- Historical Data and Forecast of Croatia Soy Flour Market Revenues & Volume By Bakery & Confectionery for the Period 2022 - 2032F
- Historical Data and Forecast of Croatia Soy Flour Market Revenues & Volume By Meat Substitute for the Period 2022 - 2032F
- Historical Data and Forecast of Croatia Soy Flour Market Revenues & Volume By Soup & Sausages for the Period 2022 - 2032F
- Historical Data and Forecast of Croatia Soy Flour Market Revenues & Volume By Meat and Poultry for the Period 2022 - 2032F
- Historical Data and Forecast of Croatia Soy Flour Market Revenues & Volume By Others for the Period 2022 - 2032F
- Historical Data and Forecast of Croatia Soy Flour Market Revenues & Volume By Distribution Channel for the Period 2022 - 2032F
- Historical Data and Forecast of Croatia Soy Flour Market Revenues & Volume By Online Stores for the Period 2022 - 2032F
- Historical Data and Forecast of Croatia Soy Flour Market Revenues & Volume By Convenience Store for the Period 2022 - 2032F
- Historical Data and Forecast of Croatia Soy Flour Market Revenues & Volume By Departmental Store for the Period 2022 - 2032F
- Historical Data and Forecast of Croatia Soy Flour Market Revenues & Volume By Direct Sales for the Period 2022 - 2032F
- Historical Data and Forecast of Croatia Soy Flour Market Revenues & Volume By Others for the Period 2022 - 2032F
- Croatia Soy Flour Import Export Trade Statistics
- Market Opportunity Assessment By Type
- Market Opportunity Assessment By Application
- Market Opportunity Assessment By Distribution Channel
- Croatia Soy Flour Top Companies Market Share
- Croatia Soy Flour Competitive Benchmarking By Technical and Operational Parameters
- Croatia Soy Flour Company Profiles
- Croatia Soy Flour Key Strategic Recommendations
Frequently Asked Questions About the Market Study (FAQs):
6Wresearch actively monitors the Croatia Soy Flour Market and publishes its comprehensive annual report, highlighting emerging trends, growth drivers, revenue analysis, and forecast outlook. Our insights help businesses to make data-backed strategic decisions with ongoing market dynamics. Our analysts track relevent industries related to the Croatia Soy Flour Market, allowing our clients with actionable intelligence and reliable forecasts tailored to emerging regional needs.
Yes, we provide customisation as per your requirements. To learn more, feel free to contact us on sales@6wresearch.com
1 Executive Summary |
2 Introduction |
2.1 Key Highlights of the Report |
2.2 Report Description |
2.3 Market Scope & Segmentation |
2.4 Research Methodology |
2.5 Assumptions |
3 Croatia Soy Flour Market Overview |
3.1 Croatia Country Macro Economic Indicators |
3.2 Croatia Soy Flour Market Revenues & Volume, 2022 & 2032F |
3.3 Croatia Soy Flour Market - Industry Life Cycle |
3.4 Croatia Soy Flour Market - Porter's Five Forces |
3.5 Croatia Soy Flour Market Revenues & Volume Share, By Type, 2022 & 2032F |
3.6 Croatia Soy Flour Market Revenues & Volume Share, By Application, 2022 & 2032F |
3.7 Croatia Soy Flour Market Revenues & Volume Share, By Distribution Channel, 2022 & 2032F |
4 Croatia Soy Flour Market Dynamics |
4.1 Impact Analysis |
4.2 Market Drivers |
4.2.1 Increasing consumer awareness about the health benefits of soy flour |
4.2.2 Growing demand for gluten-free and plant-based food products |
4.2.3 Rising trend of incorporating soy flour in various food applications |
4.3 Market Restraints |
4.3.1 Higher cost of soy flour compared to conventional flours |
4.3.2 Limited availability of soybeans for soy flour production in Croatia |
4.3.3 Lack of awareness about soy flour among consumers |
5 Croatia Soy Flour Market Trends |
6 Croatia Soy Flour Market Segmentations |
6.1 Croatia Soy Flour Market, By Type |
6.1.1 Overview and Analysis |
6.1.2 Croatia Soy Flour Market Revenues & Volume, By Full-fat Soy Flour, 2022 - 2032F |
6.1.3 Croatia Soy Flour Market Revenues & Volume, By Defatted Soy Flour, 2022 - 2032F |
6.2 Croatia Soy Flour Market, By Application |
6.2.1 Overview and Analysis |
6.2.2 Croatia Soy Flour Market Revenues & Volume, By Bakery & Confectionery, 2022 - 2032F |
6.2.3 Croatia Soy Flour Market Revenues & Volume, By Meat Substitute, 2022 - 2032F |
6.2.4 Croatia Soy Flour Market Revenues & Volume, By Soup & Sausages, 2022 - 2032F |
6.2.5 Croatia Soy Flour Market Revenues & Volume, By Meat and Poultry, 2022 - 2032F |
6.2.6 Croatia Soy Flour Market Revenues & Volume, By Others, 2022 - 2032F |
6.3 Croatia Soy Flour Market, By Distribution Channel |
6.3.1 Overview and Analysis |
6.3.2 Croatia Soy Flour Market Revenues & Volume, By Online Stores, 2022 - 2032F |
6.3.3 Croatia Soy Flour Market Revenues & Volume, By Convenience Store, 2022 - 2032F |
6.3.4 Croatia Soy Flour Market Revenues & Volume, By Departmental Store, 2022 - 2032F |
6.3.5 Croatia Soy Flour Market Revenues & Volume, By Direct Sales, 2022 - 2032F |
6.3.6 Croatia Soy Flour Market Revenues & Volume, By Others, 2022 - 2032F |
7 Croatia Soy Flour Market Import-Export Trade Statistics |
7.1 Croatia Soy Flour Market Export to Major Countries |
7.2 Croatia Soy Flour Market Imports from Major Countries |
8 Croatia Soy Flour Market Key Performance Indicators |
8.1 Percentage increase in the number of new product launches containing soy flour |
8.2 Growth in the number of retail outlets offering soy flour products |
8.3 Expansion of soy flour processing facilities in Croatia |
9 Croatia Soy Flour Market - Opportunity Assessment |
9.1 Croatia Soy Flour Market Opportunity Assessment, By Type, 2022 & 2032F |
9.2 Croatia Soy Flour Market Opportunity Assessment, By Application, 2022 & 2032F |
9.3 Croatia Soy Flour Market Opportunity Assessment, By Distribution Channel, 2022 & 2032F |
10 Croatia Soy Flour Market - Competitive Landscape |
10.1 Croatia Soy Flour Market Revenue Share, By Companies, 2025 |
10.2 Croatia Soy Flour Market Competitive Benchmarking, By Operating and Technical Parameters |
11 Company Profiles |
12 Recommendations | 13 Disclaimer |
Global Go To Market Strategy - 2030
Export potential enables firms to identify high-growth global markets with greater confidence by combining advanced trade intelligence with a structured quantitative methodology. The framework analyzes emerging demand trends and country-level import patterns while integrating macroeconomic and trade datasets such as GDP and population forecasts, bilateral import–export flows, tariff structures, elasticity differentials between developed and developing economies, geographic distance, and import demand projections. Using weighted trade values from 2020–2024 as the base period to project country-to-country export potential for 2030, these inputs are operationalized through calculated drivers such as gravity model parameters, tariff impact factors, and projected GDP per-capita growth. Through an analysis of hidden potentials, demand hotspots, and market conditions that are most favorable to success, this method enables firms to focus on target countries, maximize returns, and global expansion with data, backed by accuracy.
By factoring in the projected importer demand gap that is currently unmet and could be potential opportunity, it identifies the potential for the Exporter (Country) among 190 countries, against the general trade analysis, which identifies the biggest importer or exporter.
To discover high-growth global markets and optimize your business strategy:
Click Here
Pricing
- Single User License$ 1,995
- Department License$ 2,400
- Site License$ 3,120
- Global License$ 3,795

Leadership Perspectives from Industry Events
Search
Thought Leadership and Analyst Meet


Our Clients
6WResearch In News
- India Export Attractiveness Tracker 2026
- India Air Conditioner Market Set for Strong Rebound in 2026 After Weather-Led Correction and GST-Driven Recovery: 6Wresearch
- ADAS in India: How Automatic Emergency Braking, Blind Spot Detection & Driver Monitoring are Transforming Road Safety
- Doha a strategic location for EV manufacturing hub: IPA Qatar
- Demand for luxury TVs surging in the GCC, says Samsung
- Empowering Growth: The Thriving Journey of Bangladesh’s Cable Industry
Latest Reports
- Nicaragua RPG Gaming Market (2026-2032)
- New Zealand RPG Gaming Market (2026-2032)
- Netherlands RPG Gaming Market (2026-2032)
- Nauru RPG Gaming Market (2026-2032)
- Namibia RPG Gaming Market (2026-2032)
- Mozambique RPG Gaming Market (2026-2032)
- Montenegro RPG Gaming Market (2026-2032)
- Mongolia RPG Gaming Market (2026-2032)
- Monaco RPG Gaming Market (2026-2032)
- Micronesia RPG Gaming Market (2026-2032)
Industry Events and Analyst Meet

EV India Expo 2026

HIMTEX 2026

India Refining Summit 2026

India EV Show 2026

EV tech India Expo 2026
Whitepaper
- Middle East & Africa Commercial Security Market Click here to view more.
- Middle East & Africa Fire Safety Systems & Equipment Market Click here to view more.
- GCC Drone Market Click here to view more.
- Middle East Lighting Fixture Market Click here to view more.
- GCC Physical & Perimeter Security Market Click here to view more.