Croatia Talcum Powder Market (2026-2032) | Value, Companies, Size, Share, Forecast, Growth, Trends, Analysis, Industry, Segmentation, Outlook & Revenue
Market Forecast By Type (Cosmetics Grade, Paper Grade, Waterproofing Grade, Coatings Grade, Plastic Grade, Others), By Application (Paints & Coatings, Plastic & Rubber, Personal Care, Others) And Competitive Landscape
| Product Code: ETC5324411 | Publication Date: Nov 2023 | Updated Date: Apr 2026 | Product Type: Market Research Report | |
| Publisher: 6Wresearch | Author: Ravi Bhandari | No. of Pages: 60 | No. of Figures: 30 | No. of Tables: 5 |
Croatia Talcum Powder Market Size (2020-2030)
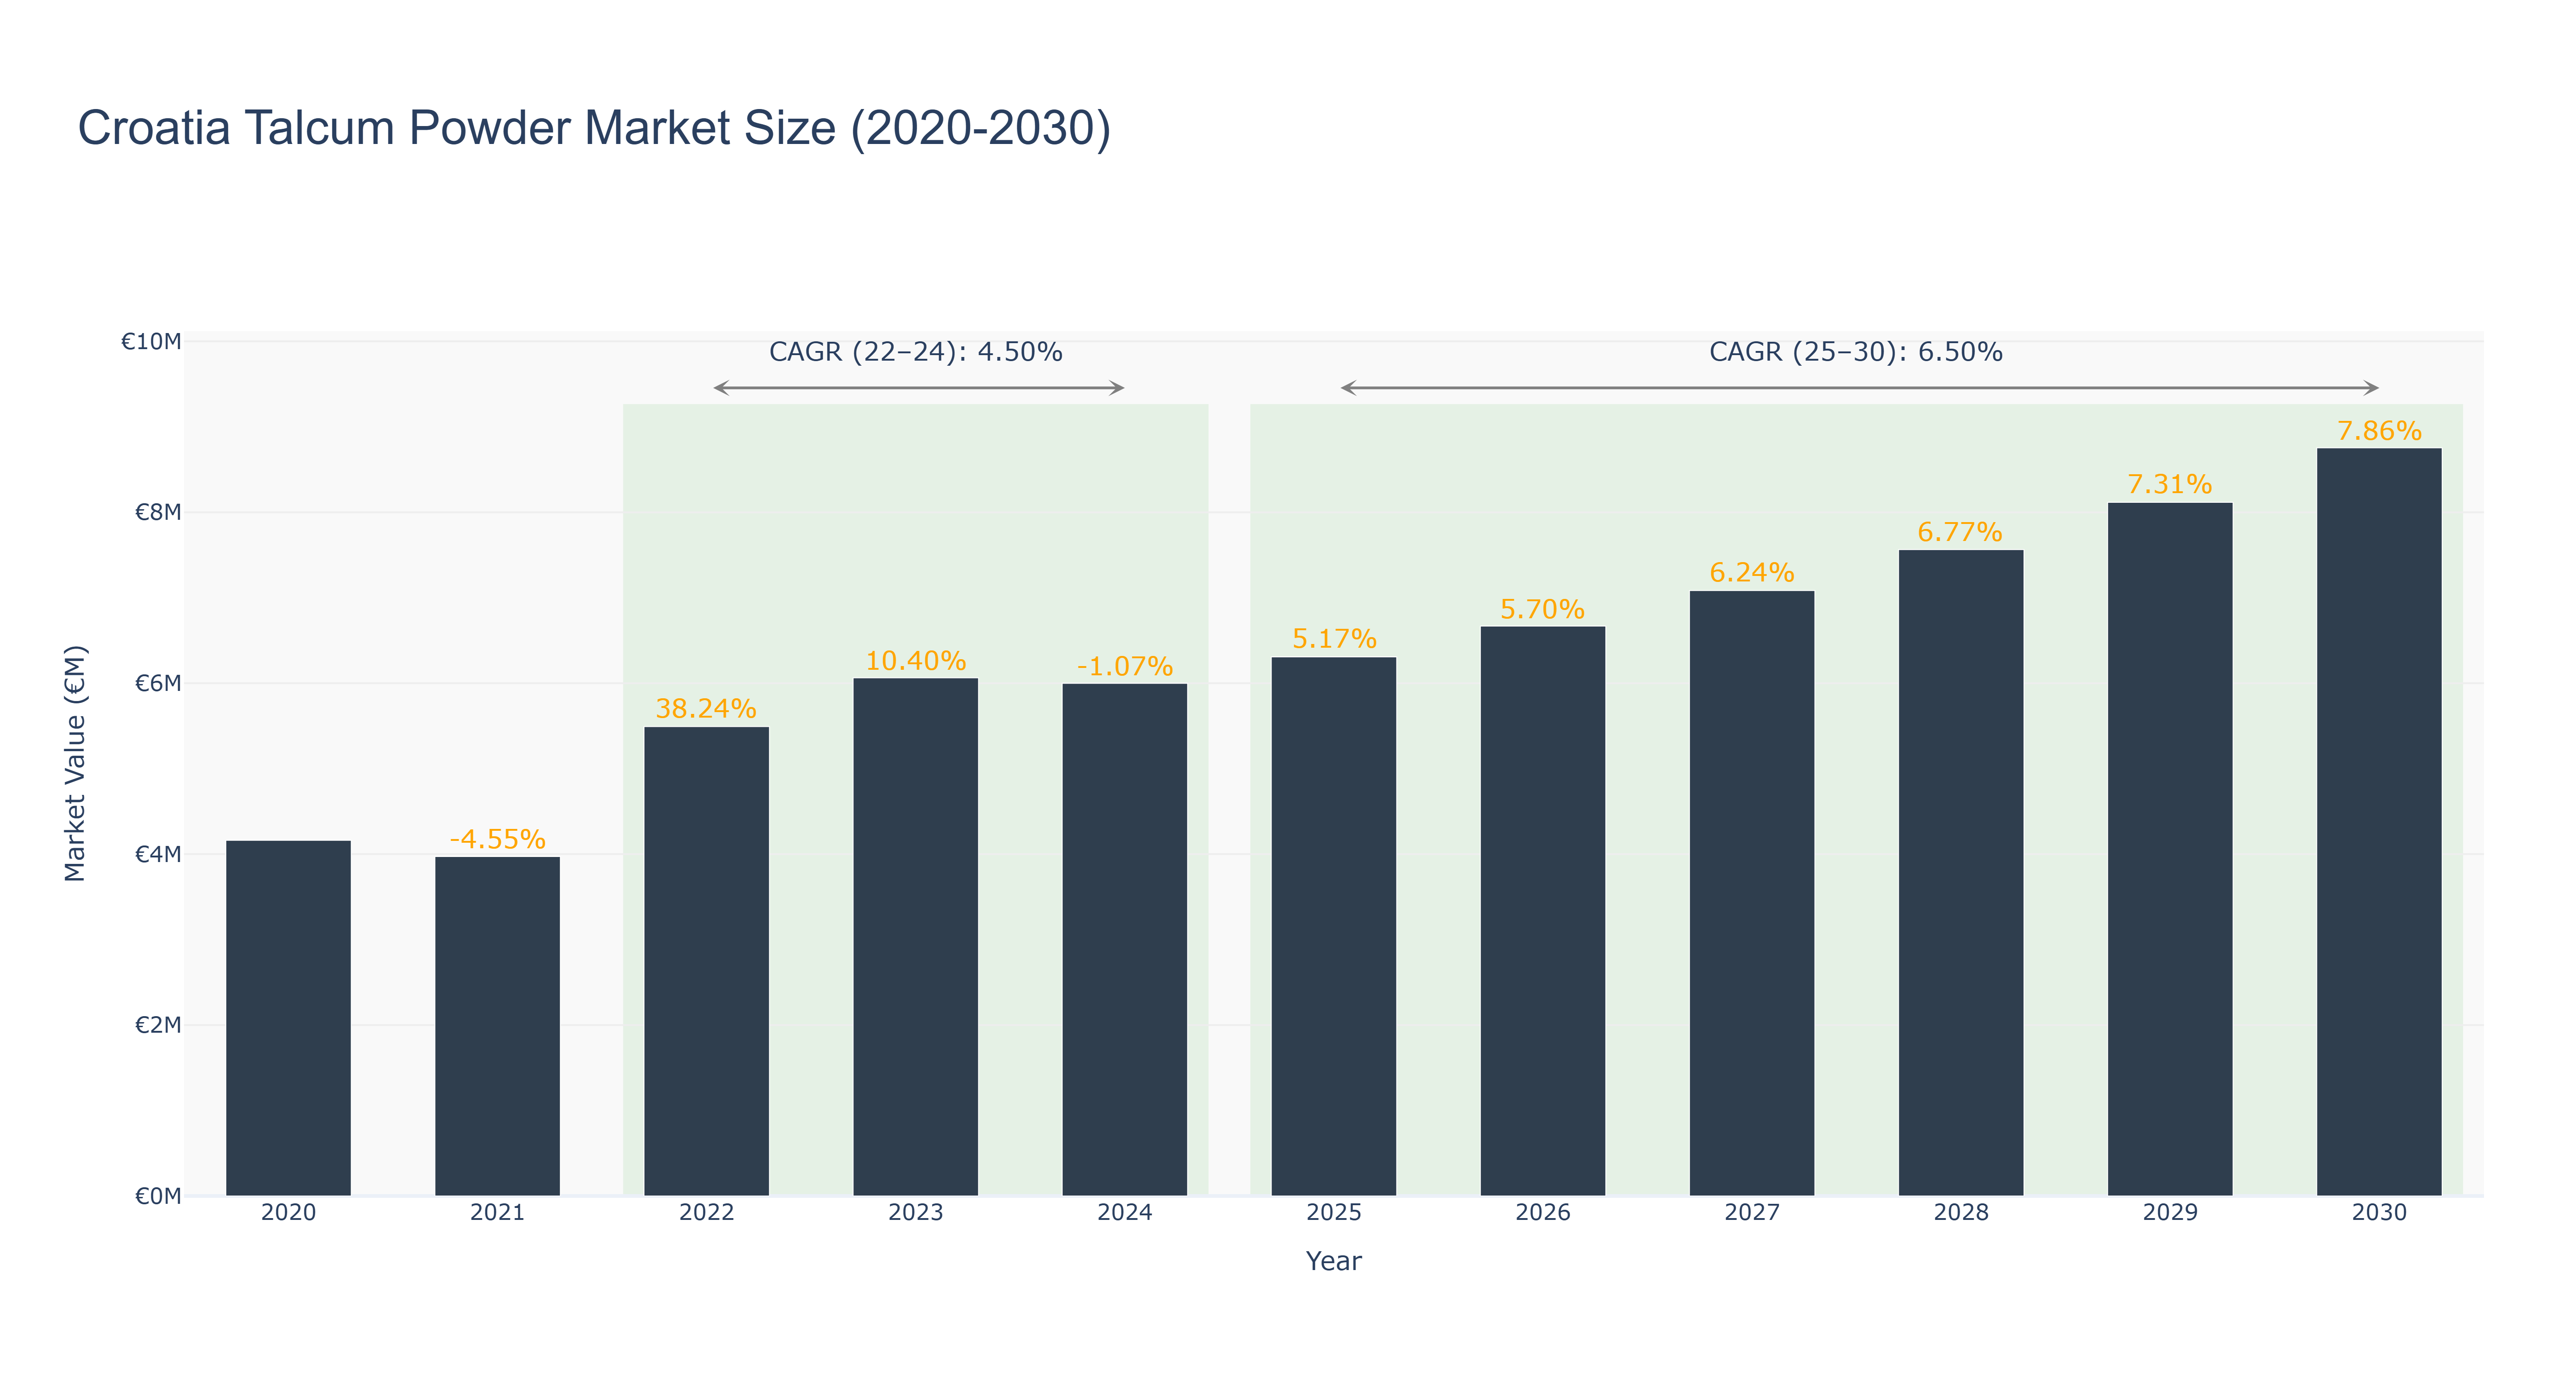
Croatia Talcum Powder Market witnessed a peak market size of €8.75 million in 2030, showcasing consistent growth over the years. From 2020 to 2024, the market size fluctuated, starting at €4.16 million in 2020, reaching a low of €3.97 million in 2021, and eventually recovering to €6.00 million in 2024. The forecasted market size from 2025 to 2030 is expected to continue the upward trend, with a Compound Annual Growth Rate (CAGR) of 6.50%. The market experienced a significant growth phase from 2022 to 2024 with a CAGR of 4.50%, attributed to increased consumer demand and product innovation. The subsequent CAGR of 6.50% from 2025 to 2030 is indicative of sustained market expansion driven by evolving consumer preferences and expanding distribution channels. Recent developments in sustainable packaging and product diversification are poised to further enhance market growth in the coming years.
Croatia Talcum Powder Market: Production & Trade Performance (2019-2025)
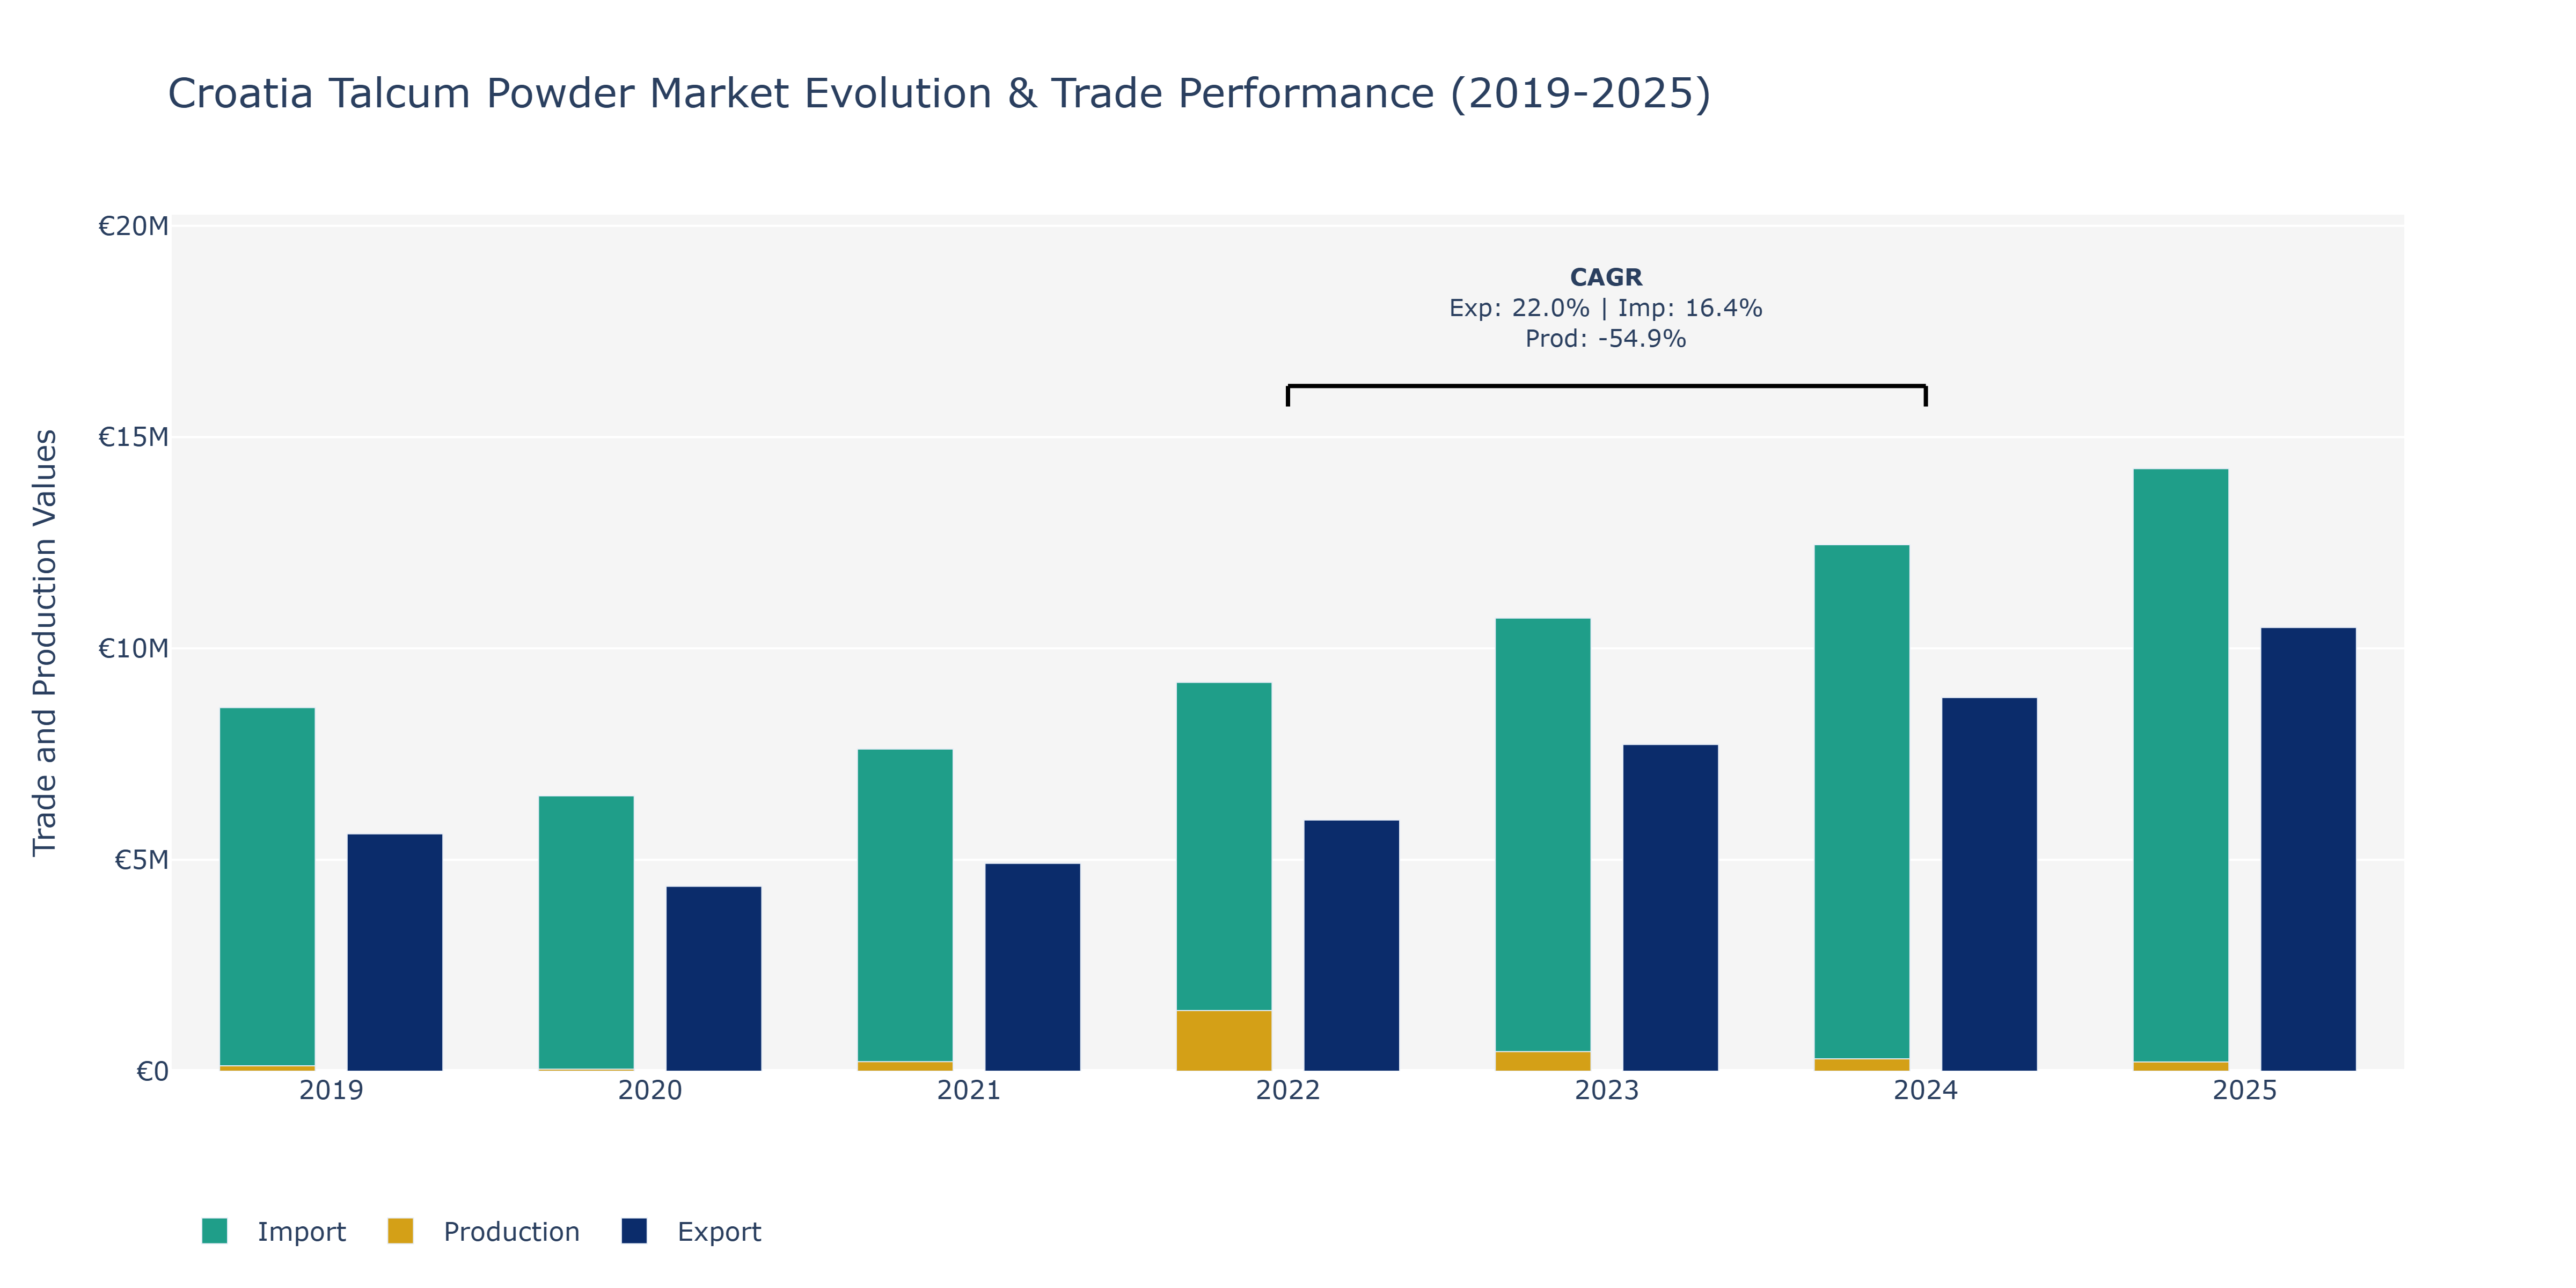
In the Croatia Talcum Powder Market, exports experienced fluctuations from 2019 to 2025, with a peak in 2025 at approximately €10.5 million. Conversely, imports also showed variability, reaching a peak in 2025 at around €14.25 million. Production, however, witnessed a significant decline from €1.43 billion in 2022 to approximately €219.5 million in 2025. The sharp decrease in production can be attributed to various factors such as changes in consumer preferences towards natural or organic products, stricter regulations on talcum powder manufacturing, and increased competition from alternative products in the market. Despite the decrease in production, the rise in exports and imports may indicate Croatia's strong position in the global talcum powder industry, potentially driven by strategic partnerships with international markets and effective marketing initiatives to enhance product demand and competitiveness.
Key Highlights of the Report:
- Croatia Talcum Powder Market Outlook
- Market Size of Croatia Talcum Powder Market, 2025
- Forecast of Croatia Talcum Powder Market, 2032
- Historical Data and Forecast of Croatia Talcum Powder Revenues & Volume for the Period 2022 - 2032F
- Croatia Talcum Powder Market Trend Evolution
- Croatia Talcum Powder Market Drivers and Challenges
- Croatia Talcum Powder Price Trends
- Croatia Talcum Powder Porter`s Five Forces
- Croatia Talcum Powder Industry Life Cycle
- Historical Data and Forecast of Croatia Talcum Powder Market Revenues & Volume By Type for the Period 2022 - 2032F
- Historical Data and Forecast of Croatia Talcum Powder Market Revenues & Volume By Cosmetics Grade for the Period 2022 - 2032F
- Historical Data and Forecast of Croatia Talcum Powder Market Revenues & Volume By Paper Grade for the Period 2022 - 2032F
- Historical Data and Forecast of Croatia Talcum Powder Market Revenues & Volume By Waterproofing Grade for the Period 2022 - 2032F
- Historical Data and Forecast of Croatia Talcum Powder Market Revenues & Volume By Coatings Grade for the Period 2022 - 2032F
- Historical Data and Forecast of Croatia Talcum Powder Market Revenues & Volume By Plastic Grade for the Period 2022 - 2032F
- Historical Data and Forecast of Croatia Talcum Powder Market Revenues & Volume By Others for the Period 2022 - 2032F
- Historical Data and Forecast of Croatia Talcum Powder Market Revenues & Volume By Application for the Period 2022 - 2032F
- Historical Data and Forecast of Croatia Talcum Powder Market Revenues & Volume By Paints & Coatings for the Period 2022 - 2032F
- Historical Data and Forecast of Croatia Talcum Powder Market Revenues & Volume By Plastic & Rubber for the Period 2022 - 2032F
- Historical Data and Forecast of Croatia Talcum Powder Market Revenues & Volume By Personal Care for the Period 2022 - 2032F
- Historical Data and Forecast of Croatia Talcum Powder Market Revenues & Volume By Others for the Period 2022 - 2032F
- Croatia Talcum Powder Import Export Trade Statistics
- Market Opportunity Assessment By Type
- Market Opportunity Assessment By Application
- Croatia Talcum Powder Top Companies Market Share
- Croatia Talcum Powder Competitive Benchmarking By Technical and Operational Parameters
- Croatia Talcum Powder Company Profiles
- Croatia Talcum Powder Key Strategic Recommendations
Frequently Asked Questions About the Market Study (FAQs):
6Wresearch actively monitors the Croatia Talcum Powder Market and publishes its comprehensive annual report, highlighting emerging trends, growth drivers, revenue analysis, and forecast outlook. Our insights help businesses to make data-backed strategic decisions with ongoing market dynamics. Our analysts track relevent industries related to the Croatia Talcum Powder Market, allowing our clients with actionable intelligence and reliable forecasts tailored to emerging regional needs.
Yes, we provide customisation as per your requirements. To learn more, feel free to contact us on sales@6wresearch.com
1 Executive Summary |
2 Introduction |
2.1 Key Highlights of the Report |
2.2 Report Description |
2.3 Market Scope & Segmentation |
2.4 Research Methodology |
2.5 Assumptions |
3 Croatia Talcum Powder Market Overview |
3.1 Croatia Country Macro Economic Indicators |
3.2 Croatia Talcum Powder Market Revenues & Volume, 2022 & 2032F |
3.3 Croatia Talcum Powder Market - Industry Life Cycle |
3.4 Croatia Talcum Powder Market - Porter's Five Forces |
3.5 Croatia Talcum Powder Market Revenues & Volume Share, By Type, 2022 & 2032F |
3.6 Croatia Talcum Powder Market Revenues & Volume Share, By Application, 2022 & 2032F |
4 Croatia Talcum Powder Market Dynamics |
4.1 Impact Analysis |
4.2 Market Drivers |
4.2.1 Increasing awareness about personal hygiene and grooming among the population in Croatia |
4.2.2 Growing disposable income leading to higher spending on personal care products |
4.2.3 Rising demand for talcum powder in the cosmetic industry due to its various applications |
4.3 Market Restraints |
4.3.1 Concerns over the safety of talcum powder and its potential health risks |
4.3.2 Competition from alternative products such as cornstarch-based powders |
4.3.3 Regulatory restrictions on certain ingredients used in talcum powder formulations |
5 Croatia Talcum Powder Market Trends |
6 Croatia Talcum Powder Market Segmentations |
6.1 Croatia Talcum Powder Market, By Type |
6.1.1 Overview and Analysis |
6.1.2 Croatia Talcum Powder Market Revenues & Volume, By Cosmetics Grade, 2022 - 2032F |
6.1.3 Croatia Talcum Powder Market Revenues & Volume, By Paper Grade, 2022 - 2032F |
6.1.4 Croatia Talcum Powder Market Revenues & Volume, By Waterproofing Grade, 2022 - 2032F |
6.1.5 Croatia Talcum Powder Market Revenues & Volume, By Coatings Grade, 2022 - 2032F |
6.1.6 Croatia Talcum Powder Market Revenues & Volume, By Plastic Grade, 2022 - 2032F |
6.1.7 Croatia Talcum Powder Market Revenues & Volume, By Others, 2022 - 2032F |
6.2 Croatia Talcum Powder Market, By Application |
6.2.1 Overview and Analysis |
6.2.2 Croatia Talcum Powder Market Revenues & Volume, By Paints & Coatings, 2022 - 2032F |
6.2.3 Croatia Talcum Powder Market Revenues & Volume, By Plastic & Rubber, 2022 - 2032F |
6.2.4 Croatia Talcum Powder Market Revenues & Volume, By Personal Care, 2022 - 2032F |
6.2.5 Croatia Talcum Powder Market Revenues & Volume, By Others, 2022 - 2032F |
7 Croatia Talcum Powder Market Import-Export Trade Statistics |
7.1 Croatia Talcum Powder Market Export to Major Countries |
7.2 Croatia Talcum Powder Market Imports from Major Countries |
8 Croatia Talcum Powder Market Key Performance Indicators |
8.1 Consumer satisfaction and loyalty scores based on surveys and feedback |
8.2 Market penetration rate in different age groups and regions within Croatia |
8.3 Number of new product innovations and launches in the talcum powder market in Croatia |
8.4 Social media engagement and online presence metrics for talcum powder brands in Croatia |
8.5 Environmental sustainability practices adopted by talcum powder manufacturers in Croatia |
9 Croatia Talcum Powder Market - Opportunity Assessment |
9.1 Croatia Talcum Powder Market Opportunity Assessment, By Type, 2022 & 2032F |
9.2 Croatia Talcum Powder Market Opportunity Assessment, By Application, 2022 & 2032F |
10 Croatia Talcum Powder Market - Competitive Landscape |
10.1 Croatia Talcum Powder Market Revenue Share, By Companies, 2025 |
10.2 Croatia Talcum Powder Market Competitive Benchmarking, By Operating and Technical Parameters |
11 Company Profiles |
12 Recommendations | 13 Disclaimer |
Global Go To Market Strategy - 2030
Export potential enables firms to identify high-growth global markets with greater confidence by combining advanced trade intelligence with a structured quantitative methodology. The framework analyzes emerging demand trends and country-level import patterns while integrating macroeconomic and trade datasets such as GDP and population forecasts, bilateral import–export flows, tariff structures, elasticity differentials between developed and developing economies, geographic distance, and import demand projections. Using weighted trade values from 2020–2024 as the base period to project country-to-country export potential for 2030, these inputs are operationalized through calculated drivers such as gravity model parameters, tariff impact factors, and projected GDP per-capita growth. Through an analysis of hidden potentials, demand hotspots, and market conditions that are most favorable to success, this method enables firms to focus on target countries, maximize returns, and global expansion with data, backed by accuracy.
By factoring in the projected importer demand gap that is currently unmet and could be potential opportunity, it identifies the potential for the Exporter (Country) among 190 countries, against the general trade analysis, which identifies the biggest importer or exporter.
To discover high-growth global markets and optimize your business strategy:
Click Here
Pricing
- Single User License$ 1,995
- Department License$ 2,400
- Site License$ 3,120
- Global License$ 3,795

Leadership Perspectives from Industry Events
Search
Thought Leadership and Analyst Meet


Our Clients
6WResearch In News
- India Export Attractiveness Tracker 2026
- India Air Conditioner Market Set for Strong Rebound in 2026 After Weather-Led Correction and GST-Driven Recovery: 6Wresearch
- ADAS in India: How Automatic Emergency Braking, Blind Spot Detection & Driver Monitoring are Transforming Road Safety
- Doha a strategic location for EV manufacturing hub: IPA Qatar
- Demand for luxury TVs surging in the GCC, says Samsung
- Empowering Growth: The Thriving Journey of Bangladesh’s Cable Industry
Latest Reports
- Nicaragua RPG Gaming Market (2026-2032)
- New Zealand RPG Gaming Market (2026-2032)
- Netherlands RPG Gaming Market (2026-2032)
- Nauru RPG Gaming Market (2026-2032)
- Namibia RPG Gaming Market (2026-2032)
- Mozambique RPG Gaming Market (2026-2032)
- Montenegro RPG Gaming Market (2026-2032)
- Mongolia RPG Gaming Market (2026-2032)
- Monaco RPG Gaming Market (2026-2032)
- Micronesia RPG Gaming Market (2026-2032)
Industry Events and Analyst Meet

EV India Expo 2026

HIMTEX 2026

India Refining Summit 2026

India EV Show 2026

EV tech India Expo 2026
Whitepaper
- Middle East & Africa Commercial Security Market Click here to view more.
- Middle East & Africa Fire Safety Systems & Equipment Market Click here to view more.
- GCC Drone Market Click here to view more.
- Middle East Lighting Fixture Market Click here to view more.
- GCC Physical & Perimeter Security Market Click here to view more.