Croatia Twine Market (2026-2032) | Forecast, Value, Outlook, Segmentation, Size, Share, Growth, Industry, Analysis, Companies, Revenue & Trends
Market Forecast By Type (Polyethylene Rope Twine, Metal Rope Twine, Other), By Applications (Industrial, Construction, Oil, Coal mine, Other) And Competitive Landscape
| Product Code: ETC5821546 | Publication Date: Nov 2023 | Updated Date: Apr 2026 | Product Type: Market Research Report | |
| Publisher: 6Wresearch | Author: Ravi Bhandari | No. of Pages: 60 | No. of Figures: 30 | No. of Tables: 5 |
Croatia Twine Market Size (2020-2030)
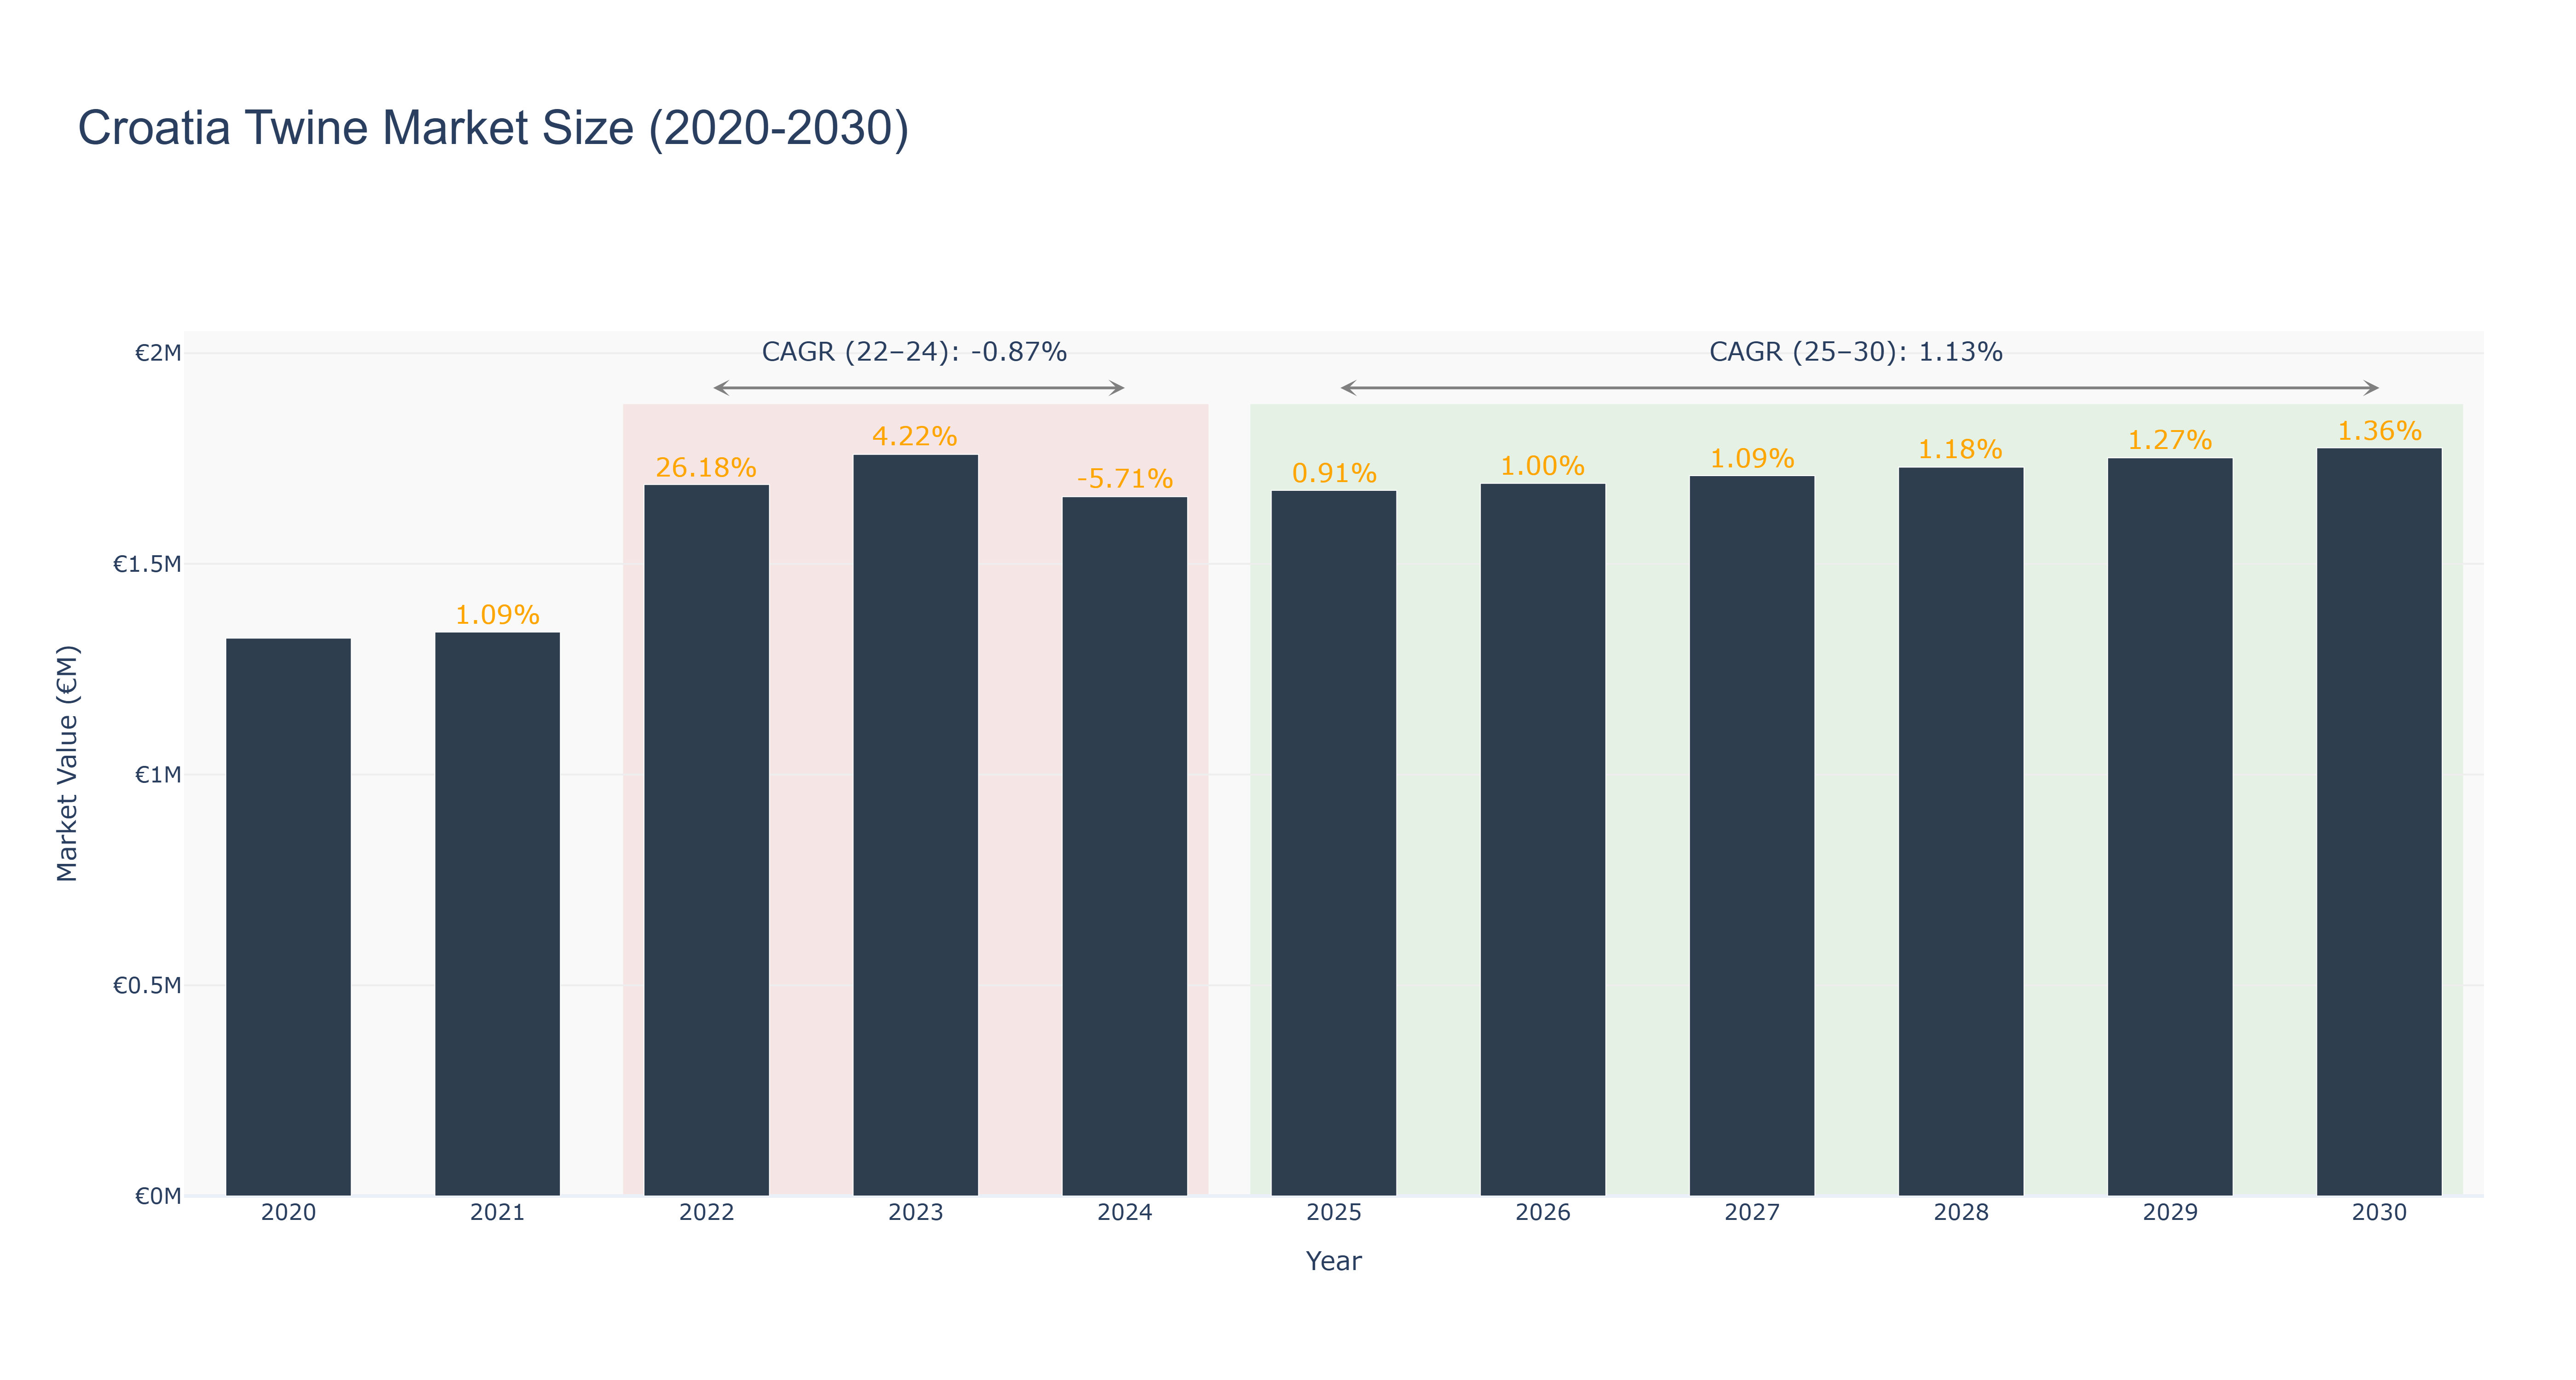
Croatia Twine Market has shown a mix of fluctuations in market size over the years. The market peaked in 2030 with a size of €1.78 million, showcasing a steady growth trend. From 2020 to 2024, the market size ranged from €1.32 million to €1.66 million, experiencing a slight decline in 2024 due to a negative growth rate. However, from 2025 to 2030, the market is forecasted to grow steadily, with a Compound Annual Growth Rate (CAGR) of 1.13%. The recent improvements in production processes and increased demand for eco-friendly twine products are driving the industry forward. Looking ahead, Croatia is set to implement sustainable packaging initiatives in the twine sector, aligning with the global push towards environmental conservation and responsible manufacturing practices.
Croatia Twine Market: Production & Trade Performance (2019-2025)
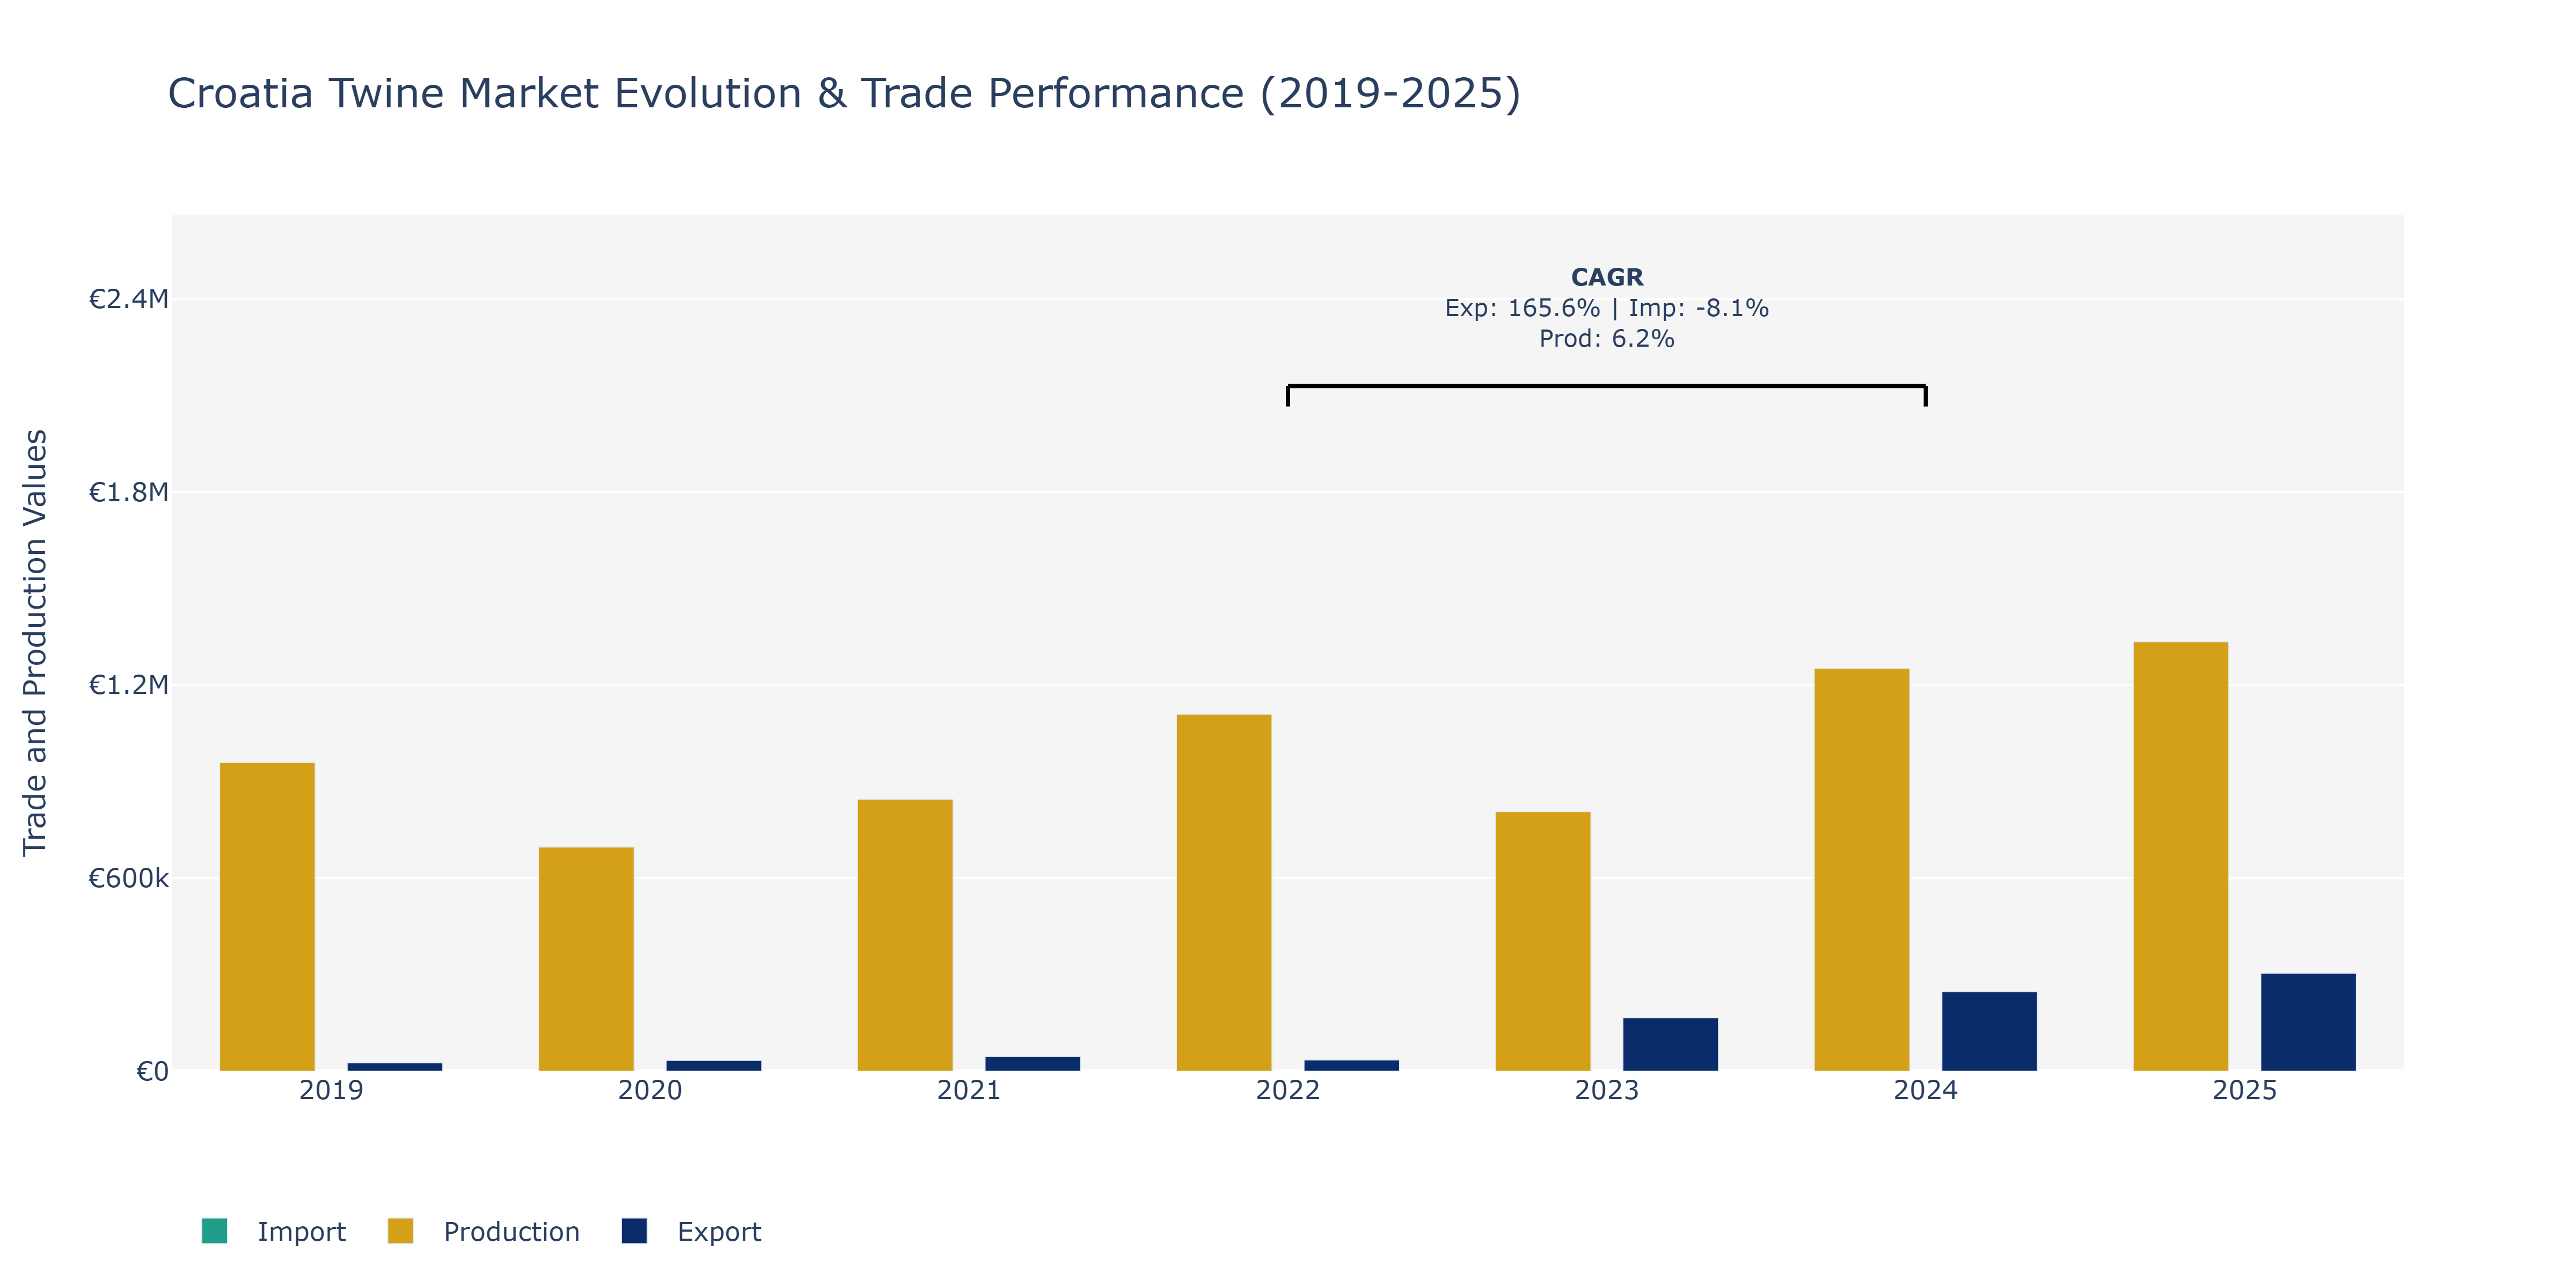
In the Croatia Twine Market, exports experienced notable fluctuations over the years, starting at €26.37 thousand in 2019, peaking at €304.33 thousand in 2025. This growth can be attributed to increased demand for Croatian twine products in international markets, potentially due to the country's reputation for high-quality production. Imports, on the other hand, saw a decline from €465.80 thousand in 2020 to €566.82 thousand in 2025, possibly influenced by shifts in global trade dynamics or changes in sourcing strategies. Production levels showed a steady increase from €696.79 thousand in 2020 to €1.33 million in 2025, reflecting the market's efforts to meet rising demand both domestically and abroad. The market's strong production CAGR of 6.25% from 2022 to 2024 indicates a positive growth trajectory supported by industry innovation and efficiency improvements.
Key Highlights of the Report:
- Croatia Twine Market Outlook
- Market Size of Croatia Twine Market, 2025
- Forecast of Croatia Twine Market, 2032
- Historical Data and Forecast of Croatia Twine Revenues & Volume for the Period 2022 - 2032F
- Croatia Twine Market Trend Evolution
- Croatia Twine Market Drivers and Challenges
- Croatia Twine Price Trends
- Croatia Twine Porter`s Five Forces
- Croatia Twine Industry Life Cycle
- Historical Data and Forecast of Croatia Twine Market Revenues & Volume By Type for the Period 2022 - 2032F
- Historical Data and Forecast of Croatia Twine Market Revenues & Volume By Polyethylene Rope Twine for the Period 2022 - 2032F
- Historical Data and Forecast of Croatia Twine Market Revenues & Volume By Metal Rope Twine for the Period 2022 - 2032F
- Historical Data and Forecast of Croatia Twine Market Revenues & Volume By Other for the Period 2022 - 2032F
- Historical Data and Forecast of Croatia Twine Market Revenues & Volume By Applications for the Period 2022 - 2032F
- Historical Data and Forecast of Croatia Twine Market Revenues & Volume By Industrial for the Period 2022 - 2032F
- Historical Data and Forecast of Croatia Twine Market Revenues & Volume By Construction for the Period 2022 - 2032F
- Historical Data and Forecast of Croatia Twine Market Revenues & Volume By Oil for the Period 2022 - 2032F
- Historical Data and Forecast of Croatia Twine Market Revenues & Volume By Coal mine for the Period 2022 - 2032F
- Historical Data and Forecast of Croatia Twine Market Revenues & Volume By Other for the Period 2022 - 2032F
- Croatia Twine Import Export Trade Statistics
- Market Opportunity Assessment By Type
- Market Opportunity Assessment By Applications
- Croatia Twine Top Companies Market Share
- Croatia Twine Competitive Benchmarking By Technical and Operational Parameters
- Croatia Twine Company Profiles
- Croatia Twine Key Strategic Recommendations
Frequently Asked Questions About the Market Study (FAQs):
6Wresearch actively monitors the Croatia Twine Market and publishes its comprehensive annual report, highlighting emerging trends, growth drivers, revenue analysis, and forecast outlook. Our insights help businesses to make data-backed strategic decisions with ongoing market dynamics. Our analysts track relevent industries related to the Croatia Twine Market, allowing our clients with actionable intelligence and reliable forecasts tailored to emerging regional needs.
Yes, we provide customisation as per your requirements. To learn more, feel free to contact us on sales@6wresearch.com
1 Executive Summary |
2 Introduction |
2.1 Key Highlights of the Report |
2.2 Report Description |
2.3 Market Scope & Segmentation |
2.4 Research Methodology |
2.5 Assumptions |
3 Croatia Twine Market Overview |
3.1 Croatia Country Macro Economic Indicators |
3.2 Croatia Twine Market Revenues & Volume, 2022 & 2032F |
3.3 Croatia Twine Market - Industry Life Cycle |
3.4 Croatia Twine Market - Porter's Five Forces |
3.5 Croatia Twine Market Revenues & Volume Share, By Type, 2022 & 2032F |
3.6 Croatia Twine Market Revenues & Volume Share, By Applications, 2022 & 2032F |
4 Croatia Twine Market Dynamics |
4.1 Impact Analysis |
4.2 Market Drivers |
4.2.1 Increasing demand for eco-friendly and sustainable packaging solutions |
4.2.2 Growth in the agriculture and horticulture industries in Croatia |
4.2.3 Rising awareness about the benefits of using twine in various applications |
4.3 Market Restraints |
4.3.1 Fluctuating prices of raw materials used in twine production |
4.3.2 Competition from alternative packaging materials |
4.3.3 Impact of economic conditions on consumer spending |
5 Croatia Twine Market Trends |
6 Croatia Twine Market Segmentations |
6.1 Croatia Twine Market, By Type |
6.1.1 Overview and Analysis |
6.1.2 Croatia Twine Market Revenues & Volume, By Polyethylene Rope Twine, 2022 - 2032F |
6.1.3 Croatia Twine Market Revenues & Volume, By Metal Rope Twine, 2022 - 2032F |
6.1.4 Croatia Twine Market Revenues & Volume, By Other, 2022 - 2032F |
6.2 Croatia Twine Market, By Applications |
6.2.1 Overview and Analysis |
6.2.2 Croatia Twine Market Revenues & Volume, By Industrial, 2022 - 2032F |
6.2.3 Croatia Twine Market Revenues & Volume, By Construction, 2022 - 2032F |
6.2.4 Croatia Twine Market Revenues & Volume, By Oil, 2022 - 2032F |
6.2.5 Croatia Twine Market Revenues & Volume, By Coal mine, 2022 - 2032F |
6.2.6 Croatia Twine Market Revenues & Volume, By Other, 2022 - 2032F |
7 Croatia Twine Market Import-Export Trade Statistics |
7.1 Croatia Twine Market Export to Major Countries |
7.2 Croatia Twine Market Imports from Major Countries |
8 Croatia Twine Market Key Performance Indicators |
8.1 Percentage increase in the adoption of eco-friendly packaging solutions in Croatia |
8.2 Growth rate of the agriculture and horticulture sectors in the country |
8.3 Number of awareness campaigns or educational programs conducted to promote the use of twine in different industries |
9 Croatia Twine Market - Opportunity Assessment |
9.1 Croatia Twine Market Opportunity Assessment, By Type, 2022 & 2032F |
9.2 Croatia Twine Market Opportunity Assessment, By Applications, 2022 & 2032F |
10 Croatia Twine Market - Competitive Landscape |
10.1 Croatia Twine Market Revenue Share, By Companies, 2025 |
10.2 Croatia Twine Market Competitive Benchmarking, By Operating and Technical Parameters |
11 Company Profiles |
12 Recommendations | 13 Disclaimer |
Global Go To Market Strategy - 2030
Export potential enables firms to identify high-growth global markets with greater confidence by combining advanced trade intelligence with a structured quantitative methodology. The framework analyzes emerging demand trends and country-level import patterns while integrating macroeconomic and trade datasets such as GDP and population forecasts, bilateral import–export flows, tariff structures, elasticity differentials between developed and developing economies, geographic distance, and import demand projections. Using weighted trade values from 2020–2024 as the base period to project country-to-country export potential for 2030, these inputs are operationalized through calculated drivers such as gravity model parameters, tariff impact factors, and projected GDP per-capita growth. Through an analysis of hidden potentials, demand hotspots, and market conditions that are most favorable to success, this method enables firms to focus on target countries, maximize returns, and global expansion with data, backed by accuracy.
By factoring in the projected importer demand gap that is currently unmet and could be potential opportunity, it identifies the potential for the Exporter (Country) among 190 countries, against the general trade analysis, which identifies the biggest importer or exporter.
To discover high-growth global markets and optimize your business strategy:
Click Here
Pricing
- Single User License$ 1,995
- Department License$ 2,400
- Site License$ 3,120
- Global License$ 3,795

Leadership Perspectives from Industry Events
Search
Thought Leadership and Analyst Meet


Our Clients
6WResearch In News
- India Export Attractiveness Tracker 2026
- India Air Conditioner Market Set for Strong Rebound in 2026 After Weather-Led Correction and GST-Driven Recovery: 6Wresearch
- ADAS in India: How Automatic Emergency Braking, Blind Spot Detection & Driver Monitoring are Transforming Road Safety
- Doha a strategic location for EV manufacturing hub: IPA Qatar
- Demand for luxury TVs surging in the GCC, says Samsung
- Empowering Growth: The Thriving Journey of Bangladesh’s Cable Industry
Latest Reports
- Nicaragua RPG Gaming Market (2026-2032)
- New Zealand RPG Gaming Market (2026-2032)
- Netherlands RPG Gaming Market (2026-2032)
- Nauru RPG Gaming Market (2026-2032)
- Namibia RPG Gaming Market (2026-2032)
- Mozambique RPG Gaming Market (2026-2032)
- Montenegro RPG Gaming Market (2026-2032)
- Mongolia RPG Gaming Market (2026-2032)
- Monaco RPG Gaming Market (2026-2032)
- Micronesia RPG Gaming Market (2026-2032)
Industry Events and Analyst Meet

EV India Expo 2026

HIMTEX 2026

India Refining Summit 2026

India EV Show 2026

EV tech India Expo 2026
Whitepaper
- Middle East & Africa Commercial Security Market Click here to view more.
- Middle East & Africa Fire Safety Systems & Equipment Market Click here to view more.
- GCC Drone Market Click here to view more.
- Middle East Lighting Fixture Market Click here to view more.
- GCC Physical & Perimeter Security Market Click here to view more.