Croatia Wire Mesh Market (2026-2032) | Value, Share, Analysis, Segmentation, Trends, Companies, Forecast, Growth, Industry, Revenue, Size & Outlook
Market Forecast By Types (Electro Galvanized Welded Wire Mesh, Hot Dipped Galvanized Welded Mesh, PVC Coated Welded Mesh, Welded Stainless Steel Mesh, Welded Wire Fencing Panels), By Applications (Construction, Agricultural, Industrial, Transportation, Horticultural, Food Procuring Sector, Others) And Competitive Landscape
| Product Code: ETC4654490 | Publication Date: Nov 2023 | Updated Date: Apr 2026 | Product Type: Market Research Report | |
| Publisher: 6Wresearch | Author: Shubham Padhi | No. of Pages: 60 | No. of Figures: 30 | No. of Tables: 5 |
Croatia Wire Mesh Market Size (2020-2030)
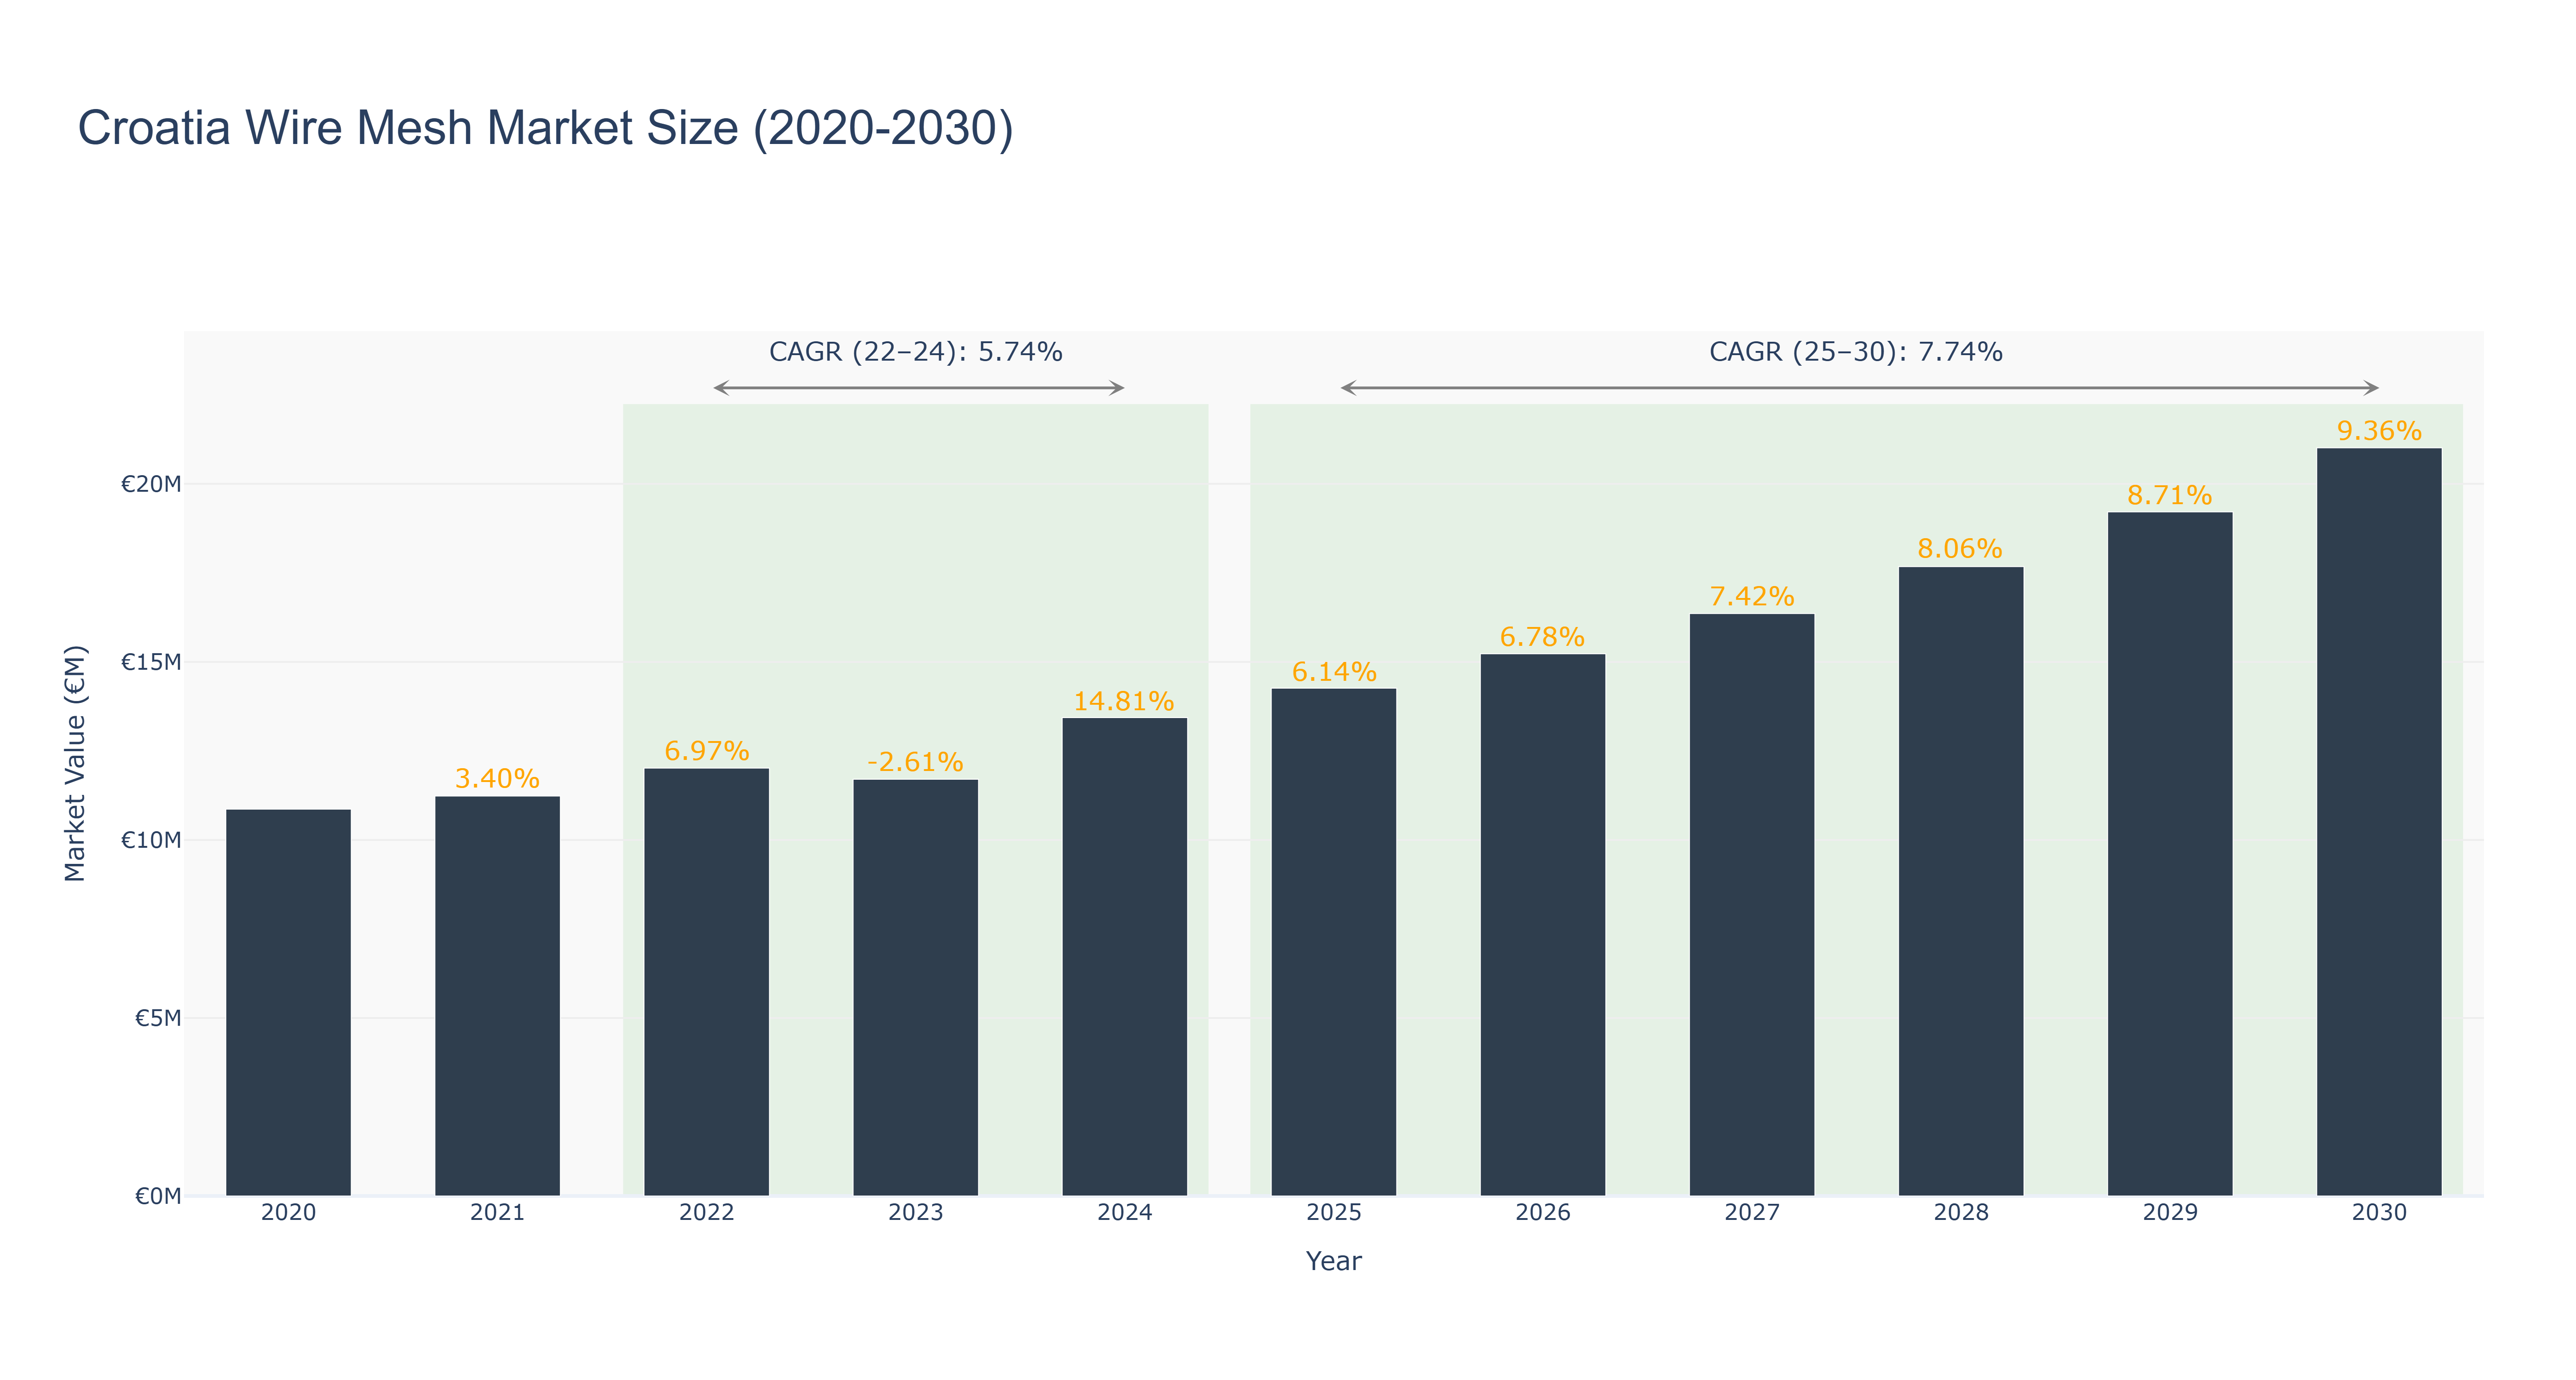
Croatia Wire Mesh Market has shown a steady growth trajectory over the years. The peak market size of €21.01 million is forecasted for 2030, with a notable increase in market size from €10.86 million in 2020 to €13.44 million in 2024. The market experienced a slight decline in 2023, attributed to economic fluctuations, but quickly recovered and continued its upward trend. The CAGR for the period 2022-24 stands at 5.74%, while the CAGR for 2025-30 is projected at 7.74%. Industry drivers fueling this growth include increasing infrastructure projects and rising demand for wire mesh in construction and industrial applications. Looking ahead, Croatia is set to embark on a national initiative to modernize its infrastructure, which is expected to further boost the wire mesh market in the coming years.
Croatia Wire Mesh Market: Production & Trade Performance (2019-2025)
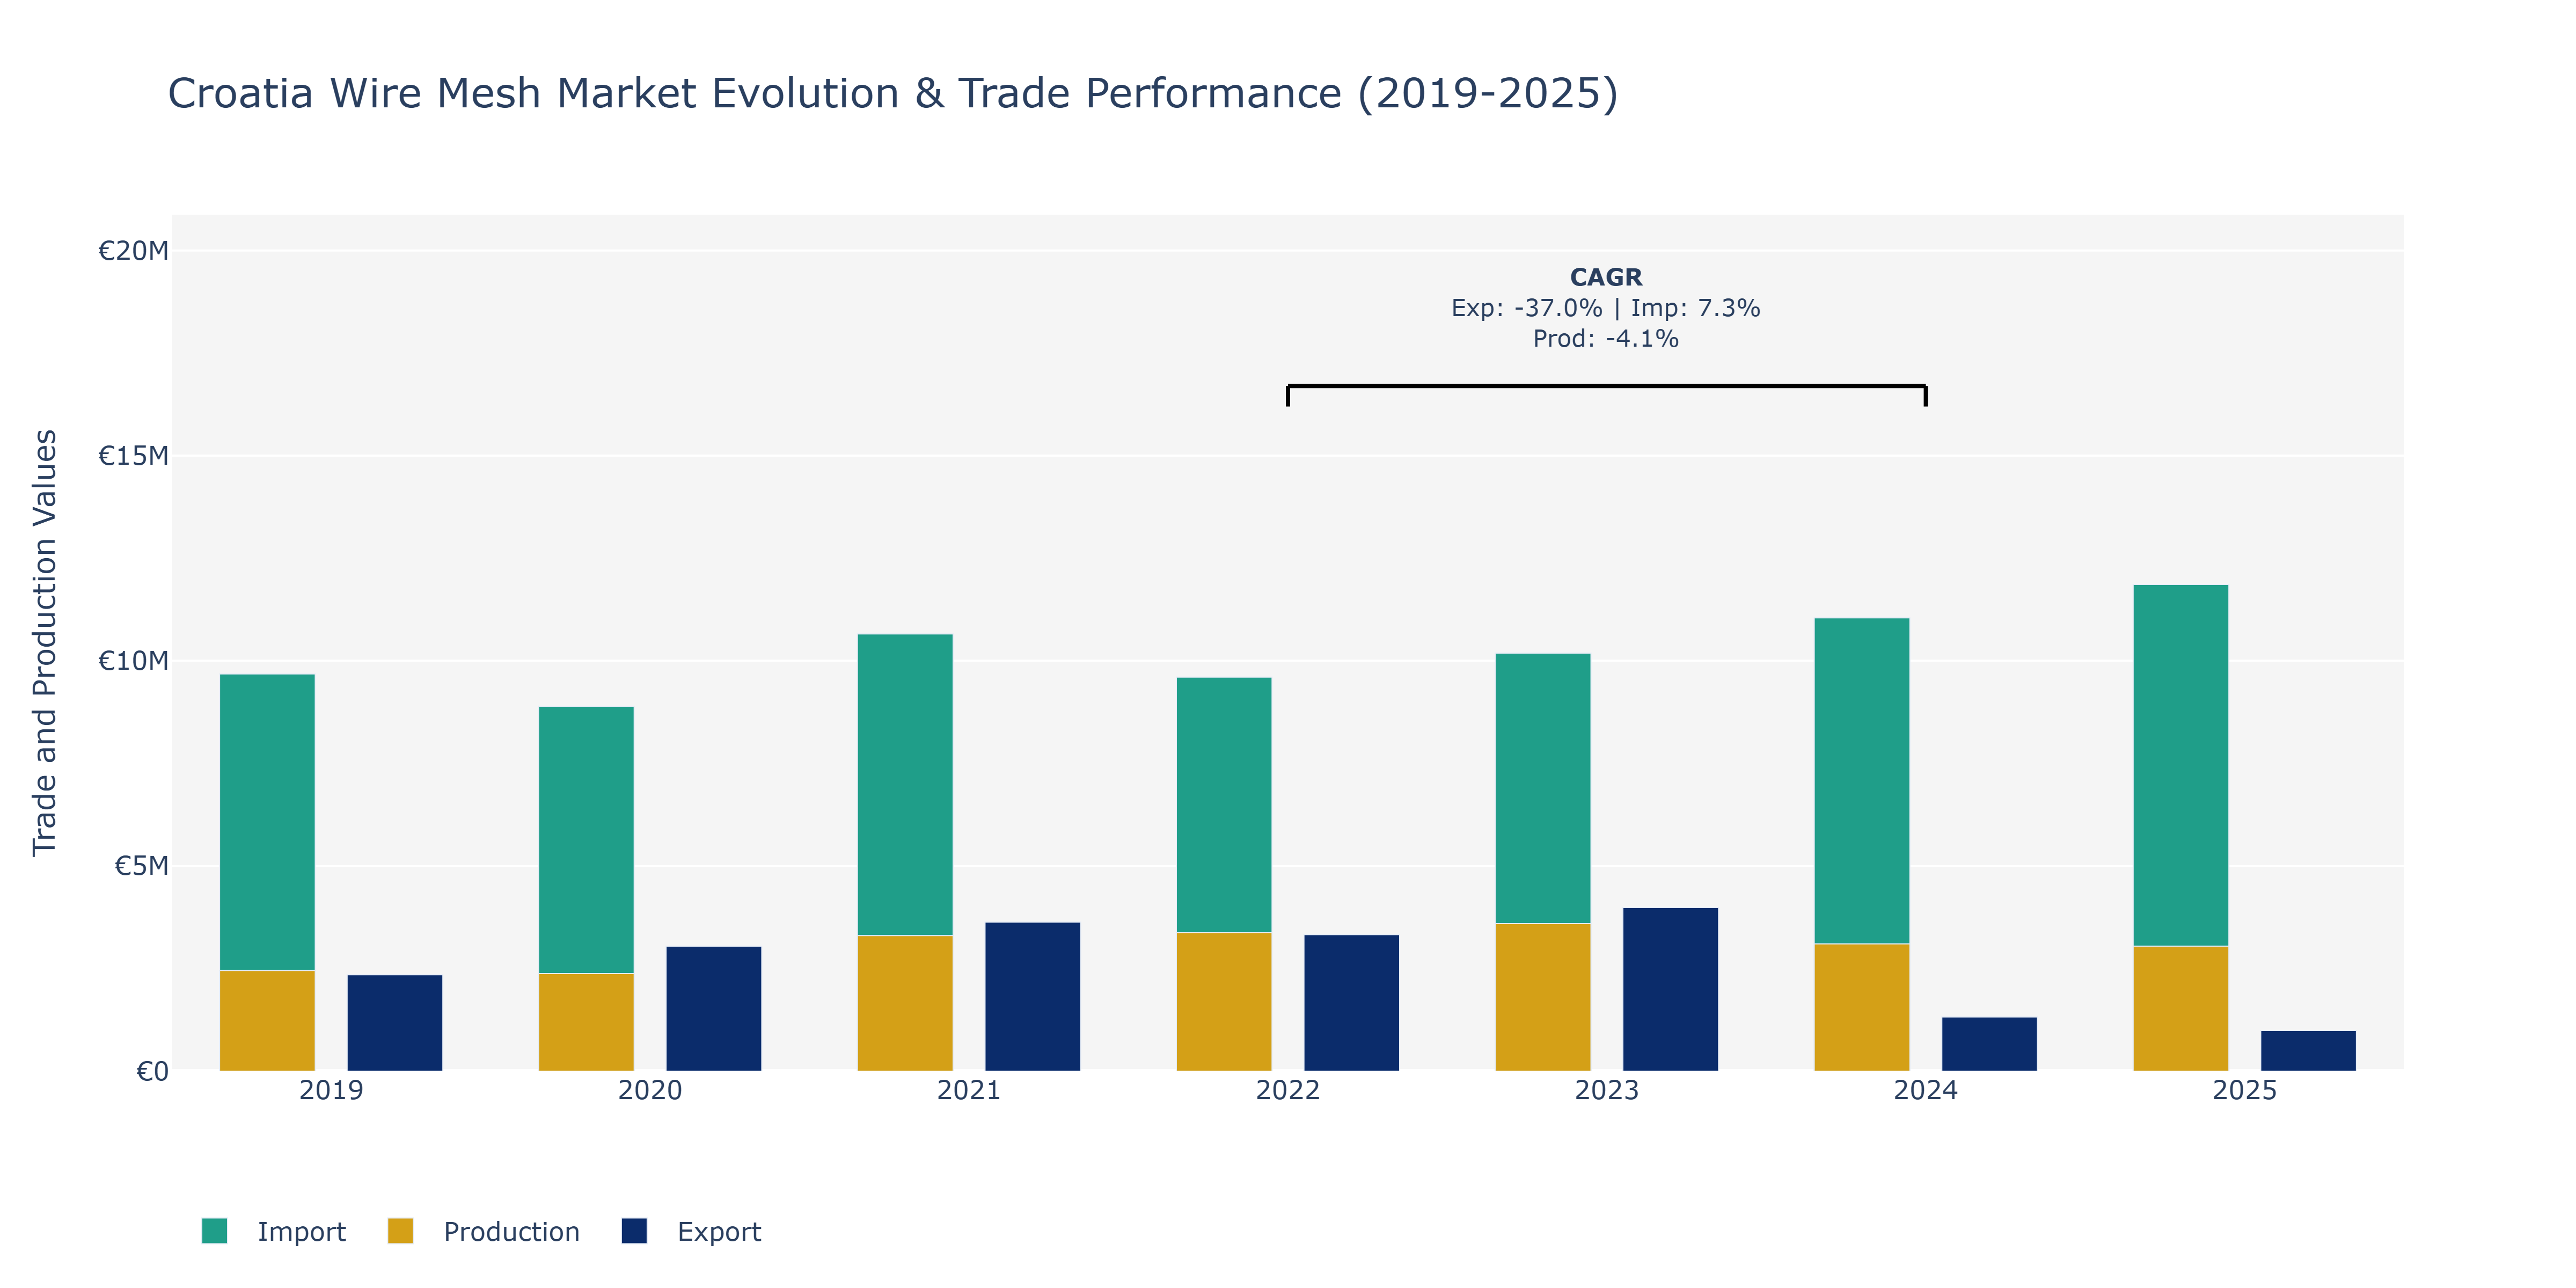
In the Croatia Wire Mesh Market, the trends in Exports, Imports, and Production show varying dynamics over the years. From 2019 to 2021, Exports exhibited a consistent upward trajectory, reaching its peak at €3.63 million in 2021 before experiencing a decline in 2022 and further dropping significantly in 2024. Imports, on the other hand, fluctuated throughout the years but generally increased, with the highest value recorded in 2025 at €11.86 million. Production, after a slight decline in 2020, demonstrated a recovery in 2021, followed by a peak in 2023. The subsequent drop in 2024 was notable. These fluctuations can be attributed to factors such as global demand shifts, changes in raw material costs, and market competitiveness. With increased infrastructure development and construction activities globally, the demand for wire mesh products likely influenced these trends. To maintain competitiveness, Croatian wire mesh manufacturers may need to focus on efficiency improvements and quality enhancements to meet evolving market demands.
Key Highlights of the Report:
- Croatia Wire Mesh Market Outlook
- Market Size of Croatia Wire Mesh Market, 2025
- Forecast of Croatia Wire Mesh Market, 2032
- Historical Data and Forecast of Croatia Wire Mesh Revenues & Volume for the Period 2022 - 2032F
- Croatia Wire Mesh Market Trend Evolution
- Croatia Wire Mesh Market Drivers and Challenges
- Croatia Wire Mesh Price Trends
- Croatia Wire Mesh Porter`s Five Forces
- Croatia Wire Mesh Industry Life Cycle
- Historical Data and Forecast of Croatia Wire Mesh Market Revenues & Volume By Types for the Period 2022 - 2032F
- Historical Data and Forecast of Croatia Wire Mesh Market Revenues & Volume By Electro Galvanized Welded Wire Mesh for the Period 2022 - 2032F
- Historical Data and Forecast of Croatia Wire Mesh Market Revenues & Volume By Hot Dipped Galvanized Welded Mesh for the Period 2022 - 2032F
- Historical Data and Forecast of Croatia Wire Mesh Market Revenues & Volume By PVC Coated Welded Mesh for the Period 2022 - 2032F
- Historical Data and Forecast of Croatia Wire Mesh Market Revenues & Volume By Welded Stainless Steel Mesh for the Period 2022 - 2032F
- Historical Data and Forecast of Croatia Wire Mesh Market Revenues & Volume By Welded Wire Fencing Panels for the Period 2022 - 2032F
- Historical Data and Forecast of Croatia Wire Mesh Market Revenues & Volume By Applications for the Period 2022 - 2032F
- Historical Data and Forecast of Croatia Wire Mesh Market Revenues & Volume By Construction for the Period 2022 - 2032F
- Historical Data and Forecast of Croatia Wire Mesh Market Revenues & Volume By Agricultural for the Period 2022 - 2032F
- Historical Data and Forecast of Croatia Wire Mesh Market Revenues & Volume By Industrial for the Period 2022 - 2032F
- Historical Data and Forecast of Croatia Wire Mesh Market Revenues & Volume By Transportation for the Period 2022 - 2032F
- Historical Data and Forecast of Croatia Wire Mesh Market Revenues & Volume By Horticultural for the Period 2022 - 2032F
- Historical Data and Forecast of Croatia Wire Mesh Market Revenues & Volume By Food Procuring Sector for the Period 2022 - 2032F
- Historical Data and Forecast of Croatia Wire Mesh Market Revenues & Volume By Others for the Period 2022 - 2032F
- Croatia Wire Mesh Import Export Trade Statistics
- Market Opportunity Assessment By Types
- Market Opportunity Assessment By Applications
- Croatia Wire Mesh Top Companies Market Share
- Croatia Wire Mesh Competitive Benchmarking By Technical and Operational Parameters
- Croatia Wire Mesh Company Profiles
- Croatia Wire Mesh Key Strategic Recommendations
Frequently Asked Questions About the Market Study (FAQs):
6Wresearch actively monitors the Croatia Wire Mesh Market and publishes its comprehensive annual report, highlighting emerging trends, growth drivers, revenue analysis, and forecast outlook. Our insights help businesses to make data-backed strategic decisions with ongoing market dynamics. Our analysts track relevent industries related to the Croatia Wire Mesh Market, allowing our clients with actionable intelligence and reliable forecasts tailored to emerging regional needs.
Yes, we provide customisation as per your requirements. To learn more, feel free to contact us on sales@6wresearch.com
1 Executive Summary |
2 Introduction |
2.1 Key Highlights of the Report |
2.2 Report Description |
2.3 Market Scope & Segmentation |
2.4 Research Methodology |
2.5 Assumptions |
3 Croatia Wire Mesh Market Overview |
3.1 Croatia Country Macro Economic Indicators |
3.2 Croatia Wire Mesh Market Revenues & Volume, 2022 & 2032F |
3.3 Croatia Wire Mesh Market - Industry Life Cycle |
3.4 Croatia Wire Mesh Market - Porter's Five Forces |
3.5 Croatia Wire Mesh Market Revenues & Volume Share Segmentations, 2022 & 2032F |
3.6 Croatia Wire Mesh Market Revenues & Volume Share, By Applications, 2022 & 2032F |
4 Croatia Wire Mesh Market Dynamics |
4.1 Impact Analysis |
4.2 Market Drivers |
4.2.1 Growth in construction and infrastructure projects in Croatia |
4.2.2 Increasing demand for wire mesh in agriculture sector |
4.2.3 Rising adoption of wire mesh in industrial applications |
4.3 Market Restraints |
4.3.1 Fluctuating raw material prices |
4.3.2 Intense competition from alternative materials |
4.3.3 Regulatory challenges in terms of environmental sustainability |
5 Croatia Wire Mesh Market Trends |
6 Croatia Wire Mesh Market Segmentations |
6.1 Croatia Wire Mesh Market Segmentations |
6.1.1 Overview and Analysis |
6.1.2 Croatia Wire Mesh Market Revenues & Volume, By Electro Galvanized Welded Wire Mesh, 2022 - 2032F |
6.1.3 Croatia Wire Mesh Market Revenues & Volume, By Hot Dipped Galvanized Welded Mesh, 2022 - 2032F |
6.1.4 Croatia Wire Mesh Market Revenues & Volume, By PVC Coated Welded Mesh, 2022 - 2032F |
6.1.5 Croatia Wire Mesh Market Revenues & Volume, By Welded Stainless Steel Mesh, 2022 - 2032F |
6.1.6 Croatia Wire Mesh Market Revenues & Volume, By Welded Wire Fencing Panels, 2022 - 2032F |
6.2 Croatia Wire Mesh Market, By Applications |
6.2.1 Overview and Analysis |
6.2.2 Croatia Wire Mesh Market Revenues & Volume, By Construction, 2022 - 2032F |
6.2.3 Croatia Wire Mesh Market Revenues & Volume, By Agricultural, 2022 - 2032F |
6.2.4 Croatia Wire Mesh Market Revenues & Volume, By Industrial, 2022 - 2032F |
6.2.5 Croatia Wire Mesh Market Revenues & Volume, By Transportation, 2022 - 2032F |
6.2.6 Croatia Wire Mesh Market Revenues & Volume, By Horticultural, 2022 - 2032F |
6.2.7 Croatia Wire Mesh Market Revenues & Volume, By Food Procuring Sector, 2022 - 2032F |
7 Croatia Wire Mesh Market Import-Export Trade Statistics |
7.1 Croatia Wire Mesh Market Export to Major Countries |
7.2 Croatia Wire Mesh Market Imports from Major Countries |
8 Croatia Wire Mesh Market Key Performance Indicators |
8.1 Average selling price of wire mesh products |
8.2 Number of new construction permits issued in Croatia |
8.3 Percentage of agricultural businesses using wire mesh technology in their operations |
9 Croatia Wire Mesh Market - Opportunity Assessment |
9.1 Croatia Wire Mesh Market Opportunity Assessment Segmentations, 2022 & 2032F |
9.2 Croatia Wire Mesh Market Opportunity Assessment, By Applications, 2022 & 2032F |
10 Croatia Wire Mesh Market - Competitive Landscape |
10.1 Croatia Wire Mesh Market Revenue Share, By Companies, 2025 |
10.2 Croatia Wire Mesh Market Competitive Benchmarking, By Operating and Technical Parameters |
11 Company Profiles |
12 Recommendations | 13 Disclaimer |
Global Go To Market Strategy - 2030
Export potential enables firms to identify high-growth global markets with greater confidence by combining advanced trade intelligence with a structured quantitative methodology. The framework analyzes emerging demand trends and country-level import patterns while integrating macroeconomic and trade datasets such as GDP and population forecasts, bilateral import–export flows, tariff structures, elasticity differentials between developed and developing economies, geographic distance, and import demand projections. Using weighted trade values from 2020–2024 as the base period to project country-to-country export potential for 2030, these inputs are operationalized through calculated drivers such as gravity model parameters, tariff impact factors, and projected GDP per-capita growth. Through an analysis of hidden potentials, demand hotspots, and market conditions that are most favorable to success, this method enables firms to focus on target countries, maximize returns, and global expansion with data, backed by accuracy.
By factoring in the projected importer demand gap that is currently unmet and could be potential opportunity, it identifies the potential for the Exporter (Country) among 190 countries, against the general trade analysis, which identifies the biggest importer or exporter.
To discover high-growth global markets and optimize your business strategy:
Click Here
Pricing
- Single User License$ 1,995
- Department License$ 2,400
- Site License$ 3,120
- Global License$ 3,795

Leadership Perspectives from Industry Events
Search
Thought Leadership and Analyst Meet


Our Clients
6WResearch In News
- Doha a strategic location for EV manufacturing hub: IPA Qatar
- Demand for luxury TVs surging in the GCC, says Samsung
- Empowering Growth: The Thriving Journey of Bangladesh’s Cable Industry
- Demand for luxury TVs surging in the GCC, says Samsung
- Video call with a traditional healer? Once unthinkable, it’s now common in South Africa
- Intelligent Buildings To Smooth GCC’s Path To Net Zero
Latest Reports
- New Zealand Aseptic Manufacturing Market (2026-2032)
- Netherlands Aseptic Manufacturing Market (2026-2032)
- Nauru Aseptic Manufacturing Market (2026-2032)
- Namibia Aseptic Manufacturing Market (2026-2032)
- Mozambique Aseptic Manufacturing Market (2026-2032)
- Montenegro Aseptic Manufacturing Market (2026-2032)
- Mongolia Aseptic Manufacturing Market (2026-2032)
- Monaco Aseptic Manufacturing Market (2026-2032)
- Micronesia Aseptic Manufacturing Market (2026-2032)
- Mauritius Aseptic Manufacturing Market (2026-2032)
Industry Events and Analyst Meet

HIMTEX 2026

India Refining Summit 2026

India EV Show 2026

EV tech India Expo 2026

Auto Tech Asia 2026
Whitepaper
- Middle East & Africa Commercial Security Market Click here to view more.
- Middle East & Africa Fire Safety Systems & Equipment Market Click here to view more.
- GCC Drone Market Click here to view more.
- Middle East Lighting Fixture Market Click here to view more.
- GCC Physical & Perimeter Security Market Click here to view more.