Tanzania Wire Mesh Market (2026-2032) | Revenue, Forecast, Analysis, Outlook, Value, Size, Growth, Companies, Share, Industry, COVID-19 IMPACT & Trends
Market Forecast By Types (Electro Galvanized Welded Wire Mesh, Hot Dipped Galvanized Welded Mesh, PVC Coated Welded Mesh, Welded Stainless Steel Mesh, Welded Wire Fencing Panels), By Applications (Construction, Agricultural, Industrial, Transportation, Horticultural, Food Procuring Sector, Others) And Competitive Landscape
| Product Code: ETC008595 | Publication Date: Jun 2023 | Updated Date: Jun 2026 | Product Type: Report | |
| Publisher: 6Wresearch | Author: Ravi Bhandari | No. of Pages: 70 | No. of Figures: 35 | No. of Tables: 5 |
Tanzania Wire Mesh Market Summary
The tanzania wire mesh market was estimated at USD 485 Million in 2025 and is projected to reach USD 662 Million by 2032, growing at a CAGR of 5.0% from 2026 to 2032.
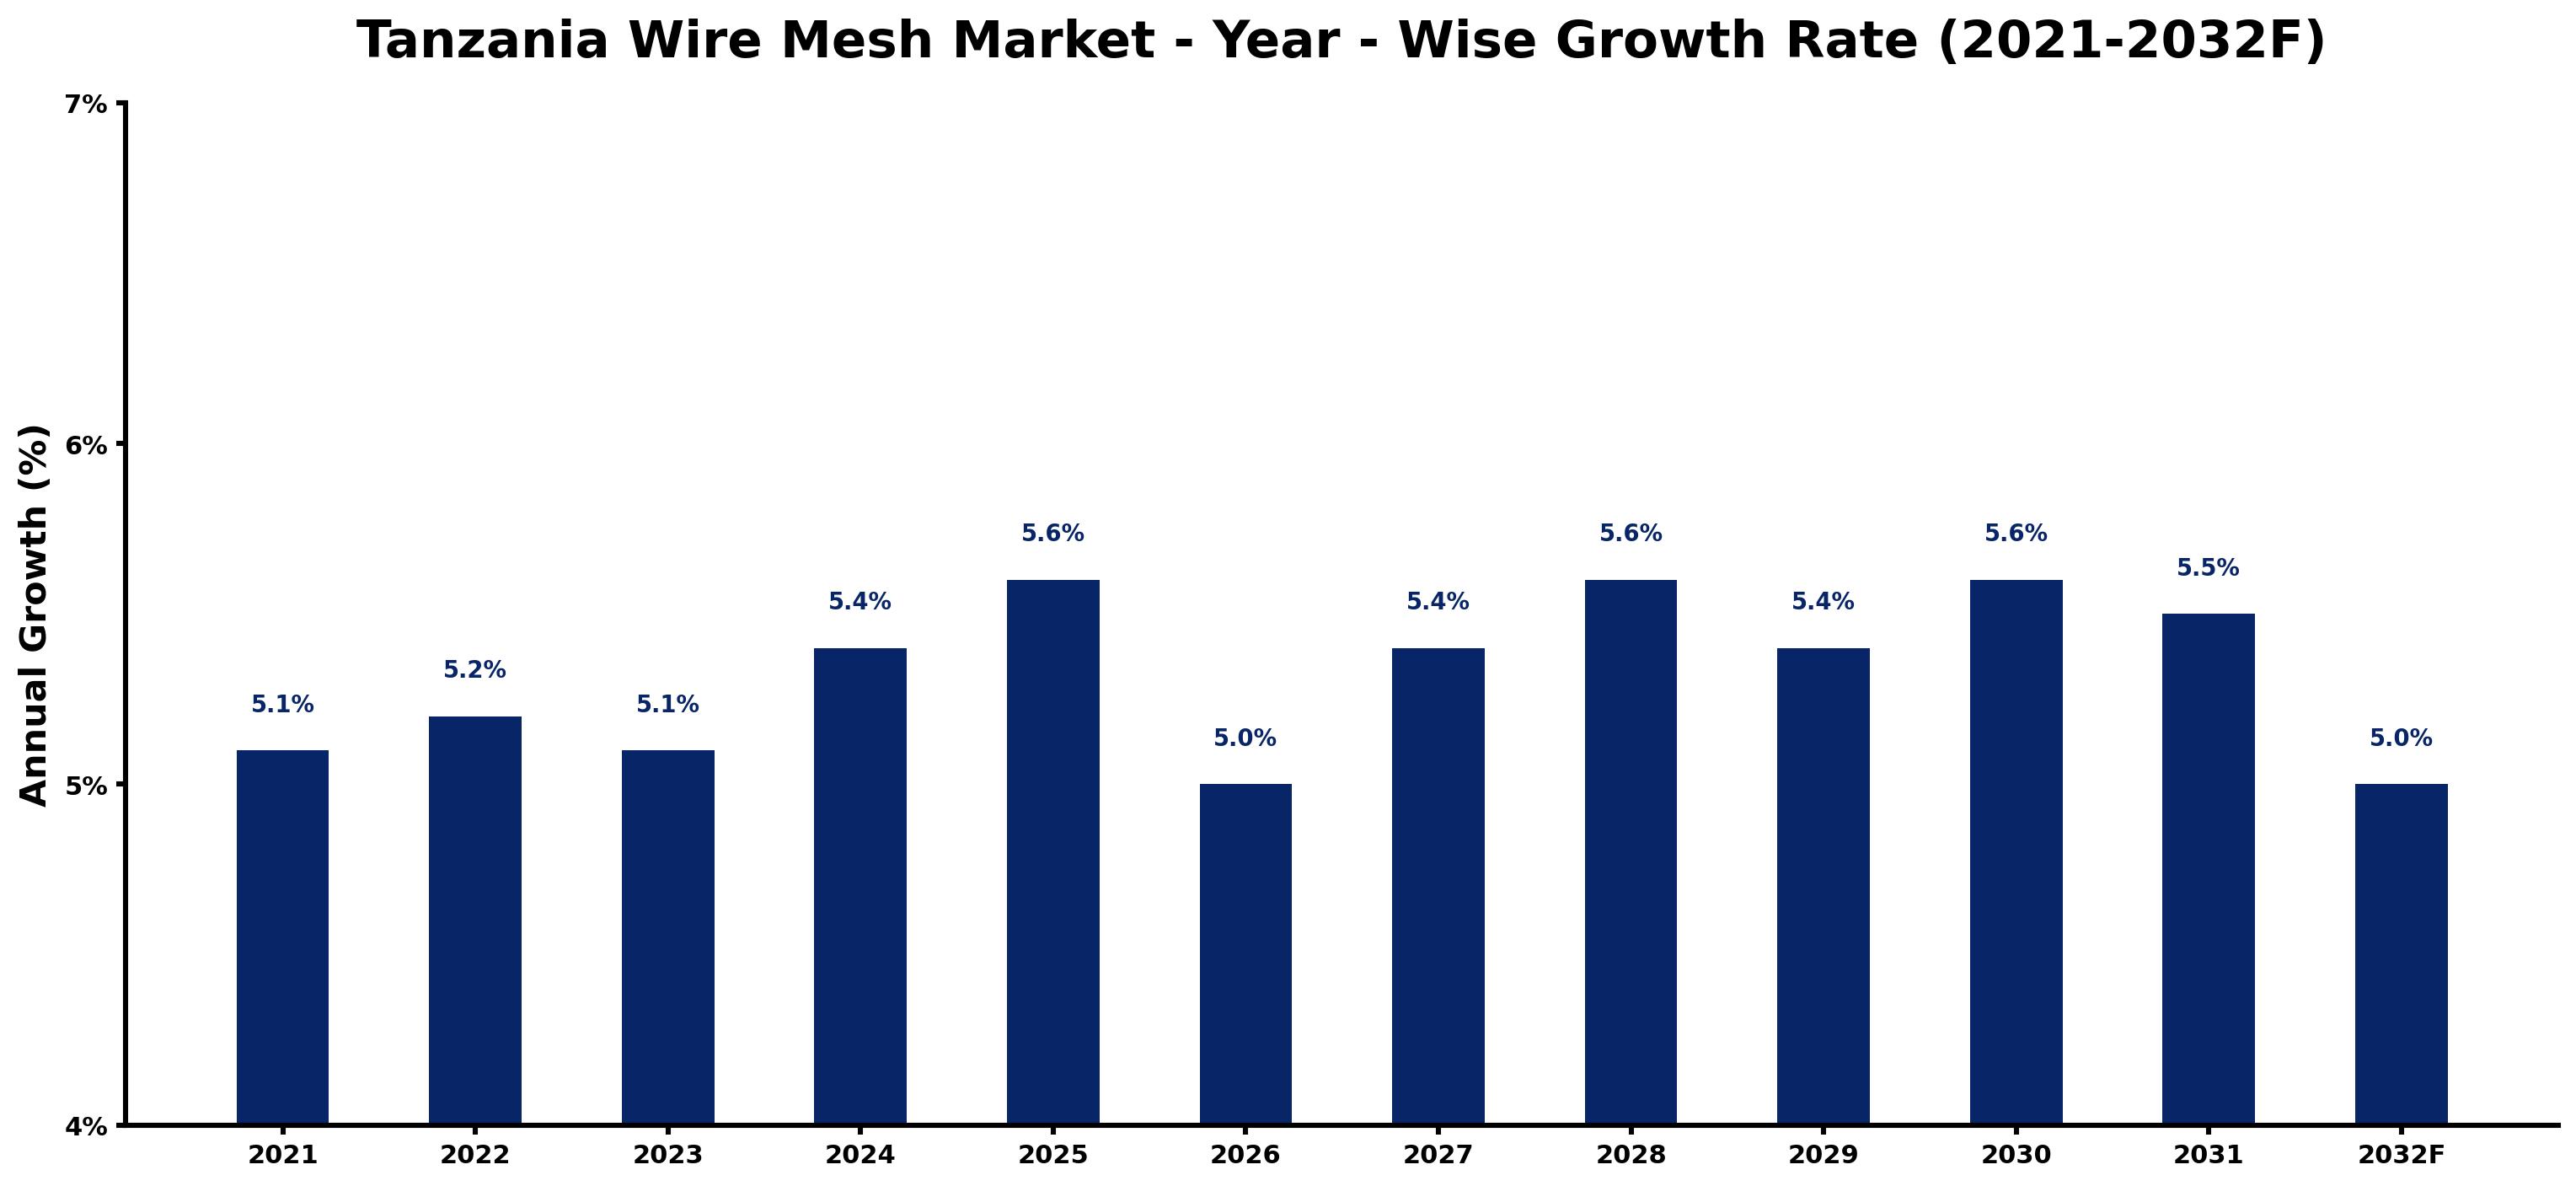
Tanzania Wire Mesh Market Growth Rate Analysis (2021-2032)
The Tanzania Wire Mesh market has experienced steady growth, with annual increases of 5.1% in 2021, climbing slightly to 5.4% by 2024. This upward trend is fueled by infrastructure developments and a surge in construction activities, particularly in urban areas. In 2023, the growth rate stabilized at 5.1%, reflecting the impact of external economic conditions, yet regained momentum to reach 5.6% by 2025 as consumer demand for durable construction materials intensified. The evolving energy transition has also influenced investments in the sector, fostering innovations that support sustainability. Although 2026 saw a minor dip to 5.0%, the long-term projection remains robust, driven by ongoing industrial investments and digital transformation in the manufacturing processes.
Tanzania Wire Mesh Market Year-wise Growth Rate and Key Drivers
This graph highlights how the Tanzania Wire Mesh Market has steadily grown over the past five years, supported by major growth factors.
The table below presents the year wise growth rates along with the key drivers influencing the market
| Year | Growth Rate | Major Drivers |
| 2021 | 5.1% | Tanzania's construction sector showed resilience, boosting wire mesh demand in urban areas. |
| 2022 | 5.2% | Infrastructure projects gained momentum, increasing investments in wire mesh production capacity. |
| 2023 | 5.1% | Local manufacturers expanded operations to meet rising construction material needs effectively. |
| 2024 | 5.4% | Urbanization trends accelerated, creating substantial opportunities for wire mesh applications nationwide. |
| 2025 | 5.6% | Innovative construction techniques emphasized the importance of high-quality wire mesh products. |
| 2026 | 5.0% | Increased focus on safety regulations enhanced the demand for durable wire mesh solutions. |
| 2027 | 5.4% | Investments in renewable energy projects bolstered the requirement for specialized wire mesh. |
| 2028 | 5.6% | Government housing initiatives aimed to improve infrastructure, driving wire mesh market expansion. |
| 2029 | 5.4% | Growing awareness of climate-resilient construction methods favored wire mesh product adoption. |
| 2030 | 5.6% | Technological advancements in manufacturing processes streamlined wire mesh production efficiency. |
| 2031 | 5.5% | The shift towards sustainable materials increased interest in eco-friendly wire mesh options. |
| 2032 | 5.0% | Market consolidation occurred as companies sought to strengthen their wire mesh offerings. |
Note - Market size estimations and growth projections presented in this report are based on 6Wresearch's advanced forecasting approach, validated with industry datasets as of June 2026.
Tanzania Wire Mesh Market Synopsis
The Tanzania Wire Mesh Market is projected to reach 5.0% and witness significant growth during the forecast period (2026-2032). This growth trajectory is fueled by multiple factors, including rapid industrialization and an upsurge in construction activities across the region. Various investments in infrastructure development further contribute to the increasing demand for wire mesh in Tanzania. Coupled with government initiatives aimed at enhancing rural electrification, the market is poised for a robust expansion in the foreseeable future.
Tanzania Wire Mesh Market Growth Drivers
The Tanzania Wire Mesh Market is driven by several critical factors that align with the country's economic trajectory. A primary driver of market growth is the ongoing industrialization process, which catalyzes the demand for wire mesh in various applications, including construction and manufacturing. The construction sector, in particular, is experiencing a boom, boosted by urbanization trends and increasing infrastructural projects.
- The growing emphasis on rural electrification by the Tanzanian government is fostering demand for wire mesh solutions used in electrical applications.
- Investments in large-scale infrastructure projects such as roads, bridges, and commercial buildings directly impact the wire mesh market by increasing usage in construction materials.
- The rising popularity of stainless steel meshes, known for their corrosion resistance and strength, is anticipated to drive demand further.
- Technological advancements in welding techniques allow for the creation of complex shapes, generating opportunities for innovative wire mesh applications.
- Increased adoption of wire mesh in various sectors, including agriculture and mining, is expected to provide additional market growth avenues.
Tanzania Wire Mesh Market Trends and Opportunities
Emerging trends within the Tanzania Wire Mesh Market indicate significant opportunities for stakeholders. One critical trend is the growing adoption of advanced manufacturing techniques, such as 3D printing. This technology provides unique advantages, including improved accuracy and reduced production costs associated with traditional fabrication processes.
- The integration of sustainable manufacturing practices is shaping consumer expectations and driving demand for eco-friendly wire mesh products.
- Enhancements in material science are leading to the development of innovative wire mesh solutions tailored for specific industrial applications.
- Collaborations between metal fabricators and construction firms are fostering the creation of custom-designed wire mesh products.
- The increasing focus on infrastructural development across East Africa is likely to establish a broader market for wire mesh solutions in neighboring regions.
- Investment in research and development to create higher strength materials will continue to pave the way for product innovation in the market.
Tanzania Wire Mesh Market Challenges and Restraints
While the Tanzania Wire Mesh Market shows promising growth potential, several challenges could hinder its advancement. Stringent environmental regulations imposed on manufacturing companies may limit product innovation, presenting a significant hurdle for market growth.
- The financial constraints faced by small-scale manufacturers could restrict their ability to adopt advanced technologies.
- Inconsistent raw material supply chains can introduce volatility in production schedules and costs.
- Market participants may struggle with compliance to increasingly rigorous environmental regulations, impacting operational efficiency.
- Competition from alternative materials may pose a threat to the traditional wire mesh market, necessitating innovation.
- Fluctuations in market demand, influenced by economic conditions and investment climate, could lead to uncertainty for industry players.
Tanzania Wire Mesh Market Government Investment and Initiatives
The Tanzanian government has been active in promoting the wire mesh industry through various investment initiatives and policy frameworks. Notably, tax and non-tax incentives aimed at supporting rural electrification projects are central to enhancing demand for wire mesh products. These initiatives not only bolster market growth but also align with national development goals.
- The government's commitment to improving infrastructure is reflected in its budget allocations for construction projects, directly benefiting the wire mesh market.
- Public-private partnerships are increasingly encouraged to foster innovation and investment in the wire mesh manufacturing sector.
- Incentives for manufacturers adopting sustainable practices highlight the government's focus on environmental accountability.
- Policies promoting local production of wire mesh products aim to reduce dependency on imports, enhancing market competitiveness.
- National development plans underscore the importance of supporting industries like wire mesh in contributing to broader economic growth.
Tanzania Wire Mesh Market Latest Developments (May 2025 - June 2026)
During the period from May 2025 to June 2026, the Tanzania Wire Mesh Market has seen notable advancements reflecting the industry's trajectory. The evolving landscape indicates a shift towards modern manufacturing methodologies, significantly improving production capabilities. Furthermore, an emphasis on the durability and versatility of wire mesh products has become more pronounced as manufacturers seek to meet changing consumer preferences.
- Innovations in wire mesh solutions have been increasingly aligned with sustainability, responding to market demands for eco-friendly products.
- Regulatory updates have prompted manufacturers to adapt quickly, ensuring compliance while pursuing operational efficiencies.
- The market landscape has witnessed increased collaborations between various stakeholders to drive research and development efforts.
- Emerging startups focusing on niche wire mesh applications are reshaping competitive dynamics in the industry.
- Trade relationships with neighboring countries have enhanced market access for Tanzanian wire mesh products, expanding export opportunities.
Tanzania Wire Mesh Market - Key Attractiveness of the Report
- 10 Years of Market Numbers
- Historical Data Starting from 2022 to 2025
- Base Year: 2025
- Forecast Data until 2032
- Key Performance Indicators Impacting the Market
- Major Upcoming Developments and Projects
Key Highlights of the Report:
- Tanzania Wire Mesh Market Outlook
- Market Size of Tanzania Wire Mesh Market, 2025
- Forecast of Tanzania Wire Mesh Market, 2032F
- Historical Data and Forecast of Tanzania Wire Mesh Revenues & Volume for the Period 2022-2032F
- Tanzania Wire Mesh Market Trend Evolution
- Tanzania Wire Mesh Market Drivers and Challenges
- Tanzania Wire Mesh Price Trends
- Tanzania Wire Mesh Porter's Five Forces
- Tanzania Wire Mesh Industry Life Cycle
- Historical Data and Forecast of Tanzania Wire Mesh Market Revenues & Volume By Types for the Period 2022-2032F
- Historical Data and Forecast of Tanzania Wire Mesh Market Revenues & Volume By Electro Galvanized Welded Wire Mesh for the Period 2022-2032F
- Historical Data and Forecast of Tanzania Wire Mesh Market Revenues & Volume By Hot Dipped Galvanized Welded Mesh for the Period 2022-2032F
- Historical Data and Forecast of Tanzania Wire Mesh Market Revenues & Volume By PVC Coated Welded Mesh for the Period 2022-2032F
- Historical Data and Forecast of Tanzania Wire Mesh Market Revenues & Volume By Welded Stainless Steel Mesh for the Period 2022-2032F
- Historical Data and Forecast of Tanzania Wire Mesh Market Revenues & Volume By Welded Wire Fencing Panels for the Period 2022-2032F
- Historical Data and Forecast of Tanzania Wire Mesh Market Revenues & Volume By Applications for the Period 2022-2032F
- Historical Data and Forecast of Tanzania Wire Mesh Market Revenues & Volume By Construction for the Period 2022-2032F
- Historical Data and Forecast of Tanzania Wire Mesh Market Revenues & Volume By Agricultural for the Period 2022-2032F
- Historical Data and Forecast of Tanzania Wire Mesh Market Revenues & Volume By Industrial for the Period 2022-2032F
- Historical Data and Forecast of Tanzania Wire Mesh Market Revenues & Volume By Transportation for the Period 2022-2032F
- Historical Data and Forecast of Tanzania Wire Mesh Market Revenues & Volume By Horticultural for the Period 2022-2032F
- Historical Data and Forecast of Tanzania Wire Mesh Market Revenues & Volume By Food Procuring Sector for the Period 2022-2032F
- Historical Data and Forecast of Tanzania Wire Mesh Market Revenues & Volume By Others for the Period 2022-2032F
- Tanzania Wire Mesh Import Export Trade Statistics
- Market Opportunity Assessment By Types
- Market Opportunity Assessment By Applications
- Tanzania Wire Mesh Top Companies Market Share
- Tanzania Wire Mesh Competitive Benchmarking By Technical and Operational Parameters
- Tanzania Wire Mesh Company Profiles
- Tanzania Wire Mesh Key Strategic Recommendations
Frequently Asked Questions About the Market Study (FAQs):
The growth is driven by industrialization, construction activities, and government initiatives aimed at rural electrification.
Government policies include incentives for rural electrification projects and investments in infrastructure development, directly enhancing market demand.
The main challenges include stringent environmental regulations and financial constraints for smaller manufacturers.
Key trends include the adoption of advanced manufacturing techniques and a focus on sustainable practices in production.
6Wresearch actively monitors the Tanzania Wire Mesh Market and publishes its comprehensive annual report, highlighting emerging trends, growth drivers, revenue analysis, and forecast outlook. Our insights help businesses to make data-backed strategic decisions with ongoing market dynamics. Our analysts track relevent industries related to the Tanzania Wire Mesh Market, allowing our clients with actionable intelligence and reliable forecasts tailored to emerging regional needs.
Yes, we provide customisation as per your requirements. To learn more, feel free to contact us on sales@6wresearch.com
1 Executive Summary |
2 Introduction |
2.1 Key Highlights of the Report |
2.2 Report Description |
2.3 Market Scope & Segmentation |
2.4 Research Methodology |
2.5 Assumptions |
3 Tanzania Wire Mesh Market Overview |
3.1 Tanzania Country Macro Economic Indicators |
3.2 Tanzania Wire Mesh Market Revenues & Volume, 2022 & 2032F |
3.3 Tanzania Wire Mesh Market - Industry Life Cycle |
3.4 Tanzania Wire Mesh Market - Porter's Five Forces |
3.5 Tanzania Wire Mesh Market Revenues & Volume Share, By Types, 2022 & 2032F |
3.6 Tanzania Wire Mesh Market Revenues & Volume Share, By Applications, 2022 & 2032F |
4 Tanzania Wire Mesh Market Dynamics |
4.1 Impact Analysis |
4.2 Market Drivers |
4.3 Market Restraints |
5 Tanzania Wire Mesh Market Trends |
6 Tanzania Wire Mesh Market, By Types |
6.1 Tanzania Wire Mesh Market, By Types |
6.1.1 Overview and Analysis |
6.1.2 Tanzania Wire Mesh Market Revenues & Volume, By Types, 2022-2032F |
6.1.3 Tanzania Wire Mesh Market Revenues & Volume, By Electro Galvanized Welded Wire Mesh, 2022-2032F |
6.1.4 Tanzania Wire Mesh Market Revenues & Volume, By Hot Dipped Galvanized Welded Mesh, 2022-2032F |
6.1.5 Tanzania Wire Mesh Market Revenues & Volume, By PVC Coated Welded Mesh, 2022-2032F |
6.1.6 Tanzania Wire Mesh Market Revenues & Volume, By Welded Stainless Steel Mesh, 2022-2032F |
6.1.7 Tanzania Wire Mesh Market Revenues & Volume, By Welded Wire Fencing Panels, 2022-2032F |
6.2 Tanzania Wire Mesh Market, By Applications |
6.2.1 Overview and Analysis |
6.2.2 Tanzania Wire Mesh Market Revenues & Volume, By Construction, 2022-2032F |
6.2.3 Tanzania Wire Mesh Market Revenues & Volume, By Agricultural, 2022-2032F |
6.2.4 Tanzania Wire Mesh Market Revenues & Volume, By Industrial, 2022-2032F |
6.2.5 Tanzania Wire Mesh Market Revenues & Volume, By Transportation, 2022-2032F |
6.2.6 Tanzania Wire Mesh Market Revenues & Volume, By Horticultural, 2022-2032F |
6.2.7 Tanzania Wire Mesh Market Revenues & Volume, By Food Procuring Sector, 2022-2032F |
7 Tanzania Wire Mesh Market Import-Export Trade Statistics |
7.1 Tanzania Wire Mesh Market Export to Major Countries |
7.2 Tanzania Wire Mesh Market Imports from Major Countries |
8 Tanzania Wire Mesh Market Key Performance Indicators |
9 Tanzania Wire Mesh Market - Opportunity Assessment |
9.1 Tanzania Wire Mesh Market Opportunity Assessment, By Types, 2022 & 2032F |
9.2 Tanzania Wire Mesh Market Opportunity Assessment, By Applications, 2022 & 2032F |
10 Tanzania Wire Mesh Market - Competitive Landscape |
10.1 Tanzania Wire Mesh Market Revenue Share, By Companies, 2025 |
10.2 Tanzania Wire Mesh Market Competitive Benchmarking, By Operating and Technical Parameters |
11 Company Profiles |
12 Recommendations |
13 Disclaimer |
Global Go To Market Strategy - 2030
Export potential enables firms to identify high-growth global markets with greater confidence by combining advanced trade intelligence with a structured quantitative methodology. The framework analyzes emerging demand trends and country-level import patterns while integrating macroeconomic and trade datasets such as GDP and population forecasts, bilateral import–export flows, tariff structures, elasticity differentials between developed and developing economies, geographic distance, and import demand projections. Using weighted trade values from 2020–2024 as the base period to project country-to-country export potential for 2030, these inputs are operationalized through calculated drivers such as gravity model parameters, tariff impact factors, and projected GDP per-capita growth. Through an analysis of hidden potentials, demand hotspots, and market conditions that are most favorable to success, this method enables firms to focus on target countries, maximize returns, and global expansion with data, backed by accuracy.
By factoring in the projected importer demand gap that is currently unmet and could be potential opportunity, it identifies the potential for the Exporter (Country) among 190 countries, against the general trade analysis, which identifies the biggest importer or exporter.
To discover high-growth global markets and optimize your business strategy:
Click Here
Pricing
- Single User License$ 1,995
- Department License$ 2,400
- Site License$ 3,120
- Global License$ 3,795

Leadership Perspectives from Industry Events
Search
Thought Leadership and Analyst Meet


Our Clients
6WResearch In News
- India Air Conditioner Market Set for Strong Rebound in 2026 After Weather-Led Correction and GST-Driven Recovery: 6Wresearch
- ADAS in India: How Automatic Emergency Braking, Blind Spot Detection & Driver Monitoring are Transforming Road Safety
- Doha a strategic location for EV manufacturing hub: IPA Qatar
- Demand for luxury TVs surging in the GCC, says Samsung
- Empowering Growth: The Thriving Journey of Bangladesh’s Cable Industry
- Demand for luxury TVs surging in the GCC, says Samsung
Latest Reports
- Poland Fire Protection Systems Market (2026-2032)
- Cape Verde Portable Hand-Thrown Extinguisher Market (2026-2032)
- Canada Portable Hand-Thrown Extinguisher Market (2026-2032)
- Cameroon Portable Hand-Thrown Extinguisher Market (2026-2032)
- Burundi Portable Hand-Thrown Extinguisher Market (2026-2032)
- Burkina Faso Portable Hand-Thrown Extinguisher Market (2026-2032)
- Bulgaria Portable Hand-Thrown Extinguisher Market (2026-2032)
- Brunei Portable Hand-Thrown Extinguisher Market (2026-2032)
- Botswana Portable Hand-Thrown Extinguisher Market (2026-2032)
- Bosnia and Herzegovina Portable Hand-Thrown Extinguisher Market (2026-2032)
Industry Events and Analyst Meet

HIMTEX 2026

India Refining Summit 2026

India EV Show 2026

EV tech India Expo 2026

Auto Tech Asia 2026
Whitepaper
- Middle East & Africa Commercial Security Market Click here to view more.
- Middle East & Africa Fire Safety Systems & Equipment Market Click here to view more.
- GCC Drone Market Click here to view more.
- Middle East Lighting Fixture Market Click here to view more.
- GCC Physical & Perimeter Security Market Click here to view more.