Cyprus Aluminum Wire Market (2025-2031) | Industry, Outlook, Companies, Share, Trends, Growth, Revenue, Analysis, Forecast, Value, Size & Segmentation
Market Forecast By Grade (Electrical, Alloy, Mechanical), By Product (Enameled, Paper Insulated, Fiber Glass Insulated, Nomex Insulated, Mica Insulated, Cotton Insulated), By Application (Automobile, Circuit Breakers, Switches & Meters, Home Electrical Appliances, Motors, Rotating machine, Transformers, Shipping) And Competitive Landscape
| Product Code: ETC5091796 | Publication Date: Nov 2023 | Updated Date: Apr 2026 | Product Type: Market Research Report | |
| Publisher: 6Wresearch | Author: Shubham Padhi | No. of Pages: 60 | No. of Figures: 30 | No. of Tables: 5 |
Cyprus Aluminum Wire Market Size (2020-2030)
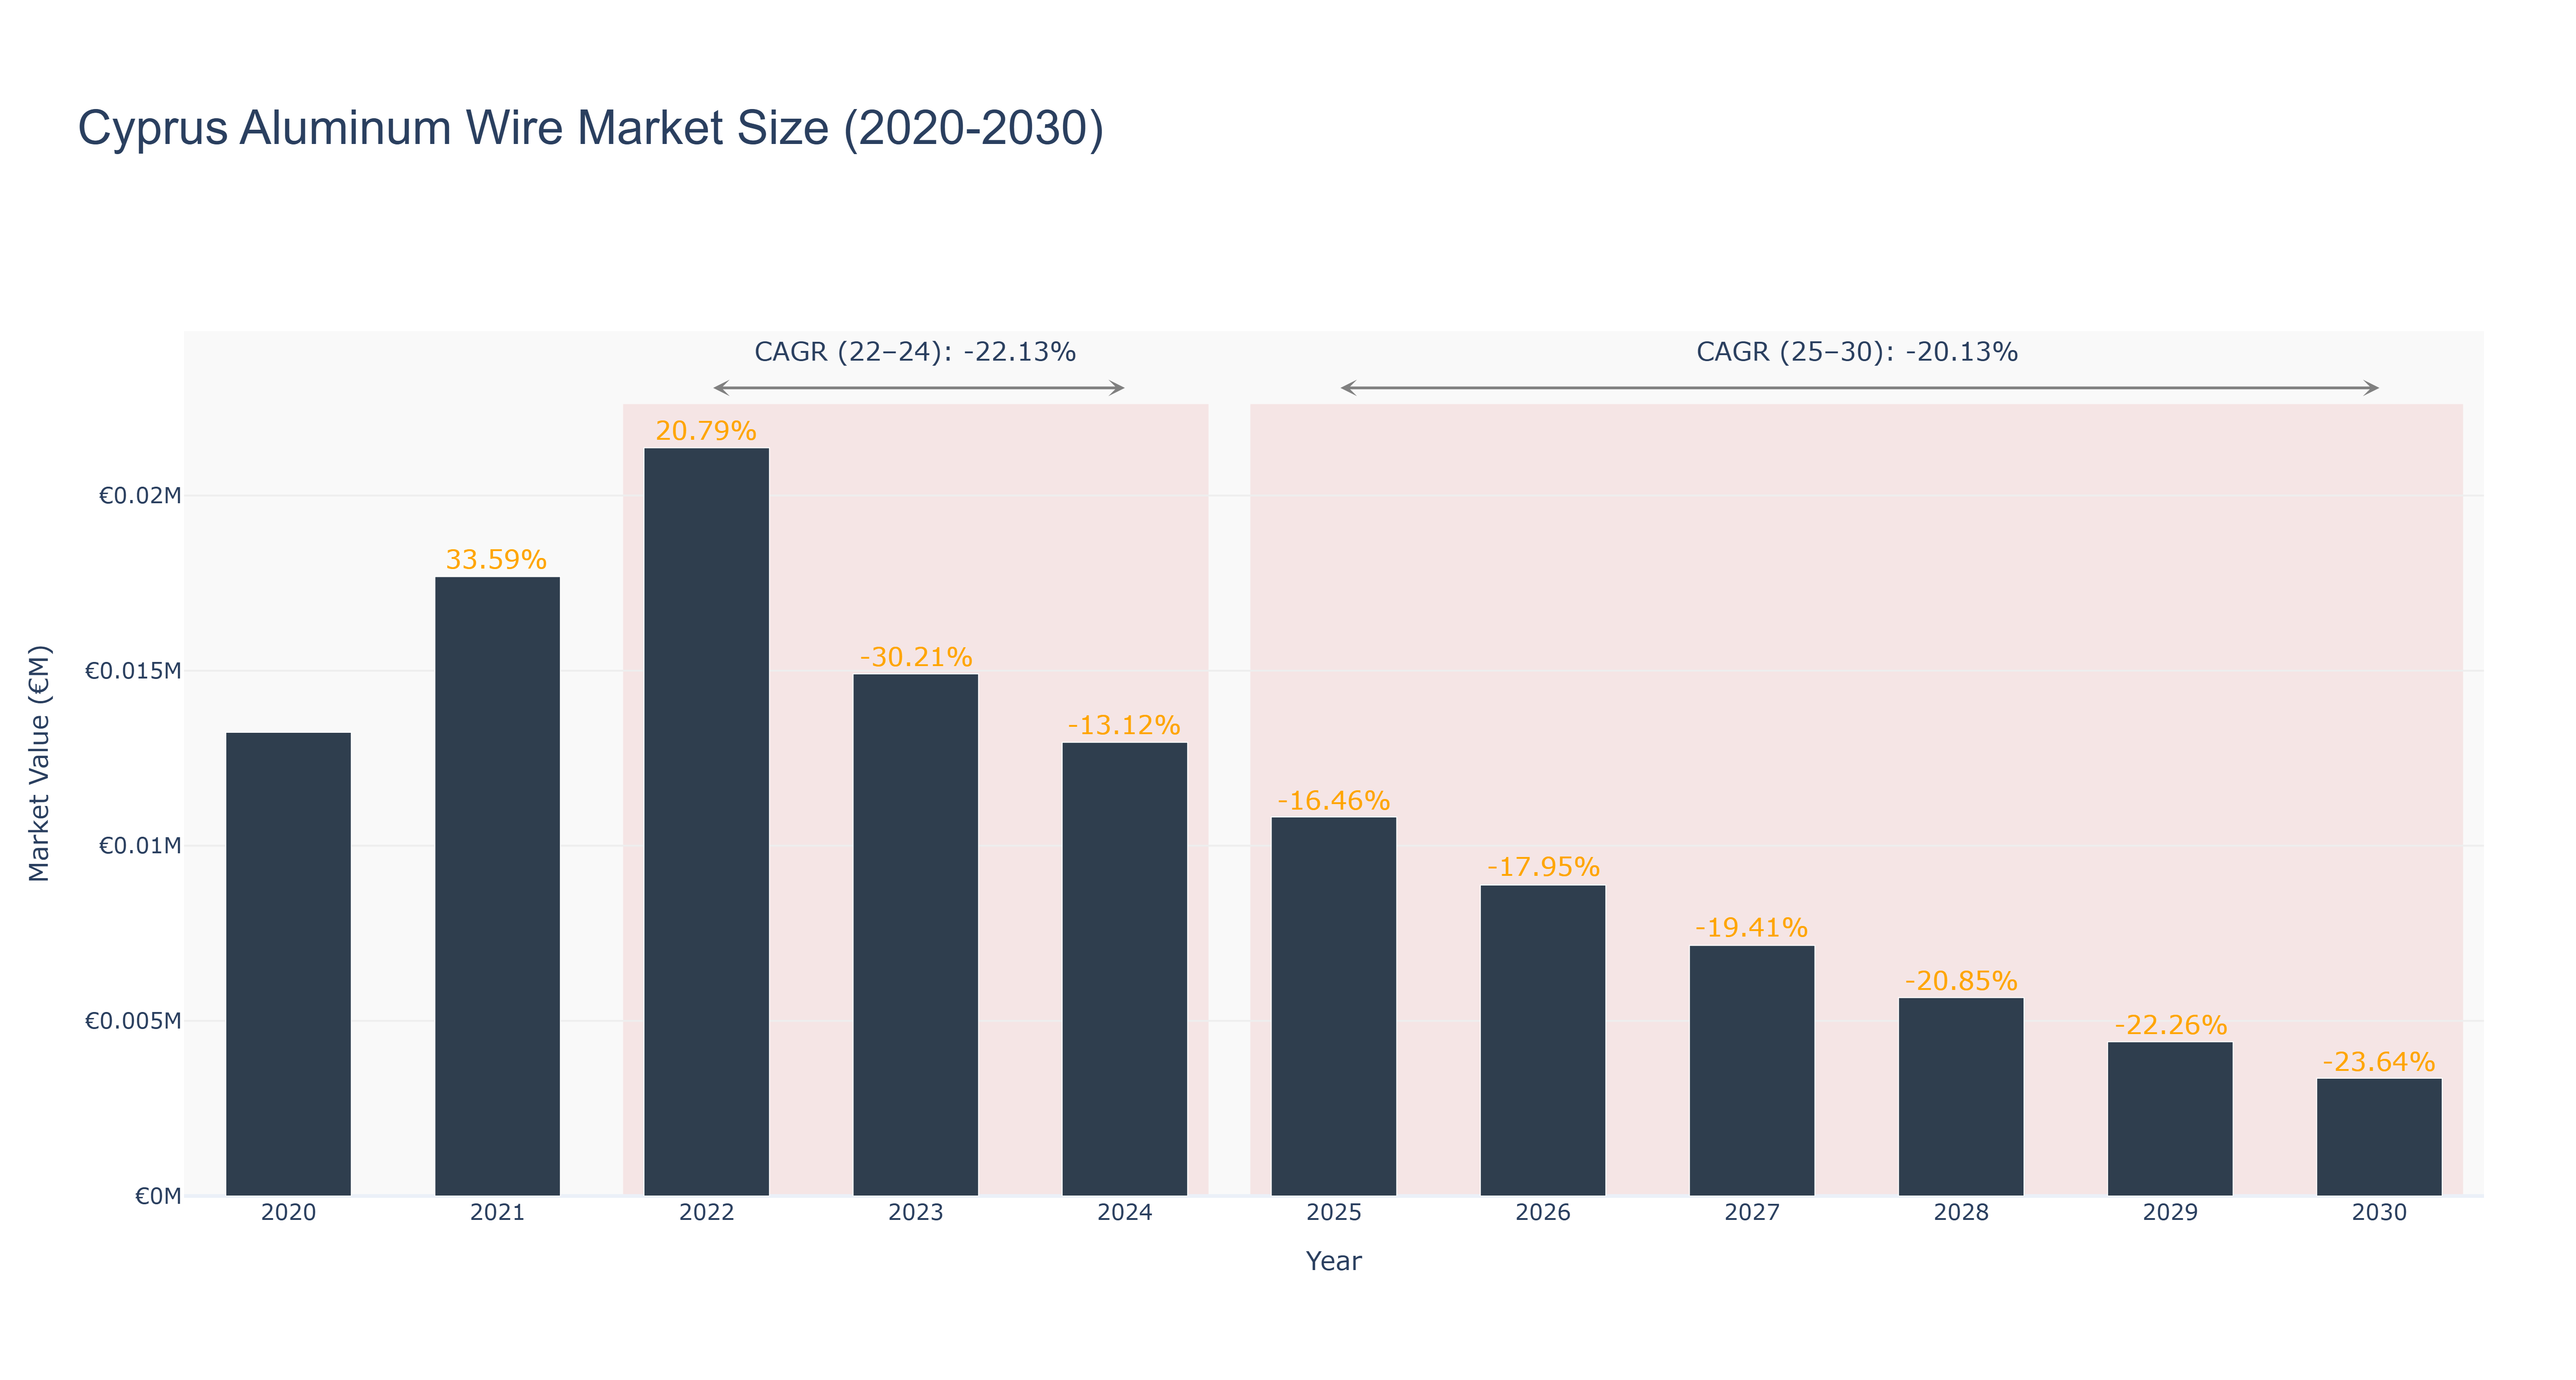
The Cyprus Aluminum Wire Market has experienced significant volatility, with a notable peak market size of €21.36 thousand in 2022. The actual market size grew from €13.24 thousand in 2020 to €17.69 thousand in 2021, reflecting a robust growth rate of 33.59%. However, this growth was short-lived, as the market contracted sharply to €14.91 thousand in 2023 and further declined to €12.95 thousand in 2024, resulting in a negative CAGR of -22.13% for the period. Looking ahead, the forecasted market size is expected to continue its downward trajectory, decreasing to €3.36 thousand by 2030, with a projected CAGR of -20.13%. This decline can be attributed to factors such as decreased demand in construction and manufacturing sectors, along with increased competition from alternative materials. Future developments in the market may hinge on broader economic recovery and potential investments in infrastructure, but the current outlook remains challenging.
Cyprus Aluminum Wire Market: Production & Trade Performance (2019-2025)
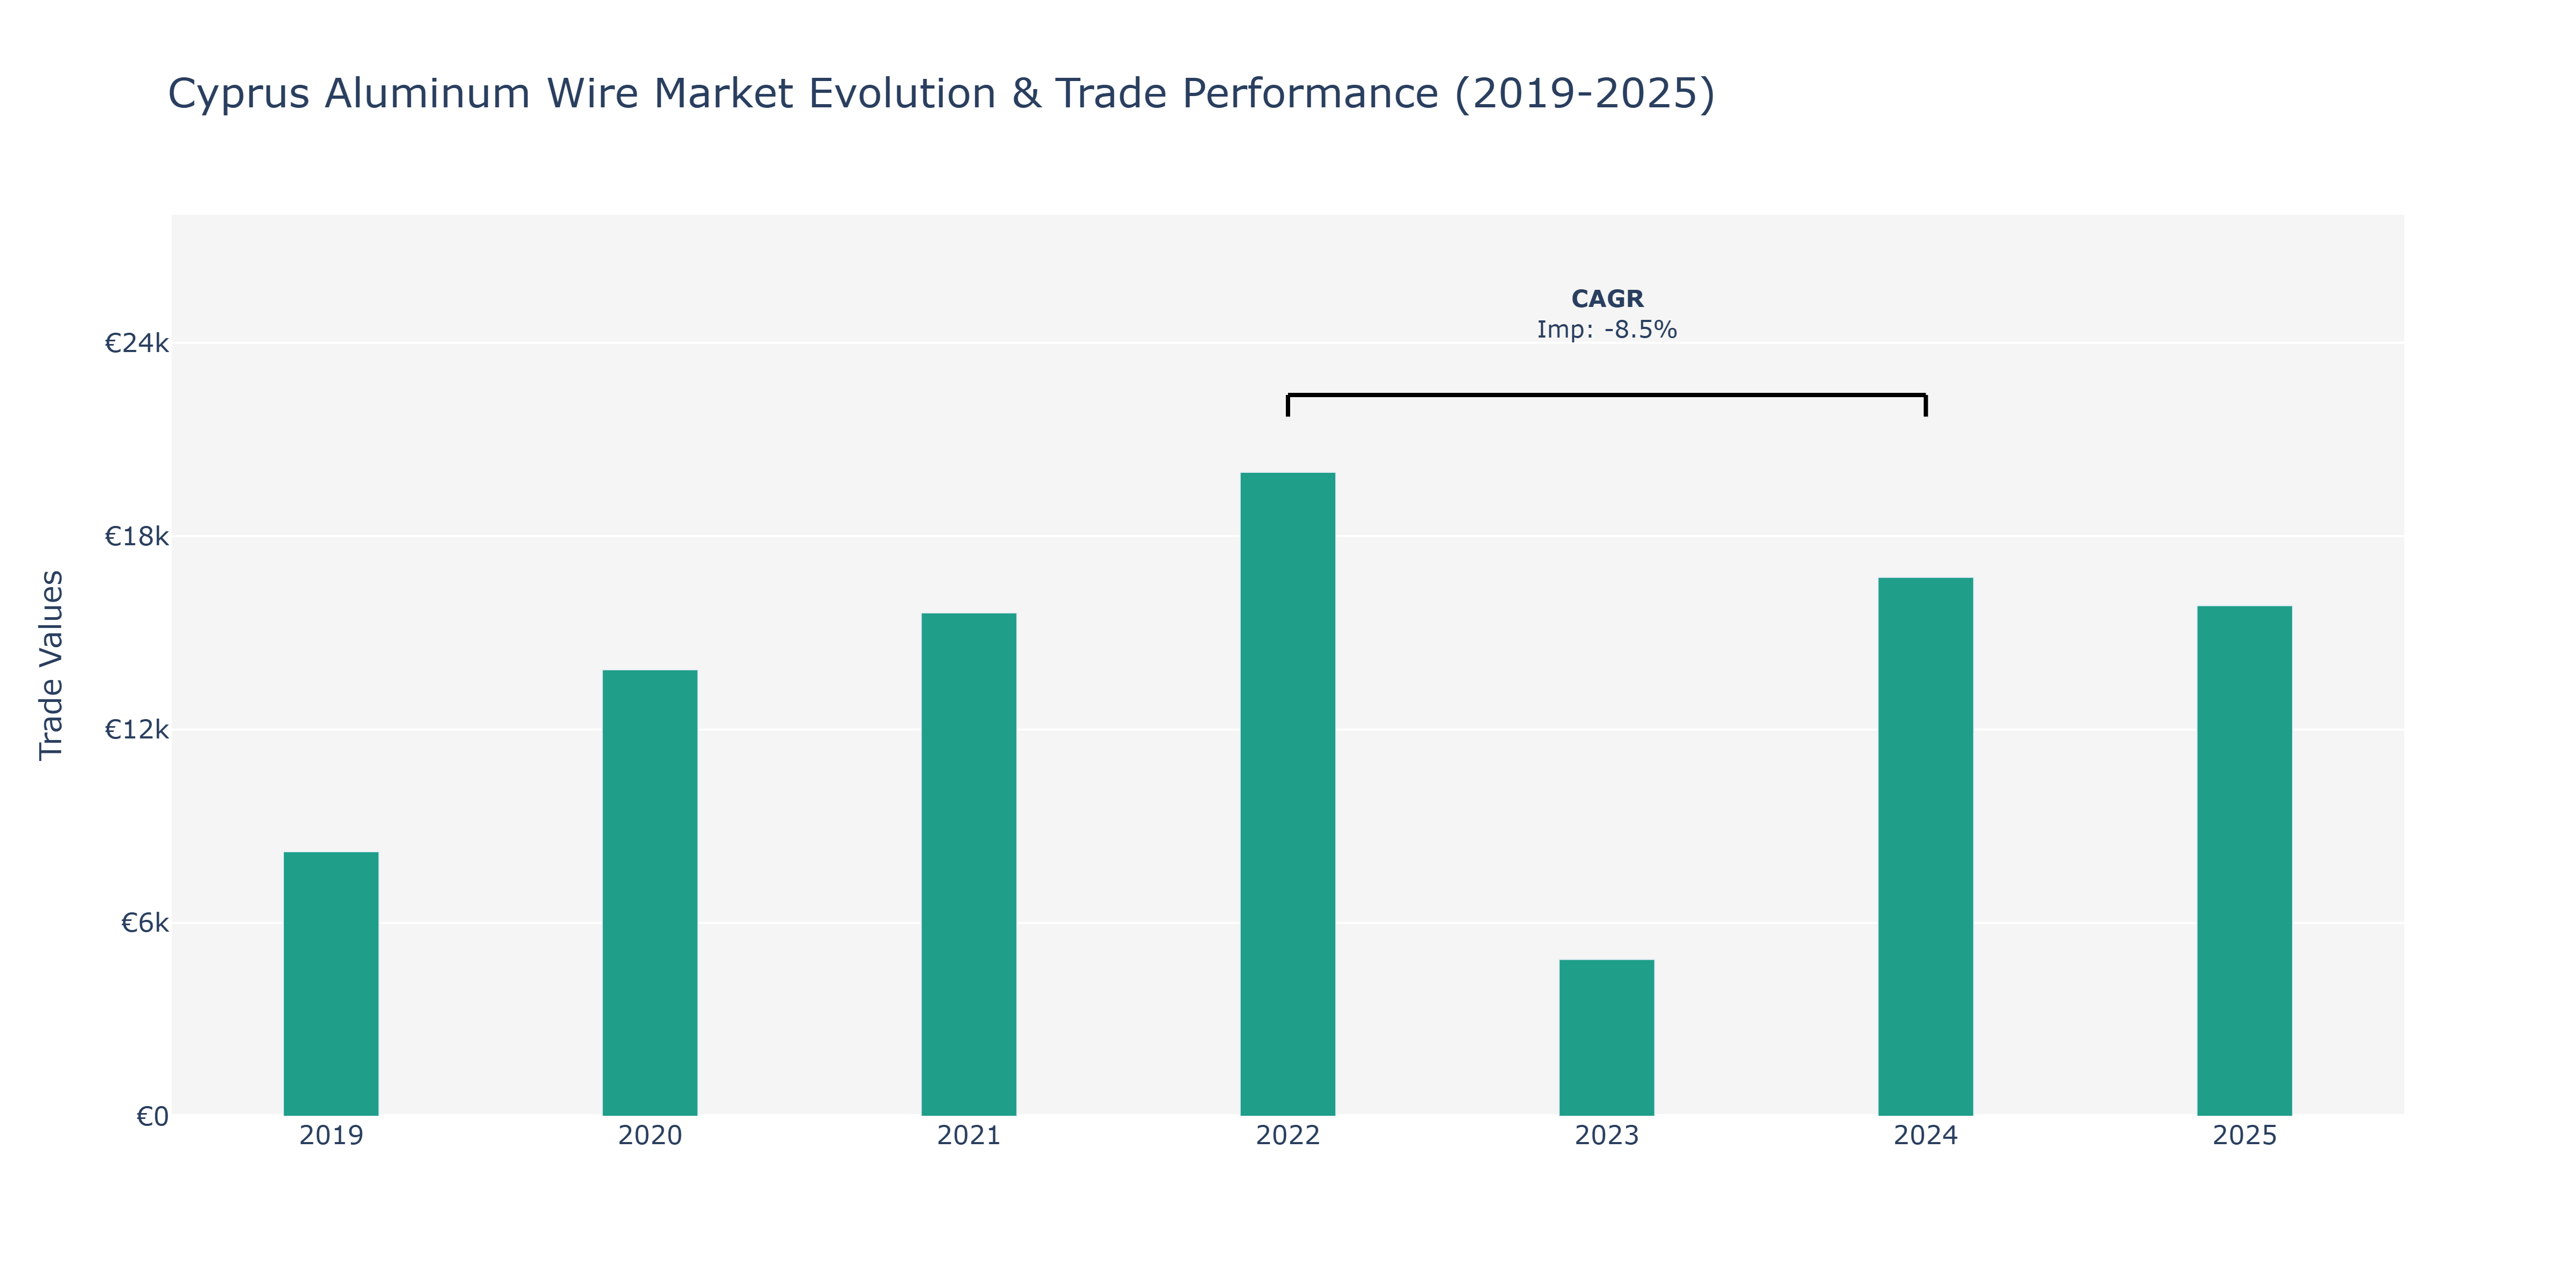
In 2019, Cyprus witnessed imports of aluminum wire amounting to €8.21 thousand, which then surged to €13.85 thousand in 2020, marking a notable increase. The following year, the upward trajectory continued, with imports reaching €15.62 thousand, showcasing sustained growth. However, in 2022, a substantial spike was observed, with imports escalating to €19.98 thousand, reflecting a peak point in the market. The subsequent year, 2023, saw a sharp decline, dropping to €4.87 thousand, before rebounding in 2024 to €16.72 thousand. This fluctuation may be attributed to various factors such as global economic conditions impacting trade volumes and local demand dynamics. The market stabilized in 2025 at around €15.85 thousand, indicating a return to a more consistent import pattern. The decline in 2023 could be linked to temporary market disruptions or shifts in supply chains, emphasizing the need for resilience strategies in the aluminum wire sector to navigate such fluctuations effectively.
Key Highlights of the Report:
- Cyprus Aluminum Wire Market Outlook
- Market Size of Cyprus Aluminum Wire Market, 2024
- Forecast of Cyprus Aluminum Wire Market, 2031
- Historical Data and Forecast of Cyprus Aluminum Wire Revenues & Volume for the Period 2021-2031
- Cyprus Aluminum Wire Market Trend Evolution
- Cyprus Aluminum Wire Market Drivers and Challenges
- Cyprus Aluminum Wire Price Trends
- Cyprus Aluminum Wire Porter`s Five Forces
- Cyprus Aluminum Wire Industry Life Cycle
- Historical Data and Forecast of Cyprus Aluminum Wire Market Revenues & Volume By Grade for the Period 2021-2031
- Historical Data and Forecast of Cyprus Aluminum Wire Market Revenues & Volume By Electrical for the Period 2021-2031
- Historical Data and Forecast of Cyprus Aluminum Wire Market Revenues & Volume By Alloy for the Period 2021-2031
- Historical Data and Forecast of Cyprus Aluminum Wire Market Revenues & Volume By Mechanical for the Period 2021-2031
- Historical Data and Forecast of Cyprus Aluminum Wire Market Revenues & Volume By Product for the Period 2021-2031
- Historical Data and Forecast of Cyprus Aluminum Wire Market Revenues & Volume By Enameled for the Period 2021-2031
- Historical Data and Forecast of Cyprus Aluminum Wire Market Revenues & Volume By Paper Insulated for the Period 2021-2031
- Historical Data and Forecast of Cyprus Aluminum Wire Market Revenues & Volume By Fiber Glass Insulated for the Period 2021-2031
- Historical Data and Forecast of Cyprus Aluminum Wire Market Revenues & Volume By Nomex Insulated for the Period 2021-2031
- Historical Data and Forecast of Cyprus Aluminum Wire Market Revenues & Volume By Mica Insulated for the Period 2021-2031
- Historical Data and Forecast of Cyprus Aluminum Wire Market Revenues & Volume By Cotton Insulated for the Period 2021-2031
- Historical Data and Forecast of Cyprus Aluminum Wire Market Revenues & Volume By Application for the Period 2021-2031
- Historical Data and Forecast of Cyprus Aluminum Wire Market Revenues & Volume By Automobile for the Period 2021-2031
- Historical Data and Forecast of Cyprus Aluminum Wire Market Revenues & Volume By Circuit Breakers for the Period 2021-2031
- Historical Data and Forecast of Cyprus Aluminum Wire Market Revenues & Volume By Switches & Meters for the Period 2021-2031
- Historical Data and Forecast of Cyprus Aluminum Wire Market Revenues & Volume By Home Electrical Appliances for the Period 2021-2031
- Historical Data and Forecast of Cyprus Aluminum Wire Market Revenues & Volume By Motors for the Period 2021-2031
- Historical Data and Forecast of Cyprus Aluminum Wire Market Revenues & Volume By Rotating machine for the Period 2021-2031
- Historical Data and Forecast of Cyprus Aluminum Wire Market Revenues & Volume By Transformers for the Period 2021-2031
- Historical Data and Forecast of Cyprus Aluminum Wire Market Revenues & Volume By Shipping for the Period 2021-2031
- Cyprus Aluminum Wire Import Export Trade Statistics
- Market Opportunity Assessment By Grade
- Market Opportunity Assessment By Product
- Market Opportunity Assessment By Application
- Cyprus Aluminum Wire Top Companies Market Share
- Cyprus Aluminum Wire Competitive Benchmarking By Technical and Operational Parameters
- Cyprus Aluminum Wire Company Profiles
- Cyprus Aluminum Wire Key Strategic Recommendations
Frequently Asked Questions About the Market Study (FAQs):
6Wresearch actively monitors the Cyprus Aluminum Wire Market and publishes its comprehensive annual report, highlighting emerging trends, growth drivers, revenue analysis, and forecast outlook. Our insights help businesses to make data-backed strategic decisions with ongoing market dynamics. Our analysts track relevent industries related to the Cyprus Aluminum Wire Market, allowing our clients with actionable intelligence and reliable forecasts tailored to emerging regional needs.
Yes, we provide customisation as per your requirements. To learn more, feel free to contact us on sales@6wresearch.com
1 Executive Summary |
2 Introduction |
2.1 Key Highlights of the Report |
2.2 Report Description |
2.3 Market Scope & Segmentation |
2.4 Research Methodology |
2.5 Assumptions |
3 Cyprus Aluminum Wire Market Overview |
3.1 Cyprus Country Macro Economic Indicators |
3.2 Cyprus Aluminum Wire Market Revenues & Volume, 2021 & 2031F |
3.3 Cyprus Aluminum Wire Market - Industry Life Cycle |
3.4 Cyprus Aluminum Wire Market - Porter's Five Forces |
3.5 Cyprus Aluminum Wire Market Revenues & Volume Share, By Grade, 2021 & 2031F |
3.6 Cyprus Aluminum Wire Market Revenues & Volume Share, By Product, 2021 & 2031F |
3.7 Cyprus Aluminum Wire Market Revenues & Volume Share, By Application, 2021 & 2031F |
4 Cyprus Aluminum Wire Market Dynamics |
4.1 Impact Analysis |
4.2 Market Drivers |
4.3 Market Restraints |
5 Cyprus Aluminum Wire Market Trends |
6 Cyprus Aluminum Wire Market Segmentations |
6.1 Cyprus Aluminum Wire Market, By Grade |
6.1.1 Overview and Analysis |
6.1.2 Cyprus Aluminum Wire Market Revenues & Volume, By Electrical, 2021-2031F |
6.1.3 Cyprus Aluminum Wire Market Revenues & Volume, By Alloy, 2021-2031F |
6.1.4 Cyprus Aluminum Wire Market Revenues & Volume, By Mechanical, 2021-2031F |
6.2 Cyprus Aluminum Wire Market, By Product |
6.2.1 Overview and Analysis |
6.2.2 Cyprus Aluminum Wire Market Revenues & Volume, By Enameled, 2021-2031F |
6.2.3 Cyprus Aluminum Wire Market Revenues & Volume, By Paper Insulated, 2021-2031F |
6.2.4 Cyprus Aluminum Wire Market Revenues & Volume, By Fiber Glass Insulated, 2021-2031F |
6.2.5 Cyprus Aluminum Wire Market Revenues & Volume, By Nomex Insulated, 2021-2031F |
6.2.6 Cyprus Aluminum Wire Market Revenues & Volume, By Mica Insulated, 2021-2031F |
6.2.7 Cyprus Aluminum Wire Market Revenues & Volume, By Cotton Insulated, 2021-2031F |
6.3 Cyprus Aluminum Wire Market, By Application |
6.3.1 Overview and Analysis |
6.3.2 Cyprus Aluminum Wire Market Revenues & Volume, By Automobile, 2021-2031F |
6.3.3 Cyprus Aluminum Wire Market Revenues & Volume, By Circuit Breakers, 2021-2031F |
6.3.4 Cyprus Aluminum Wire Market Revenues & Volume, By Switches & Meters, 2021-2031F |
6.3.5 Cyprus Aluminum Wire Market Revenues & Volume, By Home Electrical Appliances, 2021-2031F |
6.3.6 Cyprus Aluminum Wire Market Revenues & Volume, By Motors, 2021-2031F |
6.3.7 Cyprus Aluminum Wire Market Revenues & Volume, By Rotating machine, 2021-2031F |
6.3.8 Cyprus Aluminum Wire Market Revenues & Volume, By Shipping, 2021-2031F |
6.3.9 Cyprus Aluminum Wire Market Revenues & Volume, By Shipping, 2021-2031F |
7 Cyprus Aluminum Wire Market Import-Export Trade Statistics |
7.1 Cyprus Aluminum Wire Market Export to Major Countries |
7.2 Cyprus Aluminum Wire Market Imports from Major Countries |
8 Cyprus Aluminum Wire Market Key Performance Indicators |
9 Cyprus Aluminum Wire Market - Opportunity Assessment |
9.1 Cyprus Aluminum Wire Market Opportunity Assessment, By Grade, 2021 & 2031F |
9.2 Cyprus Aluminum Wire Market Opportunity Assessment, By Product, 2021 & 2031F |
9.3 Cyprus Aluminum Wire Market Opportunity Assessment, By Application, 2021 & 2031F |
10 Cyprus Aluminum Wire Market - Competitive Landscape |
10.1 Cyprus Aluminum Wire Market Revenue Share, By Companies, 2024 |
10.2 Cyprus Aluminum Wire Market Competitive Benchmarking, By Operating and Technical Parameters |
11 Company Profiles |
12 Recommendations | 13 Disclaimer |
Global Go To Market Strategy - 2030
Export potential enables firms to identify high-growth global markets with greater confidence by combining advanced trade intelligence with a structured quantitative methodology. The framework analyzes emerging demand trends and country-level import patterns while integrating macroeconomic and trade datasets such as GDP and population forecasts, bilateral import–export flows, tariff structures, elasticity differentials between developed and developing economies, geographic distance, and import demand projections. Using weighted trade values from 2020–2024 as the base period to project country-to-country export potential for 2030, these inputs are operationalized through calculated drivers such as gravity model parameters, tariff impact factors, and projected GDP per-capita growth. Through an analysis of hidden potentials, demand hotspots, and market conditions that are most favorable to success, this method enables firms to focus on target countries, maximize returns, and global expansion with data, backed by accuracy.
By factoring in the projected importer demand gap that is currently unmet and could be potential opportunity, it identifies the potential for the Exporter (Country) among 190 countries, against the general trade analysis, which identifies the biggest importer or exporter.
To discover high-growth global markets and optimize your business strategy:
Click Here
Pricing
- Single User License$ 1,995
- Department License$ 2,400
- Site License$ 3,120
- Global License$ 3,795

Leadership Perspectives from Industry Events
Search
Thought Leadership and Analyst Meet


Our Clients
6WResearch In News
- India Export Attractiveness Tracker 2026
- India Air Conditioner Market Set for Strong Rebound in 2026 After Weather-Led Correction and GST-Driven Recovery: 6Wresearch
- ADAS in India: How Automatic Emergency Braking, Blind Spot Detection & Driver Monitoring are Transforming Road Safety
- Doha a strategic location for EV manufacturing hub: IPA Qatar
- Demand for luxury TVs surging in the GCC, says Samsung
- Empowering Growth: The Thriving Journey of Bangladesh’s Cable Industry
Latest Reports
- Nicaragua RPG Gaming Market (2026-2032)
- New Zealand RPG Gaming Market (2026-2032)
- Netherlands RPG Gaming Market (2026-2032)
- Nauru RPG Gaming Market (2026-2032)
- Namibia RPG Gaming Market (2026-2032)
- Mozambique RPG Gaming Market (2026-2032)
- Montenegro RPG Gaming Market (2026-2032)
- Mongolia RPG Gaming Market (2026-2032)
- Monaco RPG Gaming Market (2026-2032)
- Micronesia RPG Gaming Market (2026-2032)
Industry Events and Analyst Meet

EV India Expo 2026

HIMTEX 2026

India Refining Summit 2026

India EV Show 2026

EV tech India Expo 2026
Whitepaper
- Middle East & Africa Commercial Security Market Click here to view more.
- Middle East & Africa Fire Safety Systems & Equipment Market Click here to view more.
- GCC Drone Market Click here to view more.
- Middle East Lighting Fixture Market Click here to view more.
- GCC Physical & Perimeter Security Market Click here to view more.