Cyprus Bio Plasticizer Market (2025-2031) | Analysis, Share, Forecast, Size, Outlook, Value, Industry, Companies, Trends, Segmentation, Growth & Revenue
Market Forecast By Type (Sebacates, Succinic Acid, Citrates, Glycerol Esters, Others, Epoxides), By Application (Flooring and Walls, Film and Sheet Coverings, Wires and Cables, Coated Fabrics, Consumer Goods, Others) And Competitive Landscape
| Product Code: ETC5667268 | Publication Date: Nov 2023 | Updated Date: Apr 2026 | Product Type: Market Research Report | |
| Publisher: 6Wresearch | Author: Ravi Bhandari | No. of Pages: 60 | No. of Figures: 30 | No. of Tables: 5 |
Cyprus Bio Plasticizer Market Size (2020-2030)
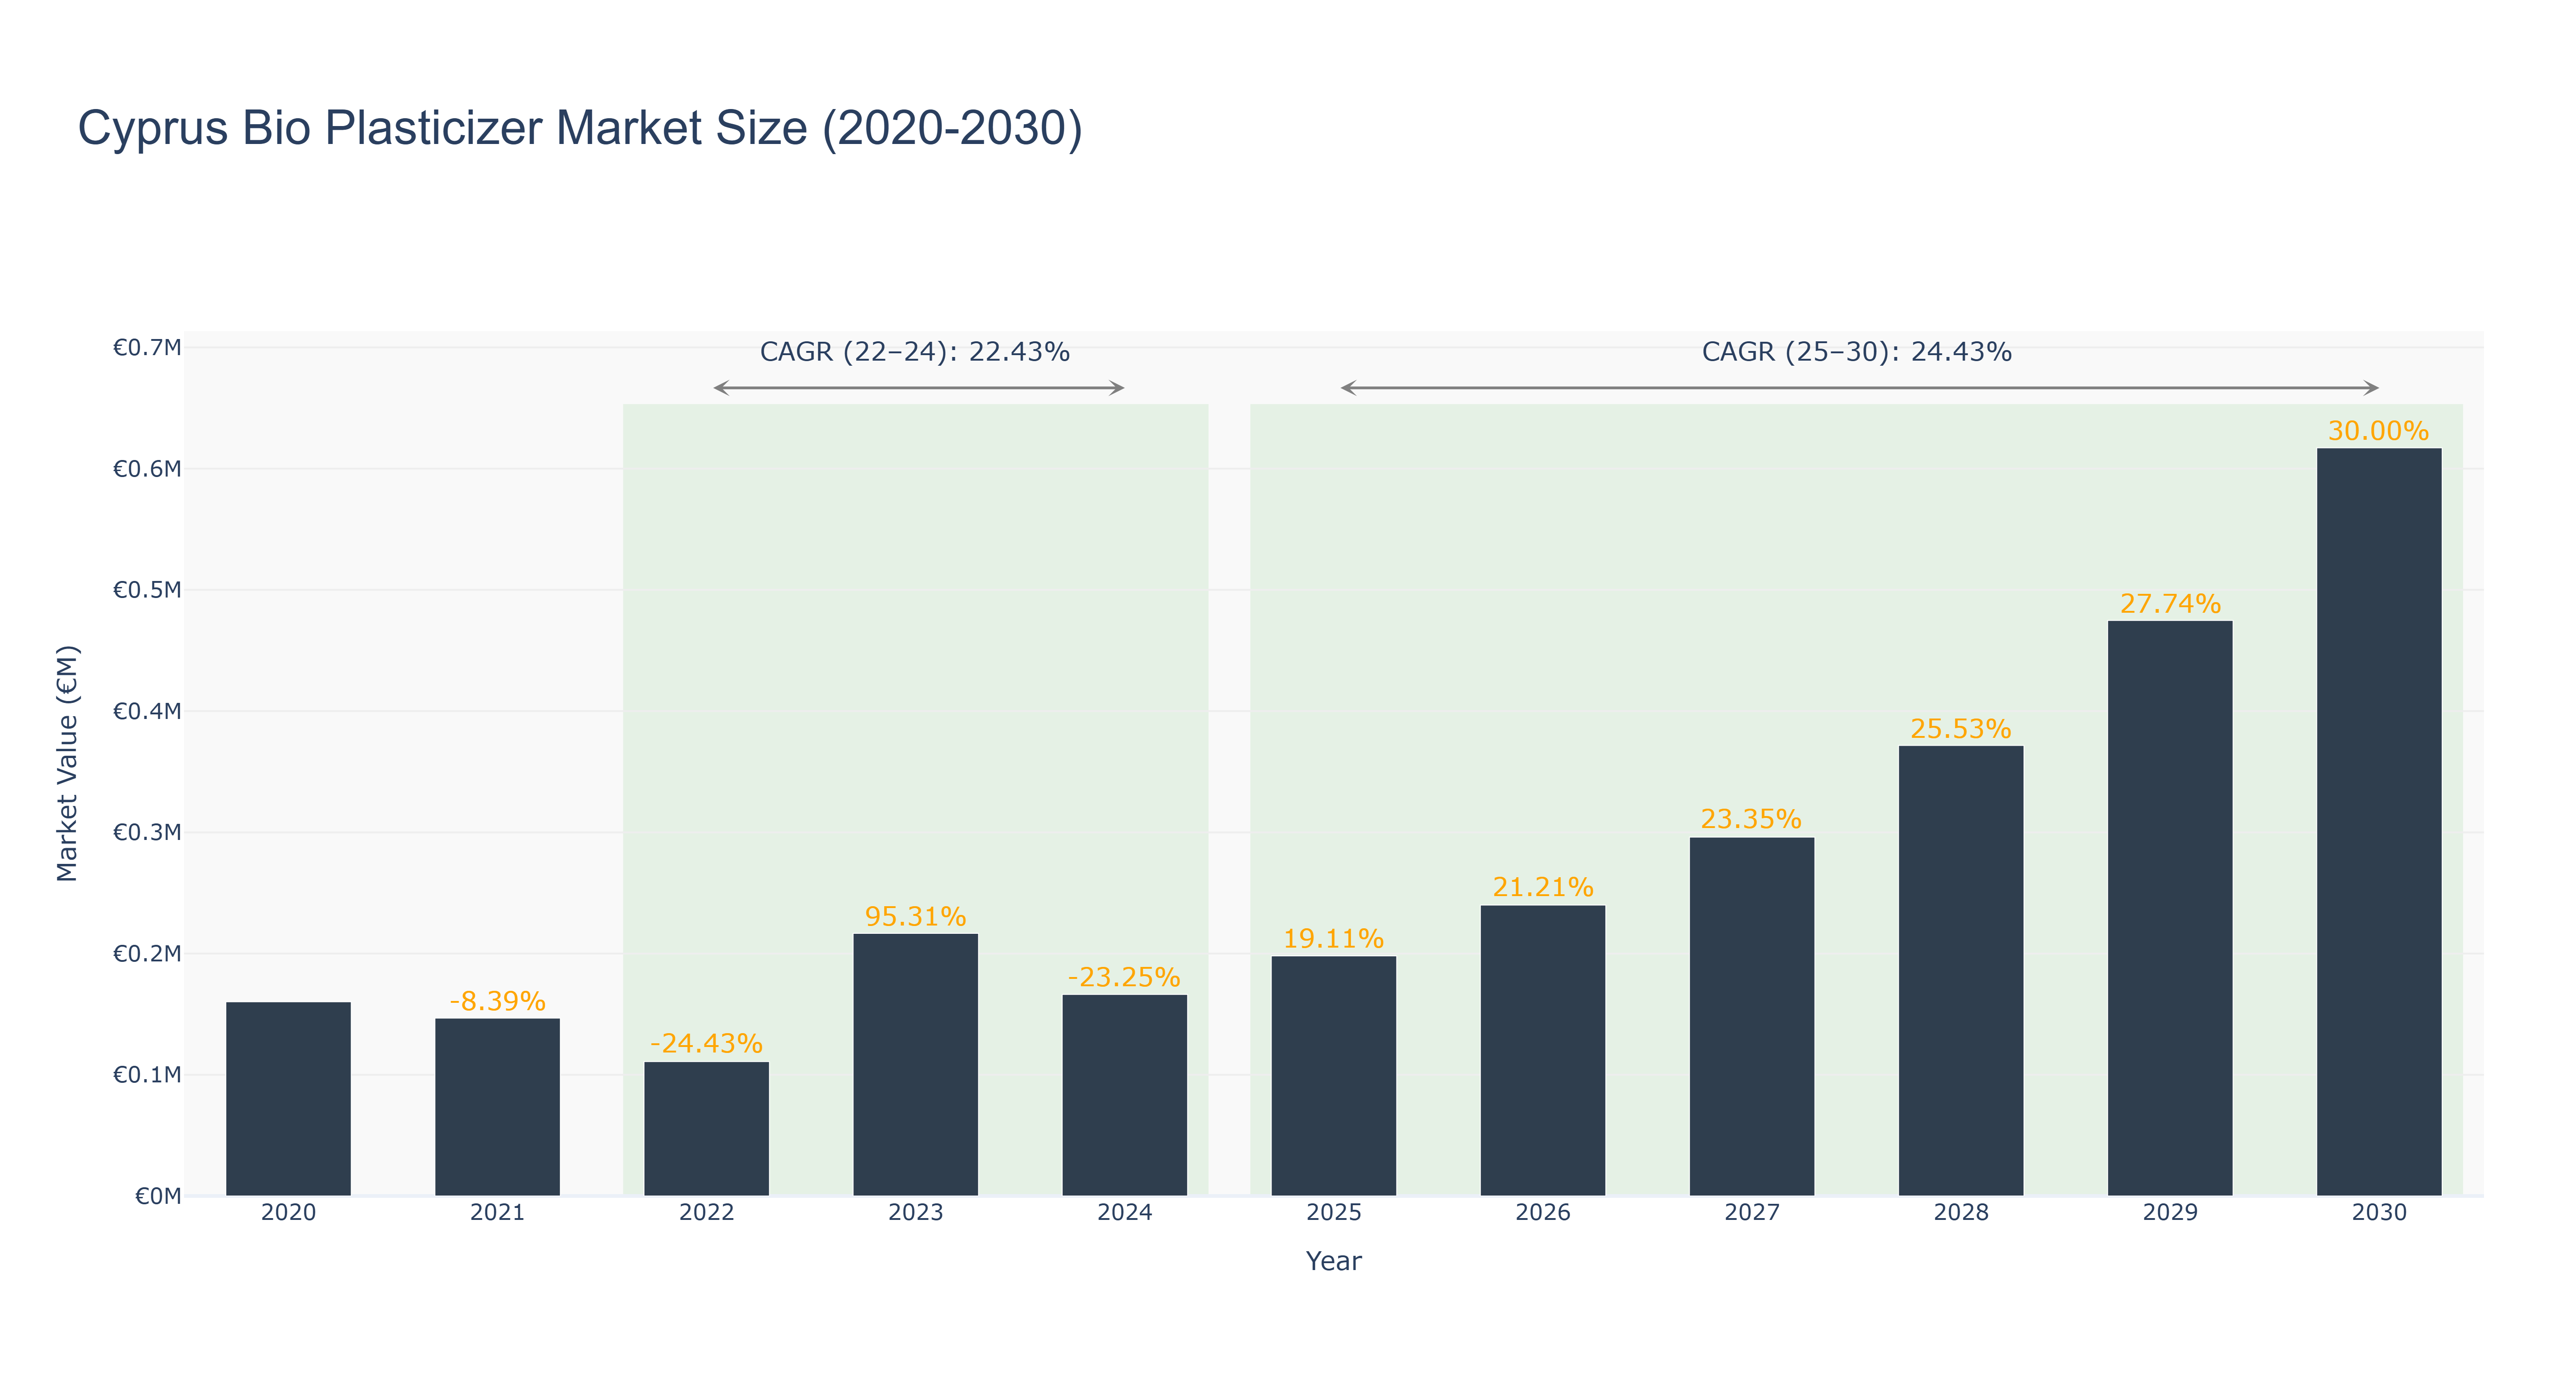
The Cyprus Bio Plasticizer Market experienced a fluctuating trend from 2020 to 2030. The market peaked at €0.62 million in 2030, showcasing a robust growth trajectory. The actual market size saw a decline from €0.16 million in 2020 to €0.17 million in 2024, attributed to economic uncertainties and market saturation. However, a significant recovery was witnessed from 2025 onwards, with forecasted growth reaching €0.47 million in 2029, driven by increasing demand for eco-friendly alternatives. The CAGR for the period 2022-24 stood at 22.43%, while for 2025-30, it surged to 24.43%, indicating a promising outlook for the market. Recent developments in sustainable packaging initiatives and collaborations with key industry players are set to bolster market growth further in the coming years.
Cyprus Bio Plasticizer Market: Production & Trade Performance (2019-2025)
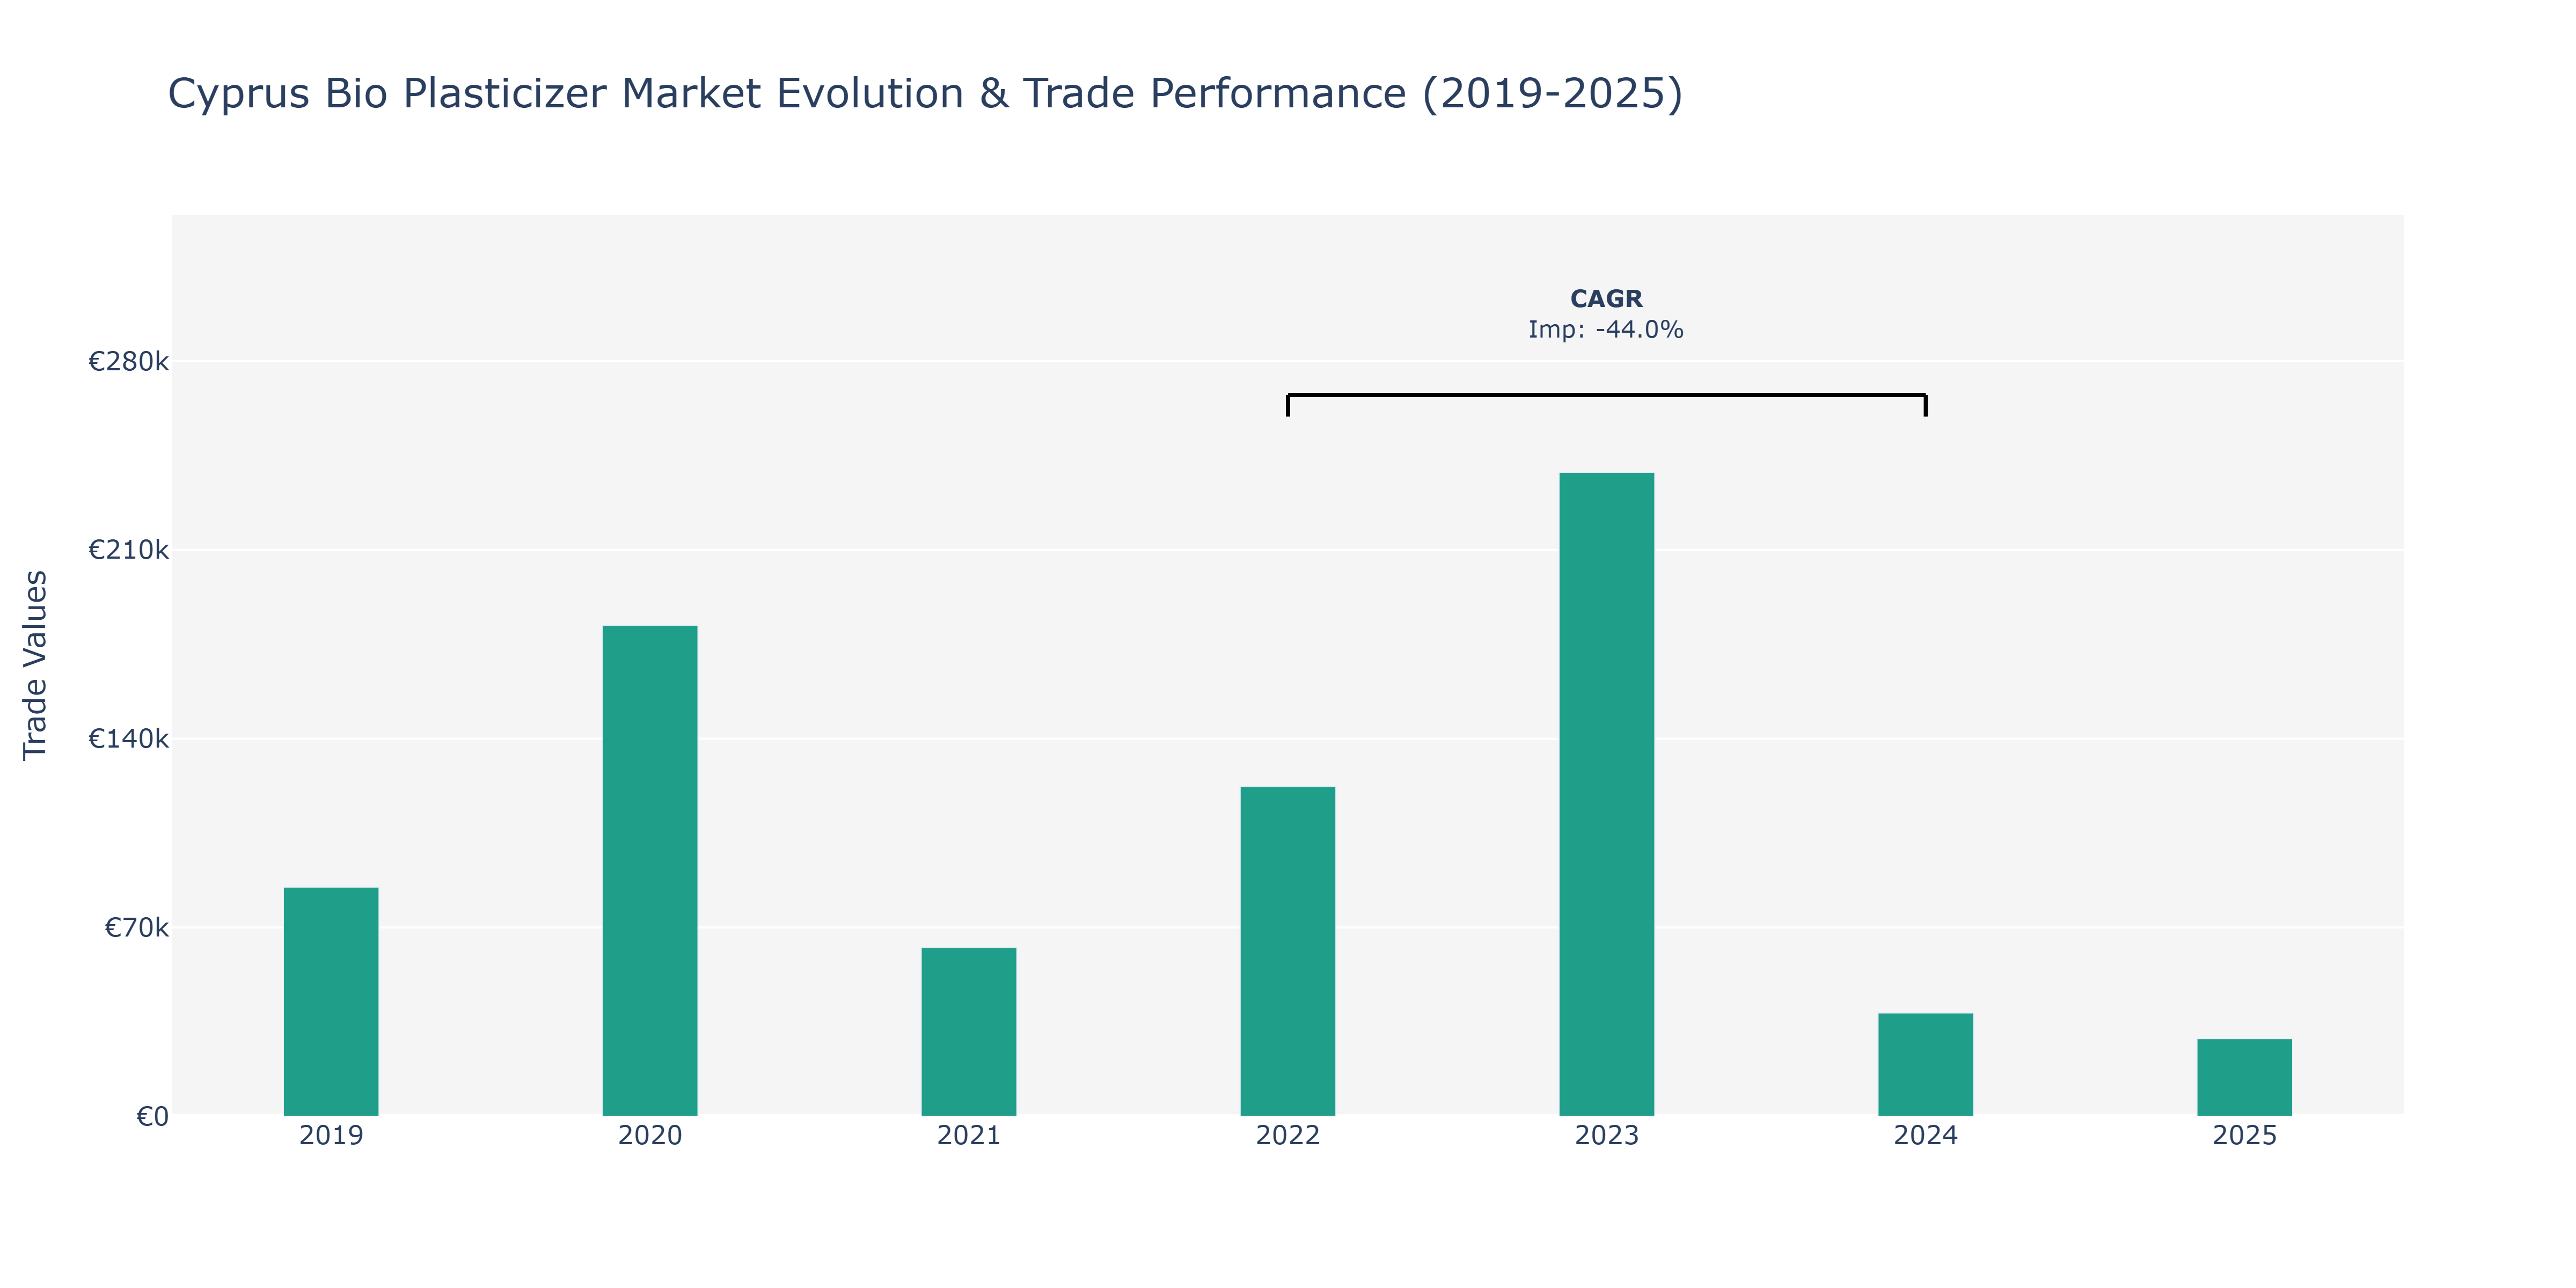
Imports in the Cyprus Bio Plasticizer Market saw fluctuations over the analyzed period. In 2019, imports were at €84.98 thousand, showing a substantial increase to €182.04 thousand in 2020. The market experienced a sharp decline in 2021, with imports falling to €62.59 thousand. However, a strong rebound occurred in 2023, reaching €238.77 thousand, only to drop significantly to €38.33 thousand in 2024 and further down to €28.81 thousand in 2025. The market's volatility can be attributed to various factors such as changes in regulatory policies, global economic conditions, and shifts in consumer preferences towards eco-friendly products. The negative CAGR of -44.01% from 2022 to 2024 indicates a challenging period for the market, possibly influenced by supply chain disruptions or competitive pricing strategies. Moving forward, stakeholders in the Cyprus Bio Plasticizer Market may need to focus on enhancing resilience to external shocks and exploring sustainable sourcing practices to navigate future uncertainties.
Key Highlights of the Report:
- Cyprus Bio Plasticizer Market Outlook
- Market Size of Cyprus Bio Plasticizer Market, 2024
- Forecast of Cyprus Bio Plasticizer Market, 2031
- Historical Data and Forecast of Cyprus Bio Plasticizer Revenues & Volume for the Period 2021-2031
- Cyprus Bio Plasticizer Market Trend Evolution
- Cyprus Bio Plasticizer Market Drivers and Challenges
- Cyprus Bio Plasticizer Price Trends
- Cyprus Bio Plasticizer Porter`s Five Forces
- Cyprus Bio Plasticizer Industry Life Cycle
- Historical Data and Forecast of Cyprus Bio Plasticizer Market Revenues & Volume By Type for the Period 2021-2031
- Historical Data and Forecast of Cyprus Bio Plasticizer Market Revenues & Volume By Sebacates for the Period 2021-2031
- Historical Data and Forecast of Cyprus Bio Plasticizer Market Revenues & Volume By Succinic Acid for the Period 2021-2031
- Historical Data and Forecast of Cyprus Bio Plasticizer Market Revenues & Volume By Citrates for the Period 2021-2031
- Historical Data and Forecast of Cyprus Bio Plasticizer Market Revenues & Volume By Glycerol Esters for the Period 2021-2031
- Historical Data and Forecast of Cyprus Bio Plasticizer Market Revenues & Volume By Others for the Period 2021-2031
- Historical Data and Forecast of Cyprus Bio Plasticizer Market Revenues & Volume By Epoxides for the Period 2021-2031
- Historical Data and Forecast of Cyprus Bio Plasticizer Market Revenues & Volume By Application for the Period 2021-2031
- Historical Data and Forecast of Cyprus Bio Plasticizer Market Revenues & Volume By Flooring and Walls for the Period 2021-2031
- Historical Data and Forecast of Cyprus Bio Plasticizer Market Revenues & Volume By Film and Sheet Coverings for the Period 2021-2031
- Historical Data and Forecast of Cyprus Bio Plasticizer Market Revenues & Volume By Wires and Cables for the Period 2021-2031
- Historical Data and Forecast of Cyprus Bio Plasticizer Market Revenues & Volume By Coated Fabrics for the Period 2021-2031
- Historical Data and Forecast of Cyprus Bio Plasticizer Market Revenues & Volume By Consumer Goods for the Period 2021-2031
- Historical Data and Forecast of Cyprus Bio Plasticizer Market Revenues & Volume By Others for the Period 2021-2031
- Cyprus Bio Plasticizer Import Export Trade Statistics
- Market Opportunity Assessment By Type
- Market Opportunity Assessment By Application
- Cyprus Bio Plasticizer Top Companies Market Share
- Cyprus Bio Plasticizer Competitive Benchmarking By Technical and Operational Parameters
- Cyprus Bio Plasticizer Company Profiles
- Cyprus Bio Plasticizer Key Strategic Recommendations
Frequently Asked Questions About the Market Study (FAQs):
6Wresearch actively monitors the Cyprus Bio Plasticizer Market and publishes its comprehensive annual report, highlighting emerging trends, growth drivers, revenue analysis, and forecast outlook. Our insights help businesses to make data-backed strategic decisions with ongoing market dynamics. Our analysts track relevent industries related to the Cyprus Bio Plasticizer Market, allowing our clients with actionable intelligence and reliable forecasts tailored to emerging regional needs.
Yes, we provide customisation as per your requirements. To learn more, feel free to contact us on sales@6wresearch.com
1 Executive Summary |
2 Introduction |
2.1 Key Highlights of the Report |
2.2 Report Description |
2.3 Market Scope & Segmentation |
2.4 Research Methodology |
2.5 Assumptions |
3 Cyprus Bio Plasticizer Market Overview |
3.1 Cyprus Country Macro Economic Indicators |
3.2 Cyprus Bio Plasticizer Market Revenues & Volume, 2021 & 2031F |
3.3 Cyprus Bio Plasticizer Market - Industry Life Cycle |
3.4 Cyprus Bio Plasticizer Market - Porter's Five Forces |
3.5 Cyprus Bio Plasticizer Market Revenues & Volume Share, By Type, 2021 & 2031F |
3.6 Cyprus Bio Plasticizer Market Revenues & Volume Share, By Application, 2021 & 2031F |
4 Cyprus Bio Plasticizer Market Dynamics |
4.1 Impact Analysis |
4.2 Market Drivers |
4.3 Market Restraints |
5 Cyprus Bio Plasticizer Market Trends |
6 Cyprus Bio Plasticizer Market Segmentations |
6.1 Cyprus Bio Plasticizer Market, By Type |
6.1.1 Overview and Analysis |
6.1.2 Cyprus Bio Plasticizer Market Revenues & Volume, By Sebacates, 2021-2031F |
6.1.3 Cyprus Bio Plasticizer Market Revenues & Volume, By Succinic Acid, 2021-2031F |
6.1.4 Cyprus Bio Plasticizer Market Revenues & Volume, By Citrates, 2021-2031F |
6.1.5 Cyprus Bio Plasticizer Market Revenues & Volume, By Glycerol Esters, 2021-2031F |
6.1.6 Cyprus Bio Plasticizer Market Revenues & Volume, By Others, 2021-2031F |
6.1.7 Cyprus Bio Plasticizer Market Revenues & Volume, By Epoxides, 2021-2031F |
6.2 Cyprus Bio Plasticizer Market, By Application |
6.2.1 Overview and Analysis |
6.2.2 Cyprus Bio Plasticizer Market Revenues & Volume, By Flooring and Walls, 2021-2031F |
6.2.3 Cyprus Bio Plasticizer Market Revenues & Volume, By Film and Sheet Coverings, 2021-2031F |
6.2.4 Cyprus Bio Plasticizer Market Revenues & Volume, By Wires and Cables, 2021-2031F |
6.2.5 Cyprus Bio Plasticizer Market Revenues & Volume, By Coated Fabrics, 2021-2031F |
6.2.6 Cyprus Bio Plasticizer Market Revenues & Volume, By Consumer Goods, 2021-2031F |
6.2.7 Cyprus Bio Plasticizer Market Revenues & Volume, By Others, 2021-2031F |
7 Cyprus Bio Plasticizer Market Import-Export Trade Statistics |
7.1 Cyprus Bio Plasticizer Market Export to Major Countries |
7.2 Cyprus Bio Plasticizer Market Imports from Major Countries |
8 Cyprus Bio Plasticizer Market Key Performance Indicators |
9 Cyprus Bio Plasticizer Market - Opportunity Assessment |
9.1 Cyprus Bio Plasticizer Market Opportunity Assessment, By Type, 2021 & 2031F |
9.2 Cyprus Bio Plasticizer Market Opportunity Assessment, By Application, 2021 & 2031F |
10 Cyprus Bio Plasticizer Market - Competitive Landscape |
10.1 Cyprus Bio Plasticizer Market Revenue Share, By Companies, 2024 |
10.2 Cyprus Bio Plasticizer Market Competitive Benchmarking, By Operating and Technical Parameters |
11 Company Profiles |
12 Recommendations | 13 Disclaimer |
Global Go To Market Strategy - 2030
Export potential enables firms to identify high-growth global markets with greater confidence by combining advanced trade intelligence with a structured quantitative methodology. The framework analyzes emerging demand trends and country-level import patterns while integrating macroeconomic and trade datasets such as GDP and population forecasts, bilateral import–export flows, tariff structures, elasticity differentials between developed and developing economies, geographic distance, and import demand projections. Using weighted trade values from 2020–2024 as the base period to project country-to-country export potential for 2030, these inputs are operationalized through calculated drivers such as gravity model parameters, tariff impact factors, and projected GDP per-capita growth. Through an analysis of hidden potentials, demand hotspots, and market conditions that are most favorable to success, this method enables firms to focus on target countries, maximize returns, and global expansion with data, backed by accuracy.
By factoring in the projected importer demand gap that is currently unmet and could be potential opportunity, it identifies the potential for the Exporter (Country) among 190 countries, against the general trade analysis, which identifies the biggest importer or exporter.
To discover high-growth global markets and optimize your business strategy:
Click Here
Pricing
- Single User License$ 1,995
- Department License$ 2,400
- Site License$ 3,120
- Global License$ 3,795

Leadership Perspectives from Industry Events
Search
Thought Leadership and Analyst Meet


Our Clients
6WResearch In News
- India Export Attractiveness Tracker 2026
- India Air Conditioner Market Set for Strong Rebound in 2026 After Weather-Led Correction and GST-Driven Recovery: 6Wresearch
- ADAS in India: How Automatic Emergency Braking, Blind Spot Detection & Driver Monitoring are Transforming Road Safety
- Doha a strategic location for EV manufacturing hub: IPA Qatar
- Demand for luxury TVs surging in the GCC, says Samsung
- Empowering Growth: The Thriving Journey of Bangladesh’s Cable Industry
Latest Reports
- Nicaragua RPG Gaming Market (2026-2032)
- New Zealand RPG Gaming Market (2026-2032)
- Netherlands RPG Gaming Market (2026-2032)
- Nauru RPG Gaming Market (2026-2032)
- Namibia RPG Gaming Market (2026-2032)
- Mozambique RPG Gaming Market (2026-2032)
- Montenegro RPG Gaming Market (2026-2032)
- Mongolia RPG Gaming Market (2026-2032)
- Monaco RPG Gaming Market (2026-2032)
- Micronesia RPG Gaming Market (2026-2032)
Industry Events and Analyst Meet

EV India Expo 2026

HIMTEX 2026

India Refining Summit 2026

India EV Show 2026

EV tech India Expo 2026
Whitepaper
- Middle East & Africa Commercial Security Market Click here to view more.
- Middle East & Africa Fire Safety Systems & Equipment Market Click here to view more.
- GCC Drone Market Click here to view more.
- Middle East Lighting Fixture Market Click here to view more.
- GCC Physical & Perimeter Security Market Click here to view more.