Cyprus Epichlorohydrin (ECH) Market (2025-2031) | Size, Revenue, Companies, Segmentation, Growth, Trends, Analysis, Forecast, Industry, Share, Value & Outlook
Market Forecast By Applications (Epoxy Resins, Synthetic Glycerin, Water Treatment Chemicals, Pharmaceuticals), By End Use (Paints & Applications, Electrical & Electronics, Construction, Wind Turbine, Composites, Adhesives, Others) And Competitive Landscape
| Product Code: ETC5690277 | Publication Date: Nov 2023 | Updated Date: Apr 2026 | Product Type: Market Research Report | |
| Publisher: 6Wresearch | Author: Ravi Bhandari | No. of Pages: 60 | No. of Figures: 30 | No. of Tables: 5 |
Cyprus Epichlorohydrin (Ech) Market Size (2020-2030)
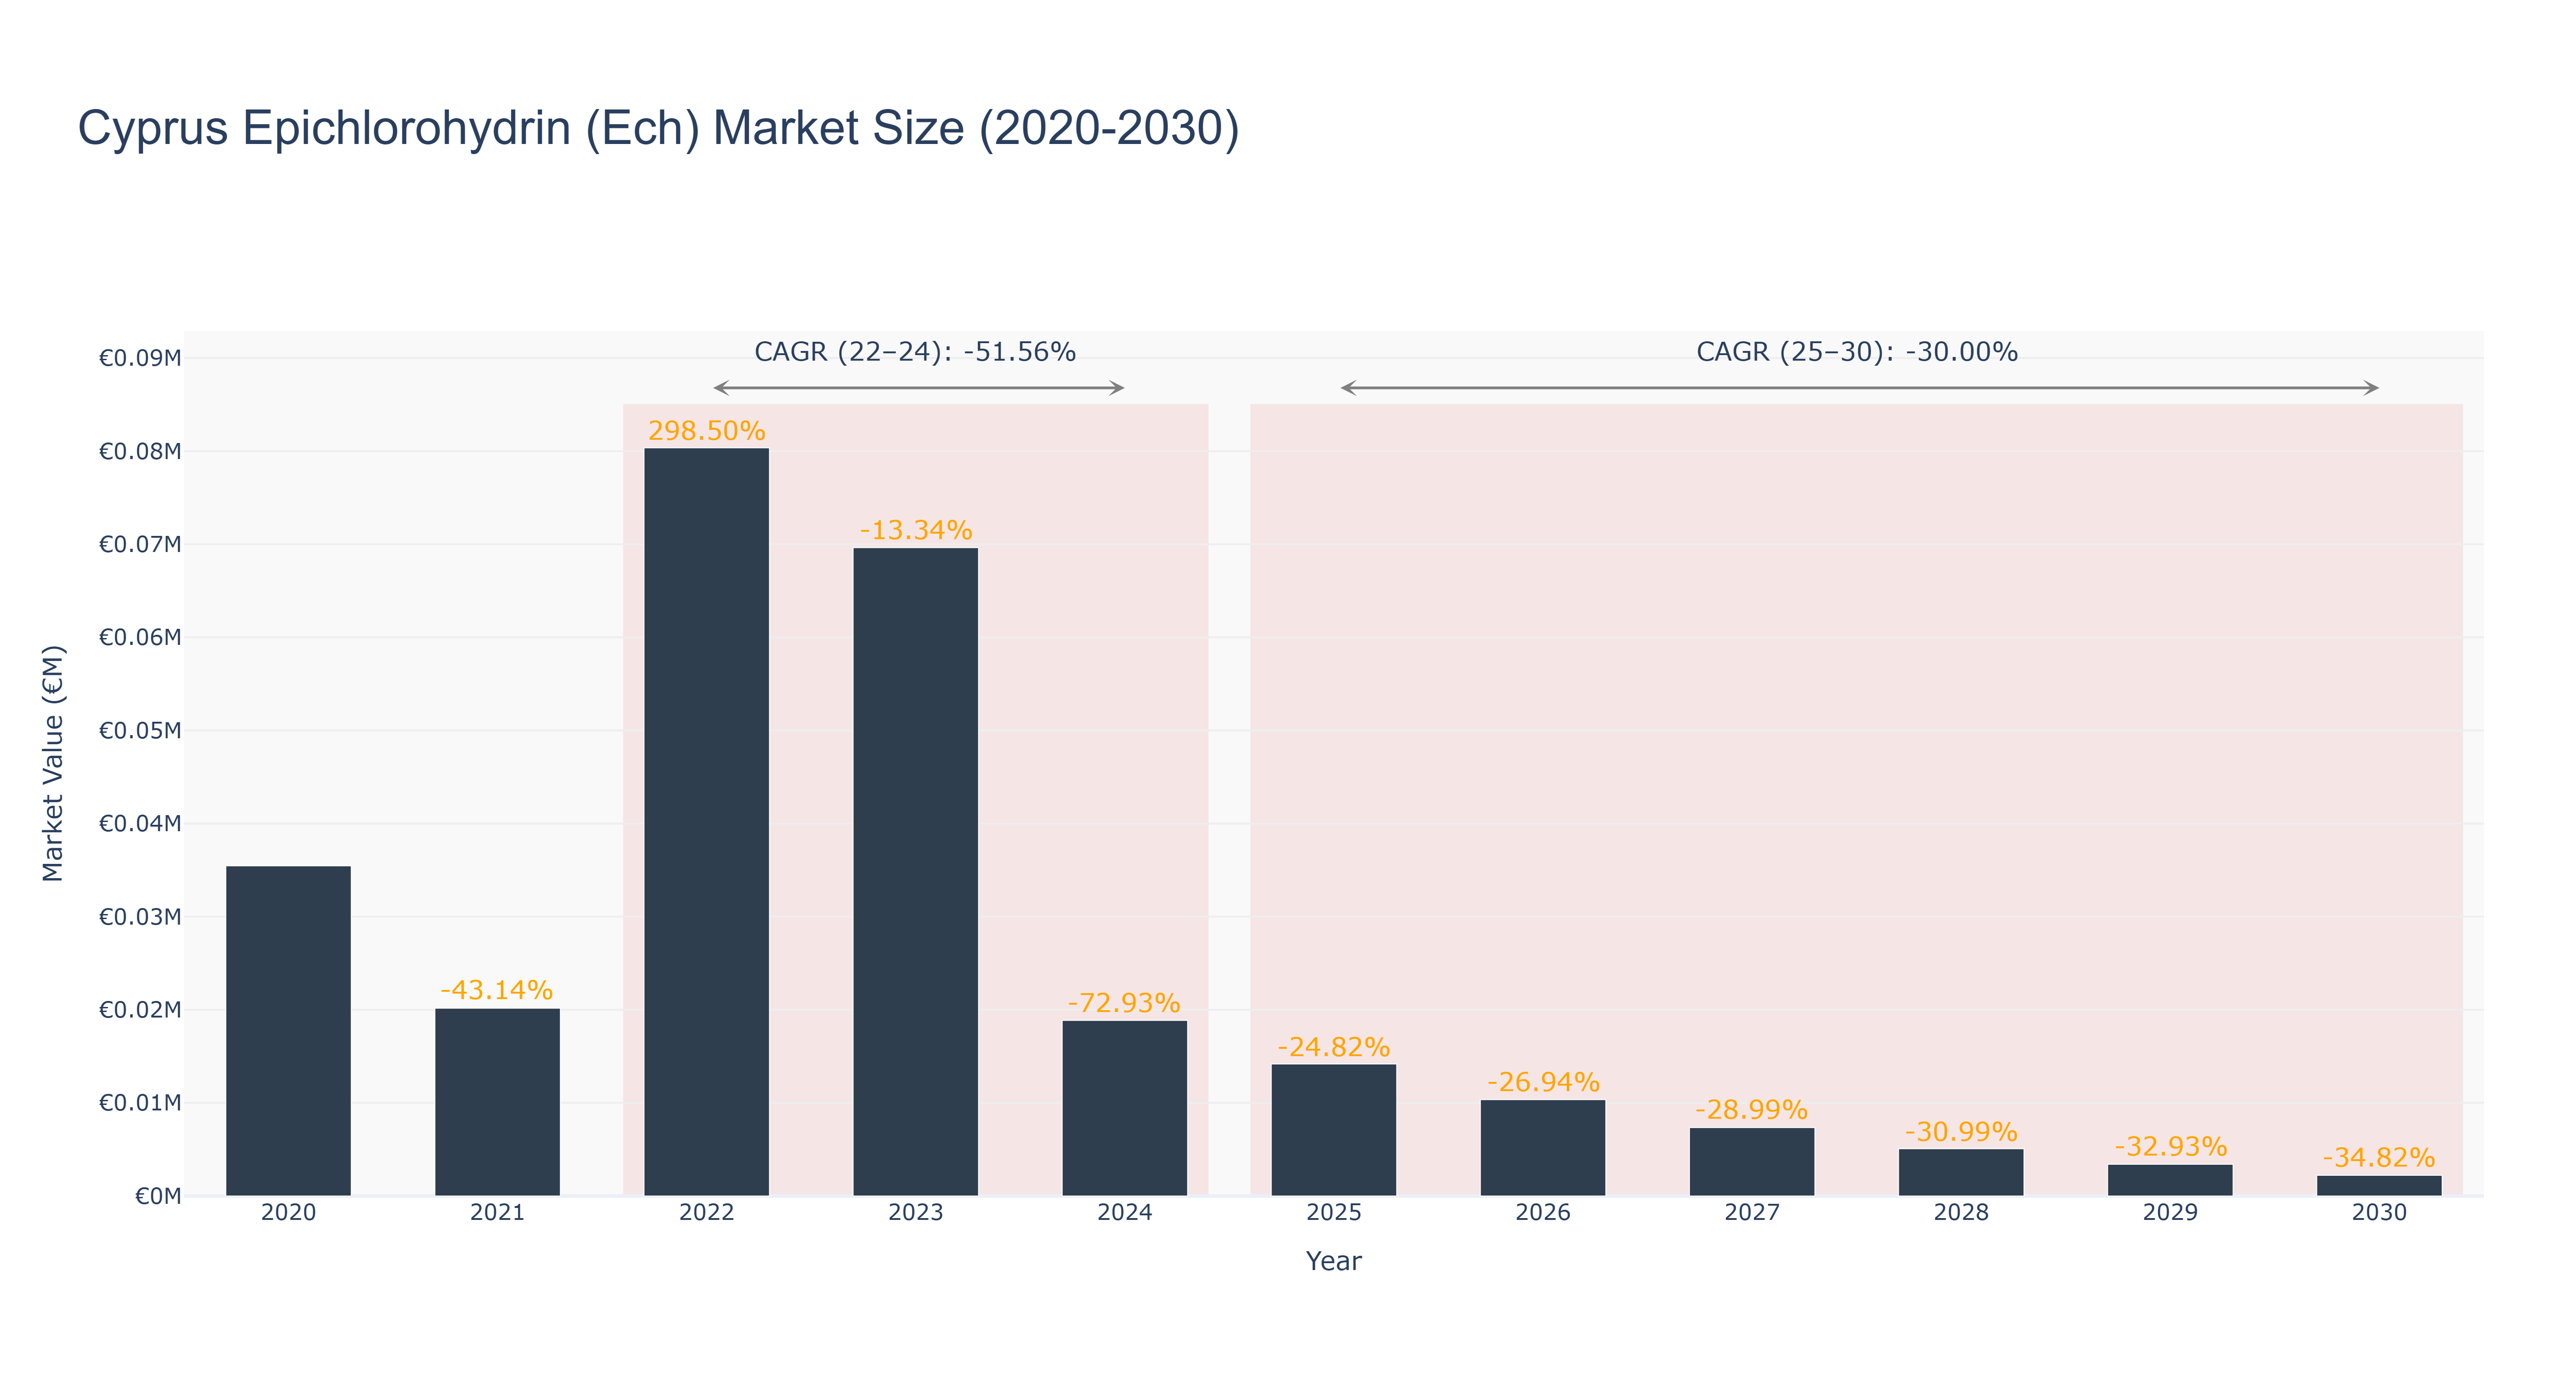
The Cyprus Epichlorohydrin (Ech) Market has exhibited significant volatility, peaking in 2022 with a market size of €80.36 thousand, following a dramatic decline to €20.17 thousand in 2021. The actual market experienced a CAGR of -51.56% from 2022 to 2024, with a notable drop to €18.86 thousand in 2024. This decline can be attributed to fluctuating demand and potential supply chain disruptions. Looking ahead, the forecasted period from 2025 to 2030 suggests a continued contraction, with projected market sizes decreasing from €14.17 thousand in 2025 to €2.22 thousand by 2030, reflecting a CAGR of -30.00%. The anticipated downturn may be influenced by increasing competition and a shift towards alternative chemicals. While no specific upcoming projects have been identified, broader macroeconomic factors and industry shifts will likely shape the market's trajectory in the coming years.
Cyprus Epichlorohydrin (Ech) Market: Production & Trade Performance (2019-2025)
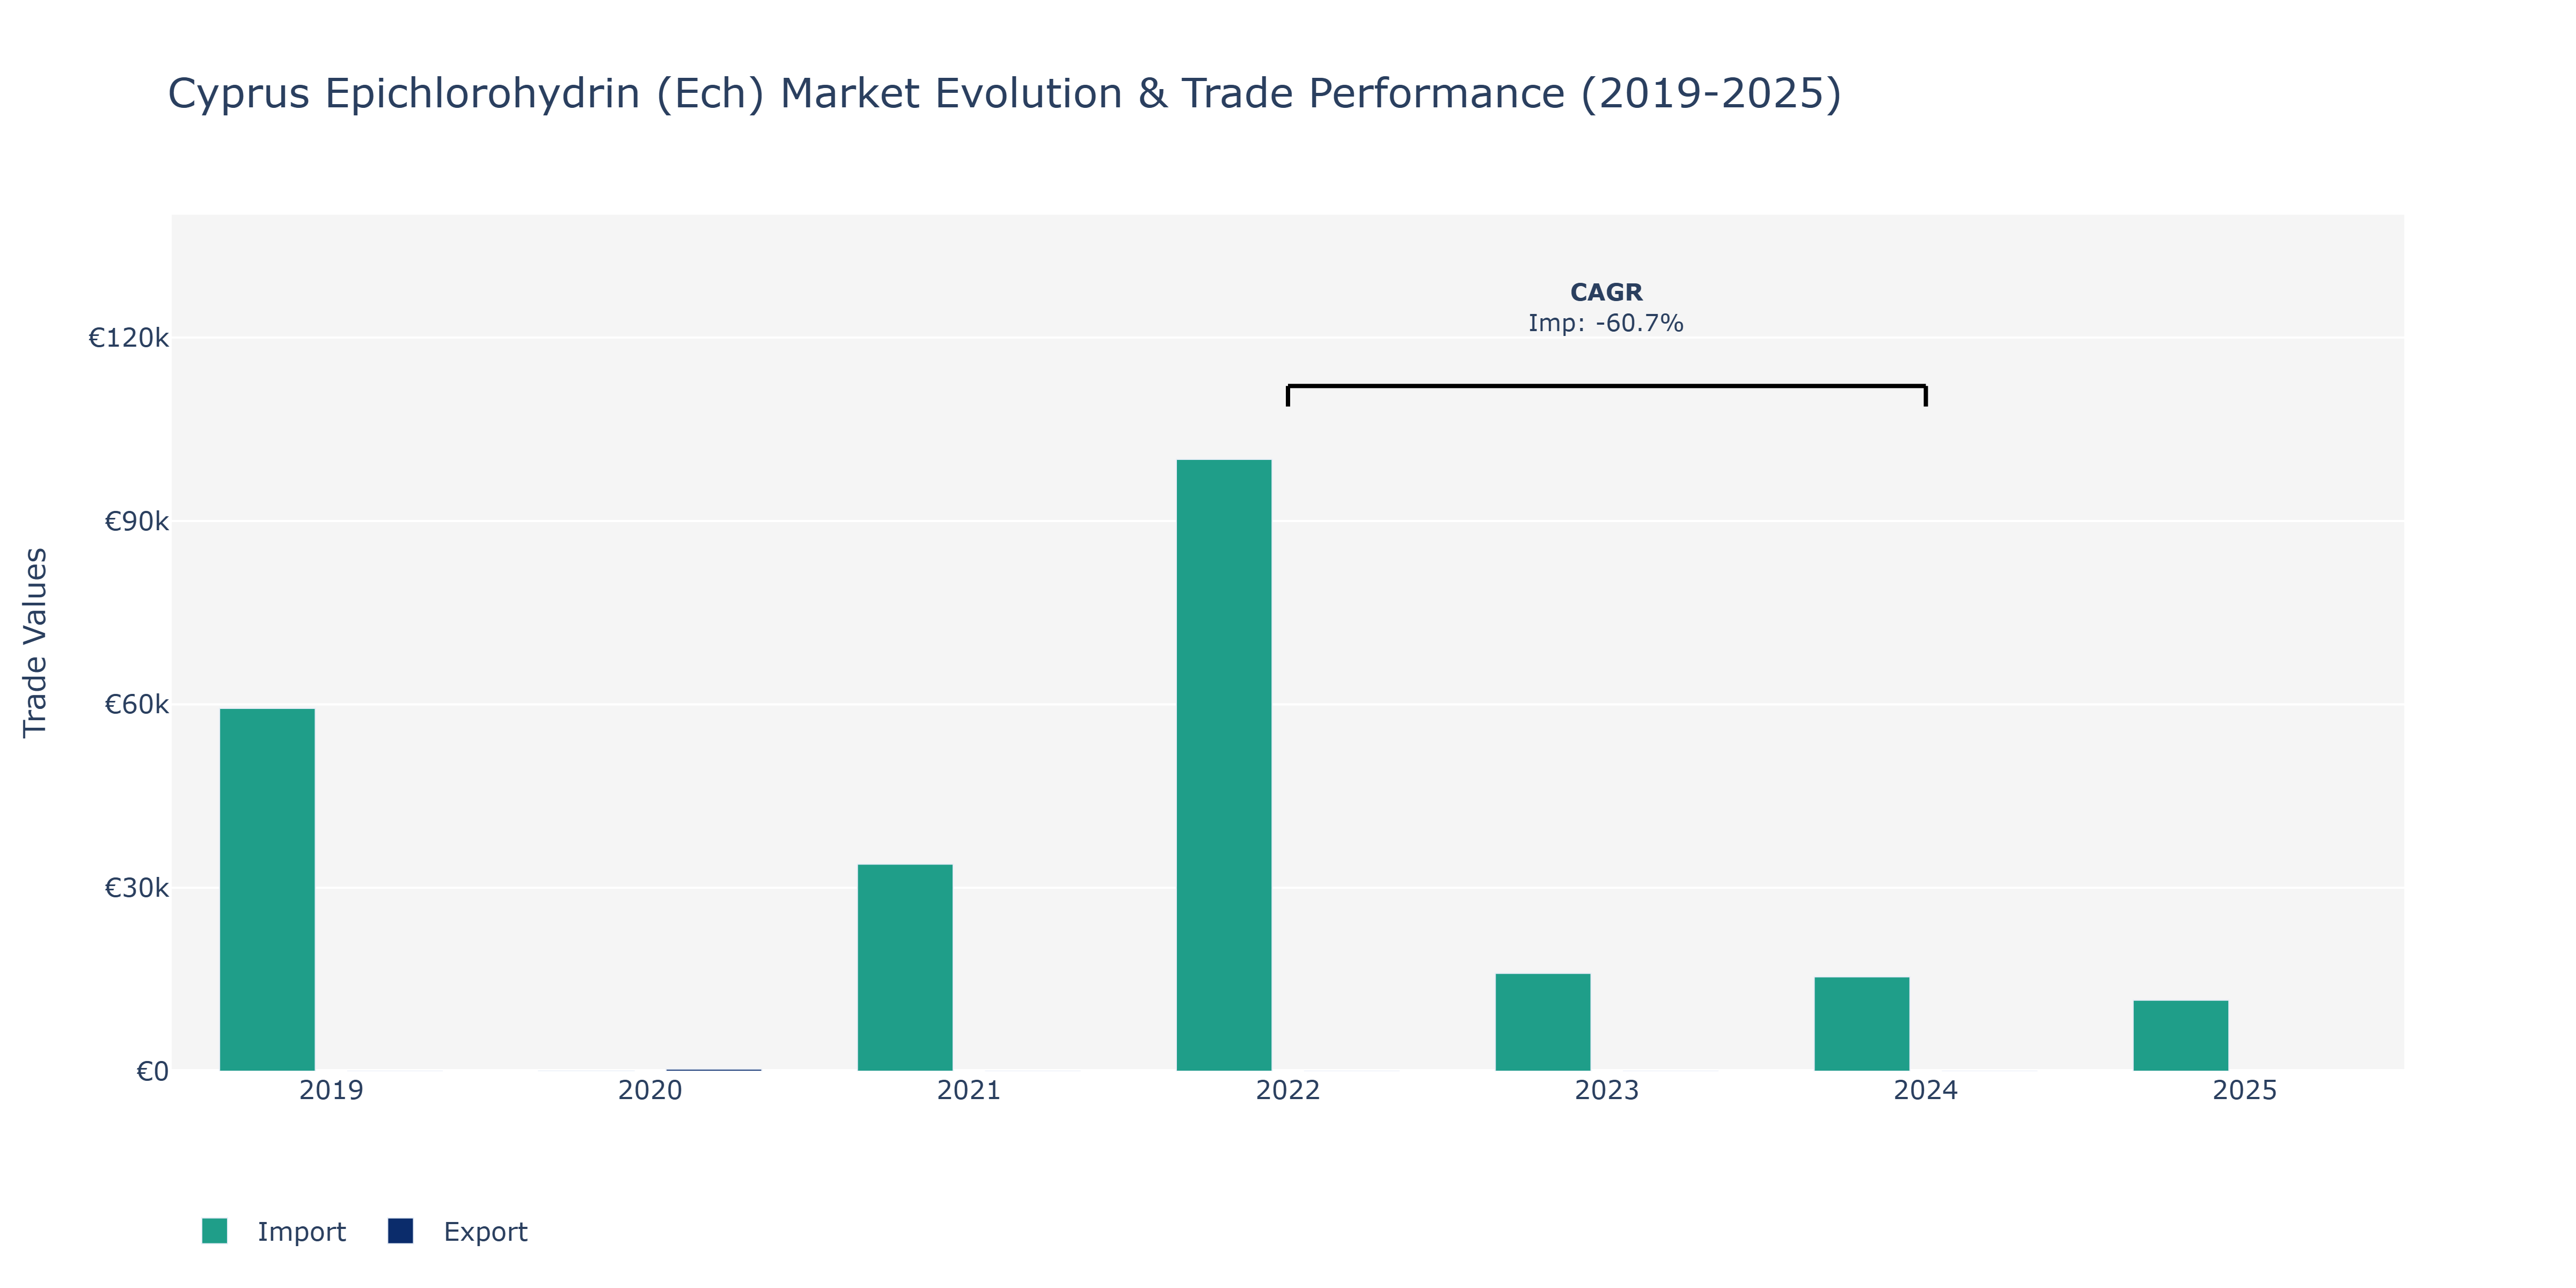
The Cyprus Epichlorohydrin (Ech) Market witnessed notable fluctuations in imports over the given period. In 2019, imports amounted to €59.35 thousand, experiencing a substantial decrease to €29 thousand in 2020. This decline could be attributed to global economic uncertainties impacting trade flows. However, in 2021, imports rebounded to €33.85 thousand, showing signs of recovery. The year 2022 marked a significant surge in imports to €100.08 thousand, likely driven by increased demand or supply chain dynamics. Subsequently, imports sharply declined in 2023 to €15.99 thousand and further to €15.44 thousand in 2024. This steep downturn may indicate market adjustments or regulatory influences impacting import volumes. By 2025, imports fell to €11.6 thousand, emphasizing potential shifts in market dynamics or evolving trade relationships. Such fluctuations underscore the market's sensitivity to external factors, necessitating adaptive strategies for market participants to navigate uncertainties effectively.
Key Highlights of the Report:
- Cyprus Epichlorohydrin (ECH) Market Outlook
- Market Size of Cyprus Epichlorohydrin (ECH) Market, 2024
- Forecast of Cyprus Epichlorohydrin (ECH) Market, 2031
- Historical Data and Forecast of Cyprus Epichlorohydrin (ECH) Revenues & Volume for the Period 2021-2031
- Cyprus Epichlorohydrin (ECH) Market Trend Evolution
- Cyprus Epichlorohydrin (ECH) Market Drivers and Challenges
- Cyprus Epichlorohydrin (ECH) Price Trends
- Cyprus Epichlorohydrin (ECH) Porter`s Five Forces
- Cyprus Epichlorohydrin (ECH) Industry Life Cycle
- Historical Data and Forecast of Cyprus Epichlorohydrin (ECH) Market Revenues & Volume By Applications for the Period 2021-2031
- Historical Data and Forecast of Cyprus Epichlorohydrin (ECH) Market Revenues & Volume By Epoxy Resins for the Period 2021-2031
- Historical Data and Forecast of Cyprus Epichlorohydrin (ECH) Market Revenues & Volume By Synthetic Glycerin for the Period 2021-2031
- Historical Data and Forecast of Cyprus Epichlorohydrin (ECH) Market Revenues & Volume By Water Treatment Chemicals for the Period 2021-2031
- Historical Data and Forecast of Cyprus Epichlorohydrin (ECH) Market Revenues & Volume By Pharmaceuticals for the Period 2021-2031
- Historical Data and Forecast of Cyprus Epichlorohydrin (ECH) Market Revenues & Volume By End Use for the Period 2021-2031
- Historical Data and Forecast of Cyprus Epichlorohydrin (ECH) Market Revenues & Volume By Paints & Applications for the Period 2021-2031
- Historical Data and Forecast of Cyprus Epichlorohydrin (ECH) Market Revenues & Volume By Electrical & Electronics for the Period 2021-2031
- Historical Data and Forecast of Cyprus Epichlorohydrin (ECH) Market Revenues & Volume By Construction for the Period 2021-2031
- Historical Data and Forecast of Cyprus Epichlorohydrin (ECH) Market Revenues & Volume By Wind Turbine for the Period 2021-2031
- Historical Data and Forecast of Cyprus Epichlorohydrin (ECH) Market Revenues & Volume By Composites for the Period 2021-2031
- Historical Data and Forecast of Cyprus Epichlorohydrin (ECH) Market Revenues & Volume By Adhesives for the Period 2021-2031
- Historical Data and Forecast of Cyprus Epichlorohydrin (ECH) Market Revenues & Volume By Others for the Period 2021-2031
- Cyprus Epichlorohydrin (ECH) Import Export Trade Statistics
- Market Opportunity Assessment By Applications
- Market Opportunity Assessment By End Use
- Cyprus Epichlorohydrin (ECH) Top Companies Market Share
- Cyprus Epichlorohydrin (ECH) Competitive Benchmarking By Technical and Operational Parameters
- Cyprus Epichlorohydrin (ECH) Company Profiles
- Cyprus Epichlorohydrin (ECH) Key Strategic Recommendations
Frequently Asked Questions About the Market Study (FAQs):
6Wresearch actively monitors the Cyprus Epichlorohydrin (ECH) Market and publishes its comprehensive annual report, highlighting emerging trends, growth drivers, revenue analysis, and forecast outlook. Our insights help businesses to make data-backed strategic decisions with ongoing market dynamics. Our analysts track relevent industries related to the Cyprus Epichlorohydrin (ECH) Market, allowing our clients with actionable intelligence and reliable forecasts tailored to emerging regional needs.
Yes, we provide customisation as per your requirements. To learn more, feel free to contact us on sales@6wresearch.com
1 Executive Summary |
2 Introduction |
2.1 Key Highlights of the Report |
2.2 Report Description |
2.3 Market Scope & Segmentation |
2.4 Research Methodology |
2.5 Assumptions |
3 Cyprus Epichlorohydrin (ECH) Market Overview |
3.1 Cyprus Country Macro Economic Indicators |
3.2 Cyprus Epichlorohydrin (ECH) Market Revenues & Volume, 2021 & 2031F |
3.3 Cyprus Epichlorohydrin (ECH) Market - Industry Life Cycle |
3.4 Cyprus Epichlorohydrin (ECH) Market - Porter's Five Forces |
3.5 Cyprus Epichlorohydrin (ECH) Market Revenues & Volume Share, By Applications, 2021 & 2031F |
3.6 Cyprus Epichlorohydrin (ECH) Market Revenues & Volume Share, By End Use, 2021 & 2031F |
4 Cyprus Epichlorohydrin (ECH) Market Dynamics |
4.1 Impact Analysis |
4.2 Market Drivers |
4.2.1 Increasing demand for epoxy resins, which are a key application of epichlorohydrin. |
4.2.2 Growing awareness and adoption of eco-friendly products, as epichlorohydrin is used in the production of biodegradable plastics. |
4.2.3 Rise in construction and automotive industries, driving the demand for epichlorohydrin-based products. |
4.3 Market Restraints |
4.3.1 Fluctuating raw material prices, such as propylene and chlorine, impacting the production cost of epichlorohydrin. |
4.3.2 Stringent environmental regulations and increasing focus on sustainability, leading to challenges in the production processes of epichlorohydrin. |
5 Cyprus Epichlorohydrin (ECH) Market Trends |
6 Cyprus Epichlorohydrin (ECH) Market Segmentations |
6.1 Cyprus Epichlorohydrin (ECH) Market, By Applications |
6.1.1 Overview and Analysis |
6.1.2 Cyprus Epichlorohydrin (ECH) Market Revenues & Volume, By Epoxy Resins, 2021-2031F |
6.1.3 Cyprus Epichlorohydrin (ECH) Market Revenues & Volume, By Synthetic Glycerin, 2021-2031F |
6.1.4 Cyprus Epichlorohydrin (ECH) Market Revenues & Volume, By Water Treatment Chemicals, 2021-2031F |
6.1.5 Cyprus Epichlorohydrin (ECH) Market Revenues & Volume, By Pharmaceuticals, 2021-2031F |
6.2 Cyprus Epichlorohydrin (ECH) Market, By End Use |
6.2.1 Overview and Analysis |
6.2.2 Cyprus Epichlorohydrin (ECH) Market Revenues & Volume, By Paints & Applications, 2021-2031F |
6.2.3 Cyprus Epichlorohydrin (ECH) Market Revenues & Volume, By Electrical & Electronics, 2021-2031F |
6.2.4 Cyprus Epichlorohydrin (ECH) Market Revenues & Volume, By Construction, 2021-2031F |
6.2.5 Cyprus Epichlorohydrin (ECH) Market Revenues & Volume, By Wind Turbine, 2021-2031F |
6.2.6 Cyprus Epichlorohydrin (ECH) Market Revenues & Volume, By Composites, 2021-2031F |
6.2.7 Cyprus Epichlorohydrin (ECH) Market Revenues & Volume, By Adhesives, 2021-2031F |
7 Cyprus Epichlorohydrin (ECH) Market Import-Export Trade Statistics |
7.1 Cyprus Epichlorohydrin (ECH) Market Export to Major Countries |
7.2 Cyprus Epichlorohydrin (ECH) Market Imports from Major Countries |
8 Cyprus Epichlorohydrin (ECH) Market Key Performance Indicators |
8.1 Percentage of epichlorohydrin used in the production of epoxy resins compared to other applications. |
8.2 Number of new product developments or innovations in the epichlorohydrin market. |
8.3 Adoption rate of biodegradable plastics in various industries that use epichlorohydrin. |
9 Cyprus Epichlorohydrin (ECH) Market - Opportunity Assessment |
9.1 Cyprus Epichlorohydrin (ECH) Market Opportunity Assessment, By Applications, 2021 & 2031F |
9.2 Cyprus Epichlorohydrin (ECH) Market Opportunity Assessment, By End Use, 2021 & 2031F |
10 Cyprus Epichlorohydrin (ECH) Market - Competitive Landscape |
10.1 Cyprus Epichlorohydrin (ECH) Market Revenue Share, By Companies, 2024 |
10.2 Cyprus Epichlorohydrin (ECH) Market Competitive Benchmarking, By Operating and Technical Parameters |
11 Company Profiles |
12 Recommendations | 13 Disclaimer |
Global Go To Market Strategy - 2030
Export potential enables firms to identify high-growth global markets with greater confidence by combining advanced trade intelligence with a structured quantitative methodology. The framework analyzes emerging demand trends and country-level import patterns while integrating macroeconomic and trade datasets such as GDP and population forecasts, bilateral import–export flows, tariff structures, elasticity differentials between developed and developing economies, geographic distance, and import demand projections. Using weighted trade values from 2020–2024 as the base period to project country-to-country export potential for 2030, these inputs are operationalized through calculated drivers such as gravity model parameters, tariff impact factors, and projected GDP per-capita growth. Through an analysis of hidden potentials, demand hotspots, and market conditions that are most favorable to success, this method enables firms to focus on target countries, maximize returns, and global expansion with data, backed by accuracy.
By factoring in the projected importer demand gap that is currently unmet and could be potential opportunity, it identifies the potential for the Exporter (Country) among 190 countries, against the general trade analysis, which identifies the biggest importer or exporter.
To discover high-growth global markets and optimize your business strategy:
Click Here
Pricing
- Single User License$ 1,995
- Department License$ 2,400
- Site License$ 3,120
- Global License$ 3,795

Leadership Perspectives from Industry Events
Search
Thought Leadership and Analyst Meet


Our Clients
6WResearch In News
- India Export Attractiveness Tracker 2026
- India Air Conditioner Market Set for Strong Rebound in 2026 After Weather-Led Correction and GST-Driven Recovery: 6Wresearch
- ADAS in India: How Automatic Emergency Braking, Blind Spot Detection & Driver Monitoring are Transforming Road Safety
- Doha a strategic location for EV manufacturing hub: IPA Qatar
- Demand for luxury TVs surging in the GCC, says Samsung
- Empowering Growth: The Thriving Journey of Bangladesh’s Cable Industry
Latest Reports
- Nicaragua RPG Gaming Market (2026-2032)
- New Zealand RPG Gaming Market (2026-2032)
- Netherlands RPG Gaming Market (2026-2032)
- Nauru RPG Gaming Market (2026-2032)
- Namibia RPG Gaming Market (2026-2032)
- Mozambique RPG Gaming Market (2026-2032)
- Montenegro RPG Gaming Market (2026-2032)
- Mongolia RPG Gaming Market (2026-2032)
- Monaco RPG Gaming Market (2026-2032)
- Micronesia RPG Gaming Market (2026-2032)
Industry Events and Analyst Meet

EV India Expo 2026

HIMTEX 2026

India Refining Summit 2026

India EV Show 2026

EV tech India Expo 2026
Whitepaper
- Middle East & Africa Commercial Security Market Click here to view more.
- Middle East & Africa Fire Safety Systems & Equipment Market Click here to view more.
- GCC Drone Market Click here to view more.
- Middle East Lighting Fixture Market Click here to view more.
- GCC Physical & Perimeter Security Market Click here to view more.