Denmark Hydraulic Valves Market (2026-2032) | Forecast, Revenue, Industry, Analysis, Share, Growth, Outlook, Companies, Value, Trends, Segmentation & Size
Market Forecast By Type (Directional Control Valves, Pressure Control Valves, Flow Control Valves), By End-Use (Construction Machinery, Agriculture Machinery, Material Handling, Automotive, Oil & Gas, Power Generation, Metal & Mining, Others), By Flow Rate (Below 50 L/min, 50-200 L/min, 201-500 L/min, 501-1000 L/min, Above 1000 L/min), By Operation (Manual, Automated) And Competitive Landscape
| Product Code: ETC4935788 | Publication Date: Nov 2023 | Updated Date: Apr 2026 | Product Type: Market Research Report | |
| Publisher: 6Wresearch | Author: Shubham Padhi | No. of Pages: 60 | No. of Figures: 30 | No. of Tables: 5 |
Denmark Hydraulic Valves Market Size (2020-2030)
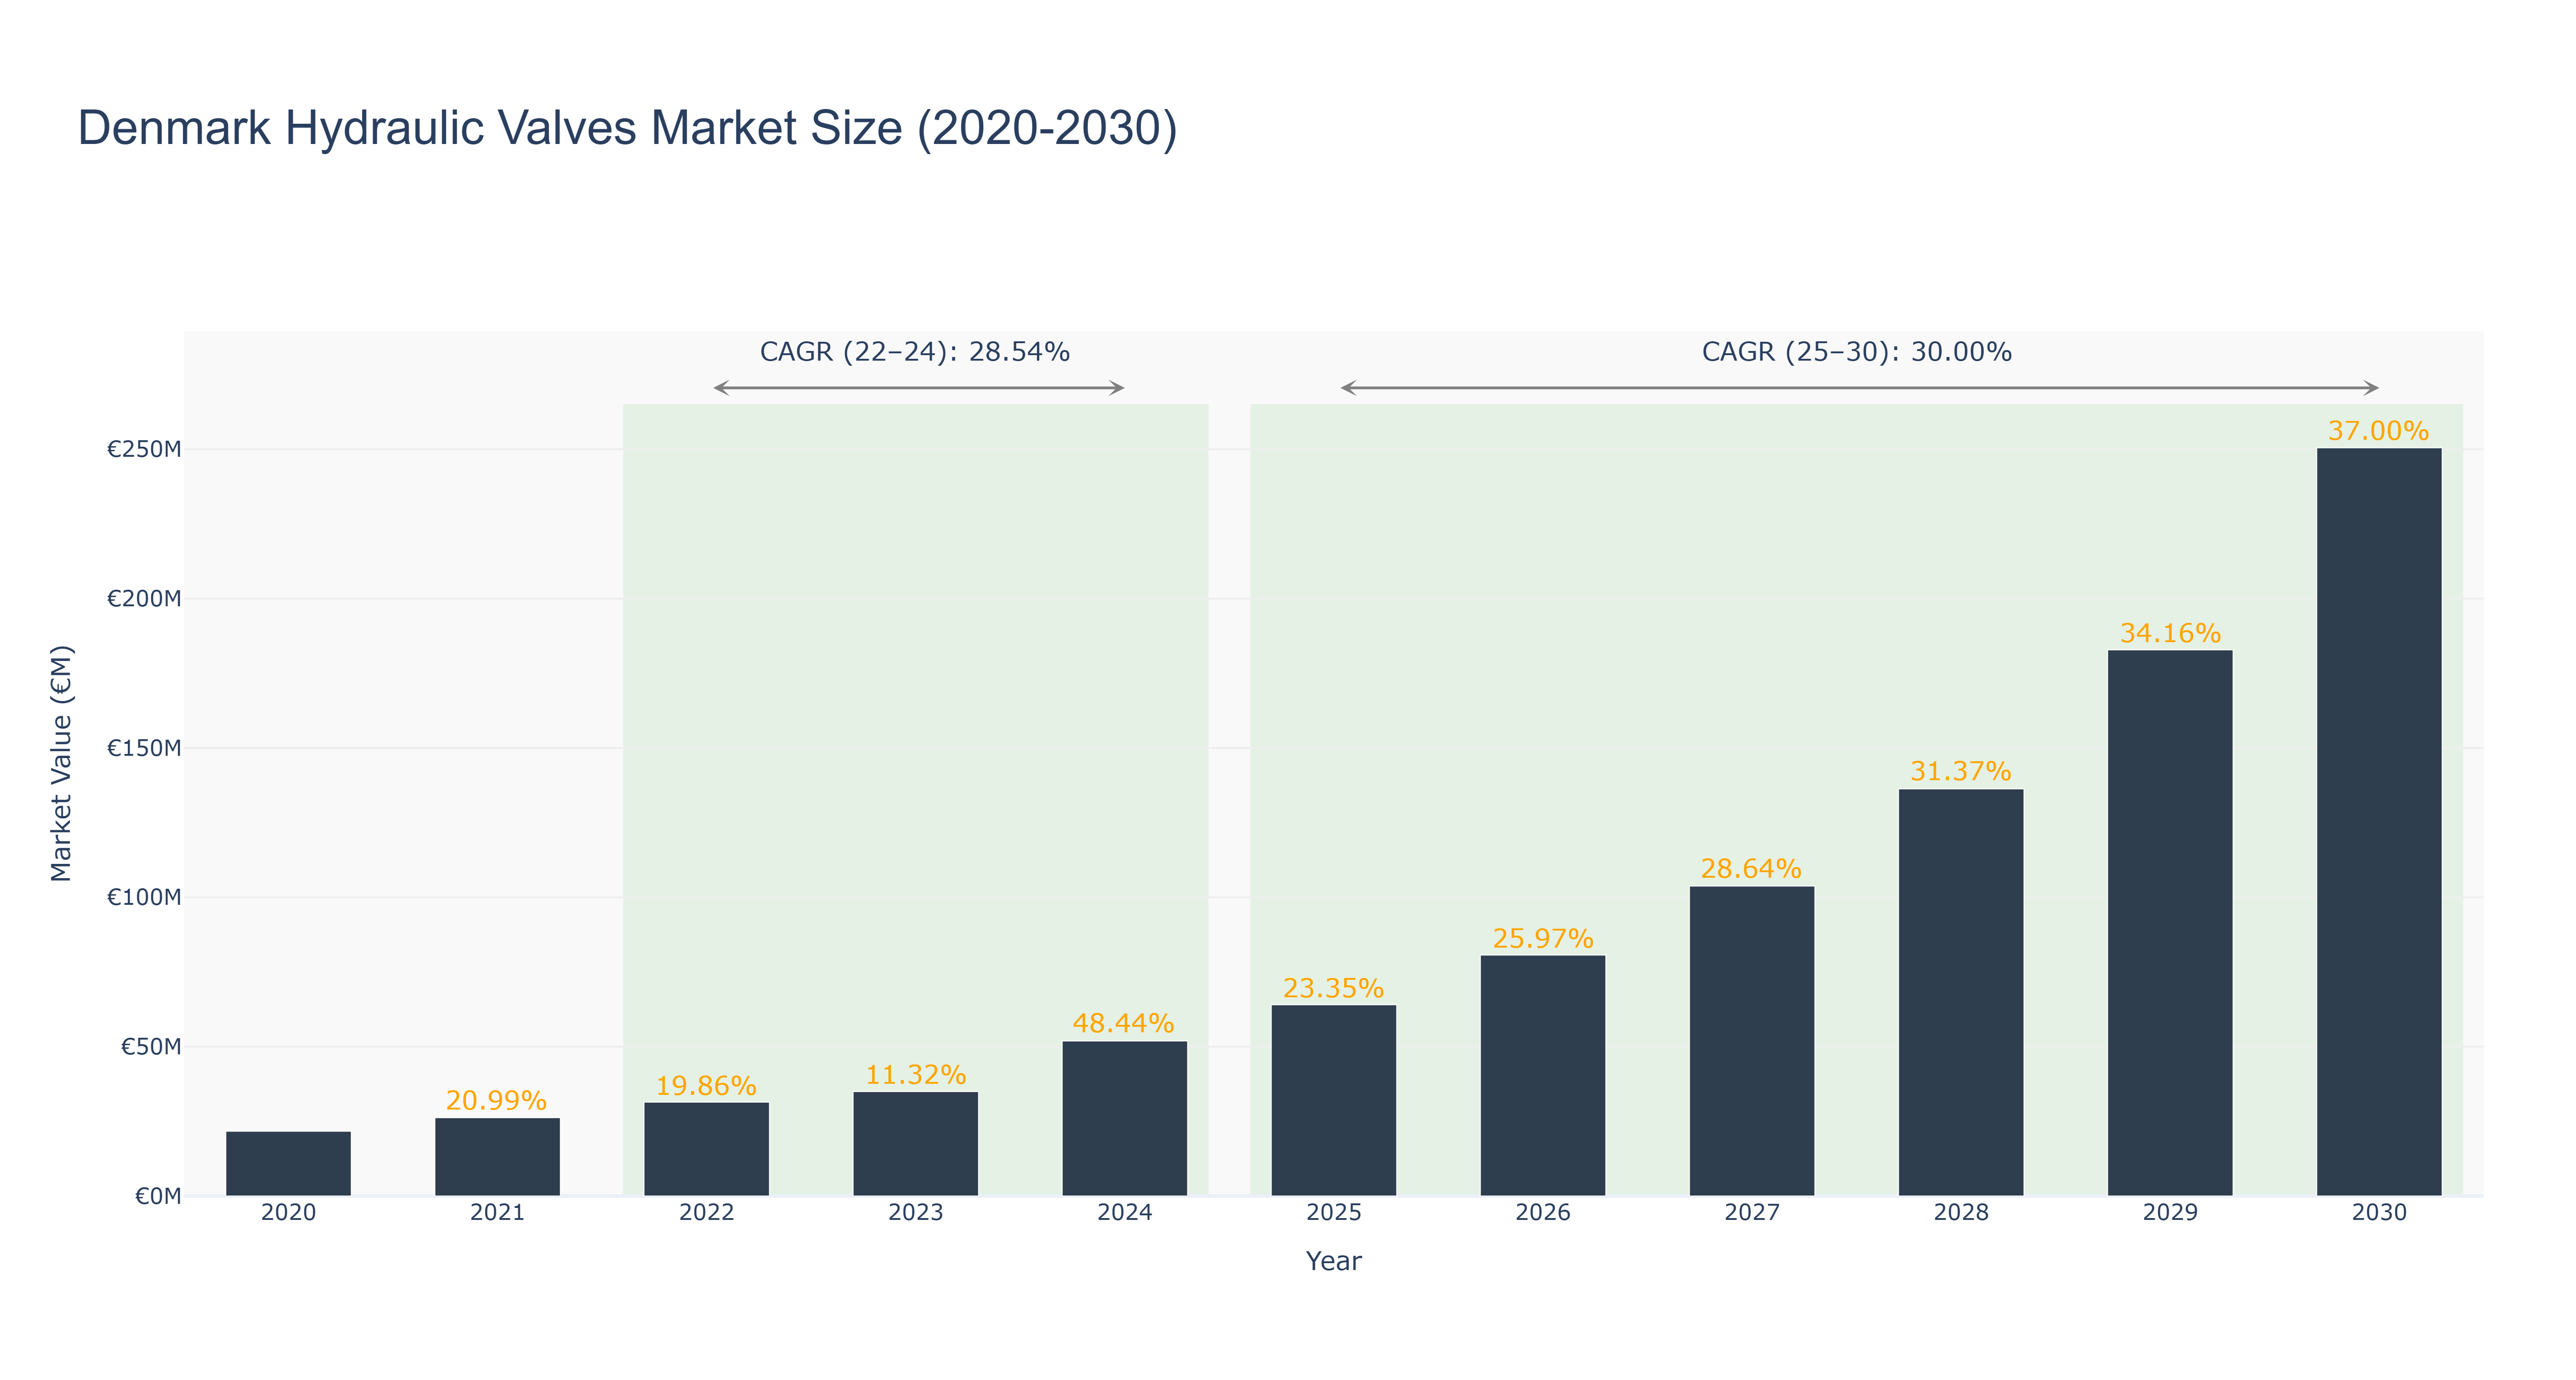
The Denmark Hydraulic Valves Market has demonstrated substantial growth, with an actual market size increasing from €21.66 million in 2020 to €51.89 million in 2024, reflecting a robust compound annual growth rate (CAGR) of 28.54% over this period. Notably, the market peaked in 2024, showcasing a significant jump of 48.44% from the previous year. This growth can be attributed to the expanding industrial sector and increasing investments in automation and infrastructure development. Looking ahead, the forecasted market size is projected to reach €250.48 million by 2030, with a CAGR of 30.00% from 2025 to 2030. This optimistic future outlook is driven by anticipated advancements in technology and a rise in demand for energy-efficient hydraulic systems. Additionally, ongoing public and private sector projects aimed at enhancing sustainability and operational efficiency are expected to further stimulate market expansion.
Denmark Hydraulic Valves Market: Production & Trade Performance (2019-2025)
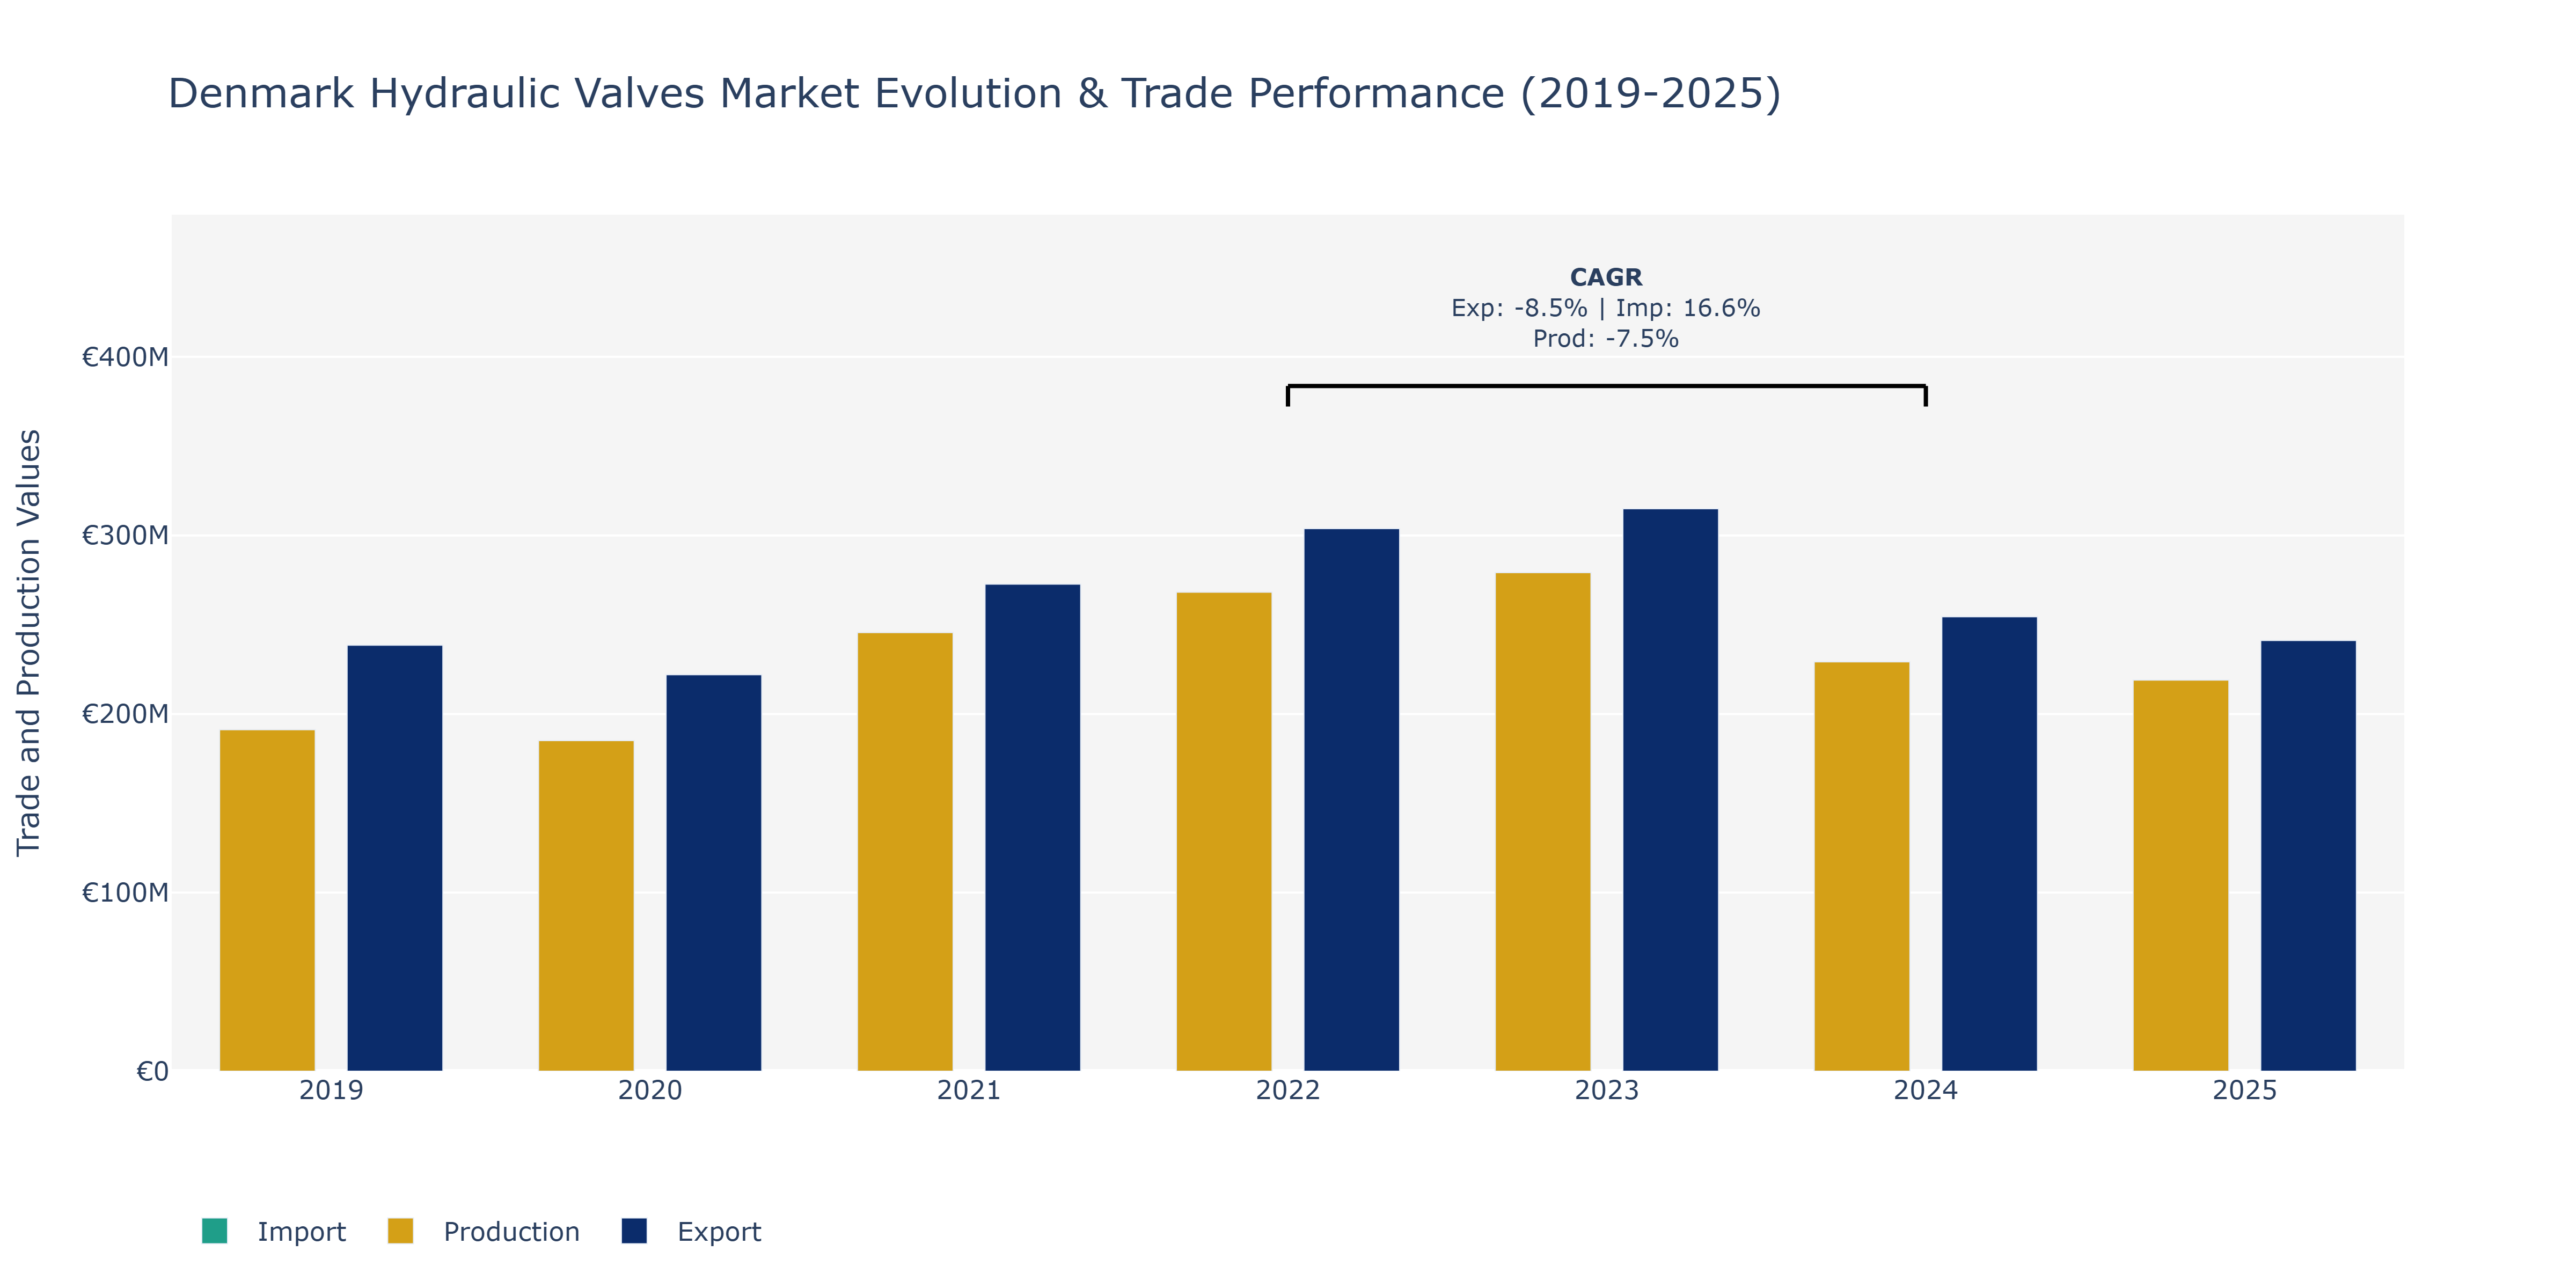
In the Denmark Hydraulic Valves Market, from 2019 to 2025, exports saw fluctuations, starting at €238.5 million in 2019, dropping to a low of €222.0 million in 2020, before sharply increasing to a peak of €314.89 million in 2023, and then decreasing to €241.11 million in 2025. Conversely, imports followed a more stable trend, increasing from €59.52 million in 2019 to €84.63 million in 2025. Production levels exhibited a similar pattern to exports, with a decrease from €191.22 million in 2019 to €185.09 million in 2020, a peak of €279.18 million in 2023, and a decline to €219.00 million in 2025. The fluctuations in exports and production could be attributed to global economic conditions impacting demand for hydraulic valves, while the steady growth in imports suggests a consistent need for foreign products to meet domestic requirements, potentially indicating a shift in sourcing strategies by market players.
Key Highlights of the Report:
- Denmark Hydraulic Valves Market Outlook
- Market Size of Denmark Hydraulic Valves Market, 2025
- Forecast of Denmark Hydraulic Valves Market, 2032
- Historical Data and Forecast of Denmark Hydraulic Valves Revenues & Volume for the Period 2022 - 2032F
- Denmark Hydraulic Valves Market Trend Evolution
- Denmark Hydraulic Valves Market Drivers and Challenges
- Denmark Hydraulic Valves Price Trends
- Denmark Hydraulic Valves Porter`s Five Forces
- Denmark Hydraulic Valves Industry Life Cycle
- Historical Data and Forecast of Denmark Hydraulic Valves Market Revenues & Volume By Type for the Period 2022 - 2032F
- Historical Data and Forecast of Denmark Hydraulic Valves Market Revenues & Volume By Directional Control Valves for the Period 2022 - 2032F
- Historical Data and Forecast of Denmark Hydraulic Valves Market Revenues & Volume By Pressure Control Valves for the Period 2022 - 2032F
- Historical Data and Forecast of Denmark Hydraulic Valves Market Revenues & Volume By Flow Control Valves for the Period 2022 - 2032F
- Historical Data and Forecast of Denmark Hydraulic Valves Market Revenues & Volume By End-Use for the Period 2022 - 2032F
- Historical Data and Forecast of Denmark Hydraulic Valves Market Revenues & Volume By Construction Machinery for the Period 2022 - 2032F
- Historical Data and Forecast of Denmark Hydraulic Valves Market Revenues & Volume By Agriculture Machinery for the Period 2022 - 2032F
- Historical Data and Forecast of Denmark Hydraulic Valves Market Revenues & Volume By Material Handling for the Period 2022 - 2032F
- Historical Data and Forecast of Denmark Hydraulic Valves Market Revenues & Volume By Automotive for the Period 2022 - 2032F
- Historical Data and Forecast of Denmark Hydraulic Valves Market Revenues & Volume By Oil & Gas for the Period 2022 - 2032F
- Historical Data and Forecast of Denmark Hydraulic Valves Market Revenues & Volume By Power Generation for the Period 2022 - 2032F
- Historical Data and Forecast of Denmark Hydraulic Valves Market Revenues & Volume By Metal & Mining for the Period 2022 - 2032F
- Historical Data and Forecast of Denmark Hydraulic Valves Market Revenues & Volume By Others for the Period 2022 - 2032F
- Historical Data and Forecast of Denmark Hydraulic Valves Market Revenues & Volume By Flow Rate for the Period 2022 - 2032F
- Historical Data and Forecast of Denmark Hydraulic Valves Market Revenues & Volume By Below 50 L/min for the Period 2022 - 2032F
- Historical Data and Forecast of Denmark Hydraulic Valves Market Revenues & Volume By 50-200 L/min for the Period 2022 - 2032F
- Historical Data and Forecast of Denmark Hydraulic Valves Market Revenues & Volume By 201-500 L/min for the Period 2022 - 2032F
- Historical Data and Forecast of Denmark Hydraulic Valves Market Revenues & Volume By 501-1000 L/min for the Period 2022 - 2032F
- Historical Data and Forecast of Denmark Hydraulic Valves Market Revenues & Volume By Above 1000 L/min for the Period 2022 - 2032F
- Historical Data and Forecast of Denmark Hydraulic Valves Market Revenues & Volume By Operation for the Period 2022 - 2032F
- Historical Data and Forecast of Denmark Hydraulic Valves Market Revenues & Volume By Manual for the Period 2022 - 2032F
- Historical Data and Forecast of Denmark Hydraulic Valves Market Revenues & Volume By Automated for the Period 2022 - 2032F
- Denmark Hydraulic Valves Import Export Trade Statistics
- Market Opportunity Assessment By Type
- Market Opportunity Assessment By End-Use
- Market Opportunity Assessment By Flow Rate
- Market Opportunity Assessment By Operation
- Denmark Hydraulic Valves Top Companies Market Share
- Denmark Hydraulic Valves Competitive Benchmarking By Technical and Operational Parameters
- Denmark Hydraulic Valves Company Profiles
- Denmark Hydraulic Valves Key Strategic Recommendations
Frequently Asked Questions About the Market Study (FAQs):
6Wresearch actively monitors the Denmark Hydraulic Valves Market and publishes its comprehensive annual report, highlighting emerging trends, growth drivers, revenue analysis, and forecast outlook. Our insights help businesses to make data-backed strategic decisions with ongoing market dynamics. Our analysts track relevent industries related to the Denmark Hydraulic Valves Market, allowing our clients with actionable intelligence and reliable forecasts tailored to emerging regional needs.
Yes, we provide customisation as per your requirements. To learn more, feel free to contact us on sales@6wresearch.com
1 Executive Summary |
2 Introduction |
2.1 Key Highlights of the Report |
2.2 Report Description |
2.3 Market Scope & Segmentation |
2.4 Research Methodology |
2.5 Assumptions |
3 Denmark Hydraulic Valves Market Overview |
3.1 Denmark Country Macro Economic Indicators |
3.2 Denmark Hydraulic Valves Market Revenues & Volume, 2022 & 2032F |
3.3 Denmark Hydraulic Valves Market - Industry Life Cycle |
3.4 Denmark Hydraulic Valves Market - Porter's Five Forces |
3.5 Denmark Hydraulic Valves Market Revenues & Volume Share, By Type, 2022 & 2032F |
3.6 Denmark Hydraulic Valves Market Revenues & Volume Share, By End-Use, 2022 & 2032F |
3.7 Denmark Hydraulic Valves Market Revenues & Volume Share, By Flow Rate, 2022 & 2032F |
3.8 Denmark Hydraulic Valves Market Revenues & Volume Share, By Operation, 2022 & 2032F |
4 Denmark Hydraulic Valves Market Dynamics |
4.1 Impact Analysis |
4.2 Market Drivers |
4.2.1 Increasing demand for automation in various industries |
4.2.2 Growing focus on renewable energy sources |
4.2.3 Technological advancements leading to improved efficiency and performance |
4.3 Market Restraints |
4.3.1 High initial investment costs for hydraulic systems |
4.3.2 Fluctuating raw material prices impacting manufacturing costs |
4.3.3 Intense competition from substitute products like pneumatic valves |
5 Denmark Hydraulic Valves Market Trends |
6 Denmark Hydraulic Valves Market Segmentations |
6.1 Denmark Hydraulic Valves Market, By Type |
6.1.1 Overview and Analysis |
6.1.2 Denmark Hydraulic Valves Market Revenues & Volume, By Directional Control Valves, 2022 - 2032F |
6.1.3 Denmark Hydraulic Valves Market Revenues & Volume, By Pressure Control Valves, 2022 - 2032F |
6.1.4 Denmark Hydraulic Valves Market Revenues & Volume, By Flow Control Valves, 2022 - 2032F |
6.2 Denmark Hydraulic Valves Market, By End-Use |
6.2.1 Overview and Analysis |
6.2.2 Denmark Hydraulic Valves Market Revenues & Volume, By Construction Machinery, 2022 - 2032F |
6.2.3 Denmark Hydraulic Valves Market Revenues & Volume, By Agriculture Machinery, 2022 - 2032F |
6.2.4 Denmark Hydraulic Valves Market Revenues & Volume, By Material Handling, 2022 - 2032F |
6.2.5 Denmark Hydraulic Valves Market Revenues & Volume, By Automotive, 2022 - 2032F |
6.2.6 Denmark Hydraulic Valves Market Revenues & Volume, By Oil & Gas, 2022 - 2032F |
6.2.7 Denmark Hydraulic Valves Market Revenues & Volume, By Power Generation, 2022 - 2032F |
6.2.8 Denmark Hydraulic Valves Market Revenues & Volume, By Others, 2022 - 2032F |
6.2.9 Denmark Hydraulic Valves Market Revenues & Volume, By Others, 2022 - 2032F |
6.3 Denmark Hydraulic Valves Market, By Flow Rate |
6.3.1 Overview and Analysis |
6.3.2 Denmark Hydraulic Valves Market Revenues & Volume, By Below 50 L/min, 2022 - 2032F |
6.3.3 Denmark Hydraulic Valves Market Revenues & Volume, By 50-200 L/min, 2022 - 2032F |
6.3.4 Denmark Hydraulic Valves Market Revenues & Volume, By 201-500 L/min, 2022 - 2032F |
6.3.5 Denmark Hydraulic Valves Market Revenues & Volume, By 501-1000 L/min, 2022 - 2032F |
6.3.6 Denmark Hydraulic Valves Market Revenues & Volume, By Above 1000 L/min, 2022 - 2032F |
6.4 Denmark Hydraulic Valves Market, By Operation |
6.4.1 Overview and Analysis |
6.4.2 Denmark Hydraulic Valves Market Revenues & Volume, By Manual, 2022 - 2032F |
6.4.3 Denmark Hydraulic Valves Market Revenues & Volume, By Automated, 2022 - 2032F |
7 Denmark Hydraulic Valves Market Import-Export Trade Statistics |
7.1 Denmark Hydraulic Valves Market Export to Major Countries |
7.2 Denmark Hydraulic Valves Market Imports from Major Countries |
8 Denmark Hydraulic Valves Market Key Performance Indicators |
8.1 Adoption rate of Industry 4.0 technologies in manufacturing processes |
8.2 Number of new renewable energy projects in Denmark |
8.3 Research and development investments in hydraulic valve technology |
9 Denmark Hydraulic Valves Market - Opportunity Assessment |
9.1 Denmark Hydraulic Valves Market Opportunity Assessment, By Type, 2022 & 2032F |
9.2 Denmark Hydraulic Valves Market Opportunity Assessment, By End-Use, 2022 & 2032F |
9.3 Denmark Hydraulic Valves Market Opportunity Assessment, By Flow Rate, 2022 & 2032F |
9.4 Denmark Hydraulic Valves Market Opportunity Assessment, By Operation, 2022 & 2032F |
10 Denmark Hydraulic Valves Market - Competitive Landscape |
10.1 Denmark Hydraulic Valves Market Revenue Share, By Companies, 2025 |
10.2 Denmark Hydraulic Valves Market Competitive Benchmarking, By Operating and Technical Parameters |
11 Company Profiles |
12 Recommendations | 13 Disclaimer |
Global Go To Market Strategy - 2030
Export potential enables firms to identify high-growth global markets with greater confidence by combining advanced trade intelligence with a structured quantitative methodology. The framework analyzes emerging demand trends and country-level import patterns while integrating macroeconomic and trade datasets such as GDP and population forecasts, bilateral import–export flows, tariff structures, elasticity differentials between developed and developing economies, geographic distance, and import demand projections. Using weighted trade values from 2020–2024 as the base period to project country-to-country export potential for 2030, these inputs are operationalized through calculated drivers such as gravity model parameters, tariff impact factors, and projected GDP per-capita growth. Through an analysis of hidden potentials, demand hotspots, and market conditions that are most favorable to success, this method enables firms to focus on target countries, maximize returns, and global expansion with data, backed by accuracy.
By factoring in the projected importer demand gap that is currently unmet and could be potential opportunity, it identifies the potential for the Exporter (Country) among 190 countries, against the general trade analysis, which identifies the biggest importer or exporter.
To discover high-growth global markets and optimize your business strategy:
Click Here
Pricing
- Single User License$ 1,995
- Department License$ 2,400
- Site License$ 3,120
- Global License$ 3,795

Leadership Perspectives from Industry Events
Search
Thought Leadership and Analyst Meet


Our Clients
6WResearch In News
- India Export Attractiveness Tracker 2026
- India Air Conditioner Market Set for Strong Rebound in 2026 After Weather-Led Correction and GST-Driven Recovery: 6Wresearch
- ADAS in India: How Automatic Emergency Braking, Blind Spot Detection & Driver Monitoring are Transforming Road Safety
- Doha a strategic location for EV manufacturing hub: IPA Qatar
- Demand for luxury TVs surging in the GCC, says Samsung
- Empowering Growth: The Thriving Journey of Bangladesh’s Cable Industry
Latest Reports
- Nicaragua RPG Gaming Market (2026-2032)
- New Zealand RPG Gaming Market (2026-2032)
- Netherlands RPG Gaming Market (2026-2032)
- Nauru RPG Gaming Market (2026-2032)
- Namibia RPG Gaming Market (2026-2032)
- Mozambique RPG Gaming Market (2026-2032)
- Montenegro RPG Gaming Market (2026-2032)
- Mongolia RPG Gaming Market (2026-2032)
- Monaco RPG Gaming Market (2026-2032)
- Micronesia RPG Gaming Market (2026-2032)
Industry Events and Analyst Meet

EV India Expo 2026

HIMTEX 2026

India Refining Summit 2026

India EV Show 2026

EV tech India Expo 2026
Whitepaper
- Middle East & Africa Commercial Security Market Click here to view more.
- Middle East & Africa Fire Safety Systems & Equipment Market Click here to view more.
- GCC Drone Market Click here to view more.
- Middle East Lighting Fixture Market Click here to view more.
- GCC Physical & Perimeter Security Market Click here to view more.