El Salvador Container Glass Market (2025-2031) | Industry, Segmentation, Size, Companies, Value, Forecast, Outlook, Trends, Revenue, Share, Analysis & Growth
Market Forecast By Glass Type (Borosilicate-based, Soda-lime-silica-based), By Forming Method (Blow & Blow, Press & Blow, Narrow Neck Press & Blow), By End Use (Food & Beverages, Cosmetics & Personal Care, Pharmaceuticals, Chemical, Others) And Competitive Landscape
| Product Code: ETC5113879 | Publication Date: Nov 2023 | Updated Date: Nov 2025 | Product Type: Market Research Report | |
| Publisher: 6Wresearch | Author: Sachin Kumar Rai | No. of Pages: 60 | No. of Figures: 30 | No. of Tables: 5 |
El Salvador Container Glass Market Top 5 Importing Countries and Market Competition (HHI) Analysis
El Salvador`s container glass import market in 2024 continued to see high concentration with top exporters being Costa Rica, Guatemala, China, Peru, and Mexico. Despite a negative CAGR of -3.3% from 2020 to 2024 and a steep decline in growth rate of -11.42% from 2023 to 2024, these countries maintained their strong presence in supplying container glass to El Salvador. The market dynamics suggest a challenging environment, possibly impacted by various factors influencing the import trends in the country.

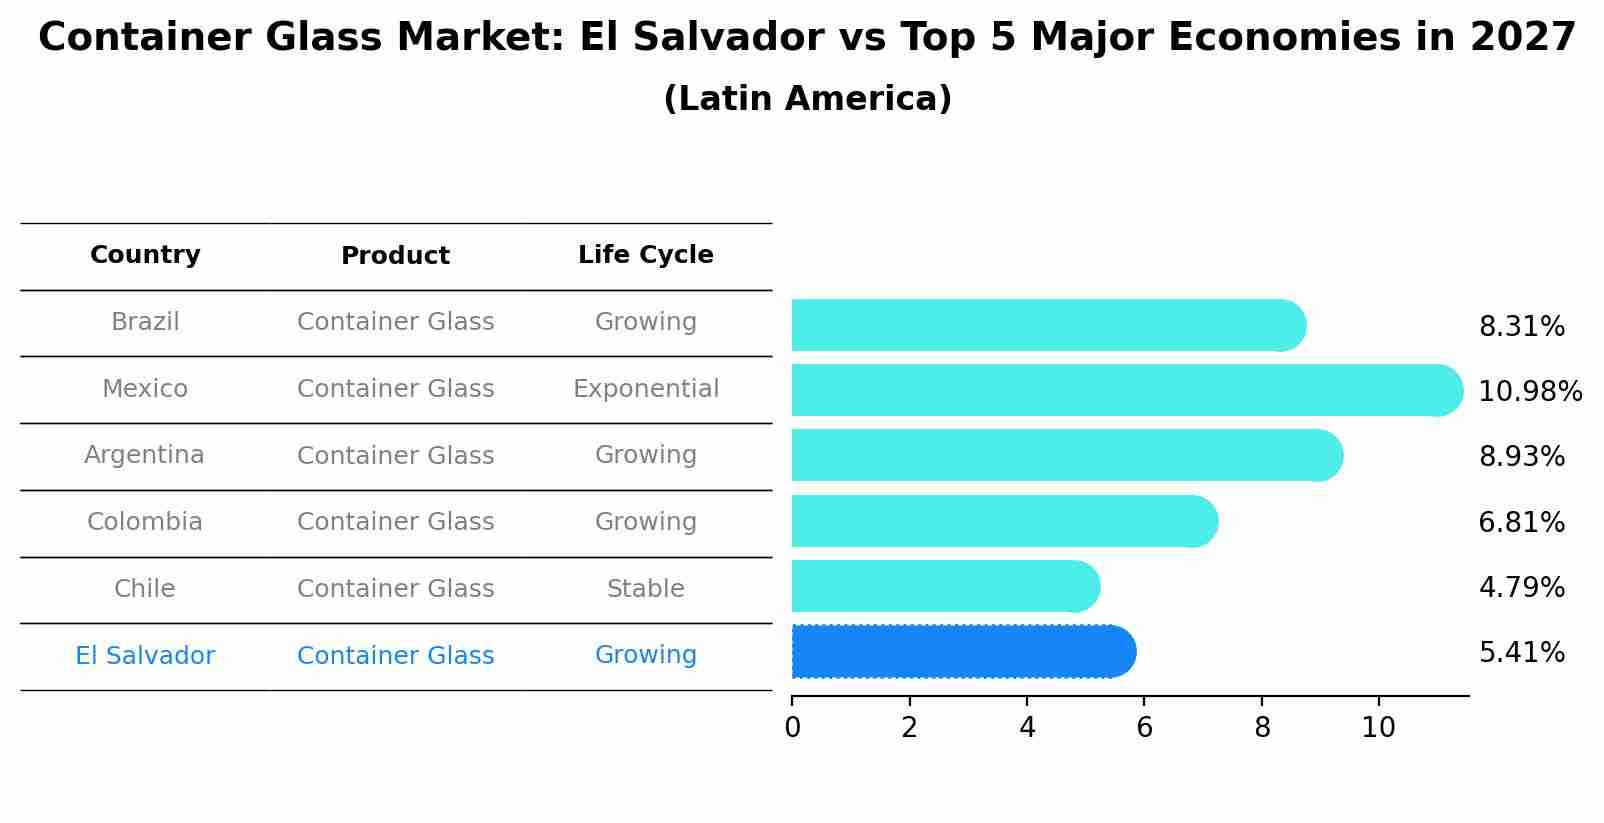
Container Glass Market: El Salvador vs Top 5 Major Economies in 2027 (Latin America)
El Salvador's Container Glass market is anticipated to experience a growing growth rate of 5.41% by 2027, reflecting trends observed in the largest economy Brazil, followed by Mexico, Argentina, Colombia and Chile.
El Salvador Container Glass Market Overview
The container glass market in El Salvador is growing in response to the increasing demand for glass packaging across various industries, including food and beverage, pharmaceuticals, and cosmetics. Glass is favored for its sustainability, recyclability, and ability to preserve the quality and taste of food and beverages, especially in the premium segments. As consumer preferences shift toward more eco-friendly packaging materials, the demand for glass containers is expected to rise. Additionally, El Salvadors thriving food and beverage sector, especially beverages like beer and soft drinks, will continue to drive the growth of the container glass market.
Drivers of the market
The container glass market in El Salvador is driven by the expanding food and beverage industry, which is a major consumer of glass packaging. Glass containers are preferred for packaging due to their durability, non-reactive properties, and ability to preserve the quality of products. As consumer preferences shift towards eco-friendly and sustainable packaging, glass containers, which are recyclable and reusable, are gaining popularity. The rise of the craft beverage sector, including artisanal beers, spirits, and beverages, is also contributing to the demand for high-quality glass bottles and jars in the country.
Challenges of the market
The Container Glass market in El Salvador faces challenges such as high import dependence, production costs, and limited recycling capabilities. Most of the container glass used in El Salvador is imported, which drives up the price of goods packaged in glass containers. Local manufacturers face challenges in scaling up production due to the high capital investment required for glass production facilities. Moreover, the country has limited recycling infrastructure, leading to increased waste and environmental concerns associated with glass disposal. These factors hinder the growth of the container glass market, particularly in the food and beverage sector.
Government Policy of the market
The government of El Salvador regulates the container glass market with policies that focus on safety, quality, and environmental sustainability. Regulations often address the recycling of glass containers and the reduction of waste. The government may implement measures to incentivize the use of recyclable materials in glass production and promote the reduction of carbon emissions in manufacturing processes. Additionally, import/export policies may be applied to regulate the movement of glass containers within the region.
Key Highlights of the Report:
- El Salvador Container Glass Market Outlook
- Market Size of El Salvador Container Glass Market, 2024
- Forecast of El Salvador Container Glass Market, 2031
- Historical Data and Forecast of El Salvador Container Glass Revenues & Volume for the Period 2021-2031
- El Salvador Container Glass Market Trend Evolution
- El Salvador Container Glass Market Drivers and Challenges
- El Salvador Container Glass Price Trends
- El Salvador Container Glass Porter`s Five Forces
- El Salvador Container Glass Industry Life Cycle
- Historical Data and Forecast of El Salvador Container Glass Market Revenues & Volume By Glass Type for the Period 2021-2031
- Historical Data and Forecast of El Salvador Container Glass Market Revenues & Volume By Borosilicate-based for the Period 2021-2031
- Historical Data and Forecast of El Salvador Container Glass Market Revenues & Volume By Soda-lime-silica-based for the Period 2021-2031
- Historical Data and Forecast of El Salvador Container Glass Market Revenues & Volume By Forming Method for the Period 2021-2031
- Historical Data and Forecast of El Salvador Container Glass Market Revenues & Volume By Blow & Blow for the Period 2021-2031
- Historical Data and Forecast of El Salvador Container Glass Market Revenues & Volume By Press & Blow for the Period 2021-2031
- Historical Data and Forecast of El Salvador Container Glass Market Revenues & Volume By Narrow Neck Press & Blow for the Period 2021-2031
- Historical Data and Forecast of El Salvador Container Glass Market Revenues & Volume By End Use for the Period 2021-2031
- Historical Data and Forecast of El Salvador Container Glass Market Revenues & Volume By Food & Beverages for the Period 2021-2031
- Historical Data and Forecast of El Salvador Container Glass Market Revenues & Volume By Cosmetics & Personal Care for the Period 2021-2031
- Historical Data and Forecast of El Salvador Container Glass Market Revenues & Volume By Pharmaceuticals for the Period 2021-2031
- Historical Data and Forecast of El Salvador Container Glass Market Revenues & Volume By Chemical for the Period 2021-2031
- Historical Data and Forecast of El Salvador Container Glass Market Revenues & Volume By Others for the Period 2021-2031
- El Salvador Container Glass Import Export Trade Statistics
- Market Opportunity Assessment By Glass Type
- Market Opportunity Assessment By Forming Method
- Market Opportunity Assessment By End Use
- El Salvador Container Glass Top Companies Market Share
- El Salvador Container Glass Competitive Benchmarking By Technical and Operational Parameters
- El Salvador Container Glass Company Profiles
- El Salvador Container Glass Key Strategic Recommendations
Frequently Asked Questions About the Market Study (FAQs):
6Wresearch actively monitors the El Salvador Container Glass Market and publishes its comprehensive annual report, highlighting emerging trends, growth drivers, revenue analysis, and forecast outlook. Our insights help businesses to make data-backed strategic decisions with ongoing market dynamics. Our analysts track relevent industries related to the El Salvador Container Glass Market, allowing our clients with actionable intelligence and reliable forecasts tailored to emerging regional needs.
Yes, we provide customisation as per your requirements. To learn more, feel free to contact us on sales@6wresearch.com
1 Executive Summary |
2 Introduction |
2.1 Key Highlights of the Report |
2.2 Report Description |
2.3 Market Scope & Segmentation |
2.4 Research Methodology |
2.5 Assumptions |
3 El Salvador Container Glass Market Overview |
3.1 El Salvador Country Macro Economic Indicators |
3.2 El Salvador Container Glass Market Revenues & Volume, 2021 & 2031F |
3.3 El Salvador Container Glass Market - Industry Life Cycle |
3.4 El Salvador Container Glass Market - Porter's Five Forces |
3.5 El Salvador Container Glass Market Revenues & Volume Share, By Glass Type, 2021 & 2031F |
3.6 El Salvador Container Glass Market Revenues & Volume Share, By Forming Method, 2021 & 2031F |
3.7 El Salvador Container Glass Market Revenues & Volume Share, By End Use, 2021 & 2031F |
4 El Salvador Container Glass Market Dynamics |
4.1 Impact Analysis |
4.2 Market Drivers |
4.2.1 Growing demand for eco-friendly and sustainable packaging solutions |
4.2.2 Increasing consumption of packaged foods and beverages |
4.2.3 Government initiatives promoting the use of recyclable materials in packaging |
4.3 Market Restraints |
4.3.1 Fluctuating raw material prices impacting production costs |
4.3.2 Competition from alternative packaging materials such as PET and aluminum |
4.3.3 Economic instability affecting consumer spending habits |
5 El Salvador Container Glass Market Trends |
6 El Salvador Container Glass Market Segmentations |
6.1 El Salvador Container Glass Market, By Glass Type |
6.1.1 Overview and Analysis |
6.1.2 El Salvador Container Glass Market Revenues & Volume, By Borosilicate-based, 2021-2031F |
6.1.3 El Salvador Container Glass Market Revenues & Volume, By Soda-lime-silica-based, 2021-2031F |
6.2 El Salvador Container Glass Market, By Forming Method |
6.2.1 Overview and Analysis |
6.2.2 El Salvador Container Glass Market Revenues & Volume, By Blow & Blow, 2021-2031F |
6.2.3 El Salvador Container Glass Market Revenues & Volume, By Press & Blow, 2021-2031F |
6.2.4 El Salvador Container Glass Market Revenues & Volume, By Narrow Neck Press & Blow, 2021-2031F |
6.3 El Salvador Container Glass Market, By End Use |
6.3.1 Overview and Analysis |
6.3.2 El Salvador Container Glass Market Revenues & Volume, By Food & Beverages, 2021-2031F |
6.3.3 El Salvador Container Glass Market Revenues & Volume, By Cosmetics & Personal Care, 2021-2031F |
6.3.4 El Salvador Container Glass Market Revenues & Volume, By Pharmaceuticals, 2021-2031F |
6.3.5 El Salvador Container Glass Market Revenues & Volume, By Chemical, 2021-2031F |
6.3.6 El Salvador Container Glass Market Revenues & Volume, By Others, 2021-2031F |
7 El Salvador Container Glass Market Import-Export Trade Statistics |
7.1 El Salvador Container Glass Market Export to Major Countries |
7.2 El Salvador Container Glass Market Imports from Major Countries |
8 El Salvador Container Glass Market Key Performance Indicators |
8.1 Recycling rate of glass containers in El Salvador |
8.2 Adoption rate of sustainable packaging practices by glass manufacturers |
8.3 Investment in research and development for glass packaging innovations |
8.4 Percentage of market share held by glass packaging in key industries |
8.5 Consumer perception and preference for glass packaging in El Salvador |
9 El Salvador Container Glass Market - Opportunity Assessment |
9.1 El Salvador Container Glass Market Opportunity Assessment, By Glass Type, 2021 & 2031F |
9.2 El Salvador Container Glass Market Opportunity Assessment, By Forming Method, 2021 & 2031F |
9.3 El Salvador Container Glass Market Opportunity Assessment, By End Use, 2021 & 2031F |
10 El Salvador Container Glass Market - Competitive Landscape |
10.1 El Salvador Container Glass Market Revenue Share, By Companies, 2024 |
10.2 El Salvador Container Glass Market Competitive Benchmarking, By Operating and Technical Parameters |
11 Company Profiles |
12 Recommendations | 13 Disclaimer |
Global Go To Market Strategy - 2030
Export potential enables firms to identify high-growth global markets with greater confidence by combining advanced trade intelligence with a structured quantitative methodology. The framework analyzes emerging demand trends and country-level import patterns while integrating macroeconomic and trade datasets such as GDP and population forecasts, bilateral import–export flows, tariff structures, elasticity differentials between developed and developing economies, geographic distance, and import demand projections. Using weighted trade values from 2020–2024 as the base period to project country-to-country export potential for 2030, these inputs are operationalized through calculated drivers such as gravity model parameters, tariff impact factors, and projected GDP per-capita growth. Through an analysis of hidden potentials, demand hotspots, and market conditions that are most favorable to success, this method enables firms to focus on target countries, maximize returns, and global expansion with data, backed by accuracy.
By factoring in the projected importer demand gap that is currently unmet and could be potential opportunity, it identifies the potential for the Exporter (Country) among 190 countries, against the general trade analysis, which identifies the biggest importer or exporter.
To discover high-growth global markets and optimize your business strategy:
Click Here
Pricing
- Single User License$ 1,995
- Department License$ 2,400
- Site License$ 3,120
- Global License$ 3,795

Leadership Perspectives from Industry Events
Search
Thought Leadership and Analyst Meet


Our Clients
6WResearch In News
- India Export Attractiveness Tracker 2026
- India Air Conditioner Market Set for Strong Rebound in 2026 After Weather-Led Correction and GST-Driven Recovery: 6Wresearch
- ADAS in India: How Automatic Emergency Braking, Blind Spot Detection & Driver Monitoring are Transforming Road Safety
- Doha a strategic location for EV manufacturing hub: IPA Qatar
- Demand for luxury TVs surging in the GCC, says Samsung
- Empowering Growth: The Thriving Journey of Bangladesh’s Cable Industry
Latest Reports
- Nicaragua RPG Gaming Market (2026-2032)
- New Zealand RPG Gaming Market (2026-2032)
- Netherlands RPG Gaming Market (2026-2032)
- Nauru RPG Gaming Market (2026-2032)
- Namibia RPG Gaming Market (2026-2032)
- Mozambique RPG Gaming Market (2026-2032)
- Montenegro RPG Gaming Market (2026-2032)
- Mongolia RPG Gaming Market (2026-2032)
- Monaco RPG Gaming Market (2026-2032)
- Micronesia RPG Gaming Market (2026-2032)
Industry Events and Analyst Meet

EV India Expo 2026

HIMTEX 2026

India Refining Summit 2026

India EV Show 2026

EV tech India Expo 2026
Whitepaper
- Middle East & Africa Commercial Security Market Click here to view more.
- Middle East & Africa Fire Safety Systems & Equipment Market Click here to view more.
- GCC Drone Market Click here to view more.
- Middle East Lighting Fixture Market Click here to view more.
- GCC Physical & Perimeter Security Market Click here to view more.