Estonia Amniocentesis Needle Market (2026-2032) | Trends, Forecast, Industry, Competitive Landscape, Segmentation, Share, Value, Companies, Size & Revenue, Outlook, Growth, Analysis
Market Forecast By Type (100 150 mm Needles, Larger Than 150 mm Needles, Smaller Than 100 mm Needles), By Procedure (Amniocentesis Procedures, Amnioreduction Procedures, Foetal Blood Transfusion Procedures, Amnioinfusion Procedures, Cordocentesis Procedures), By End User (Hospitals, Diagnostic Centres, Clinics, Other End Users) And Competitive Landscape
| Product Code: ETC7125740 | Publication Date: Sep 2024 | Updated Date: Apr 2026 | Product Type: Market Research Report | |
| Publisher: 6Wresearch | Author: Sumit Sagar | No. of Pages: 75 | No. of Figures: 35 | No. of Tables: 20 |
Estonia Amniocentesis Needle Market Size (2020-2030)
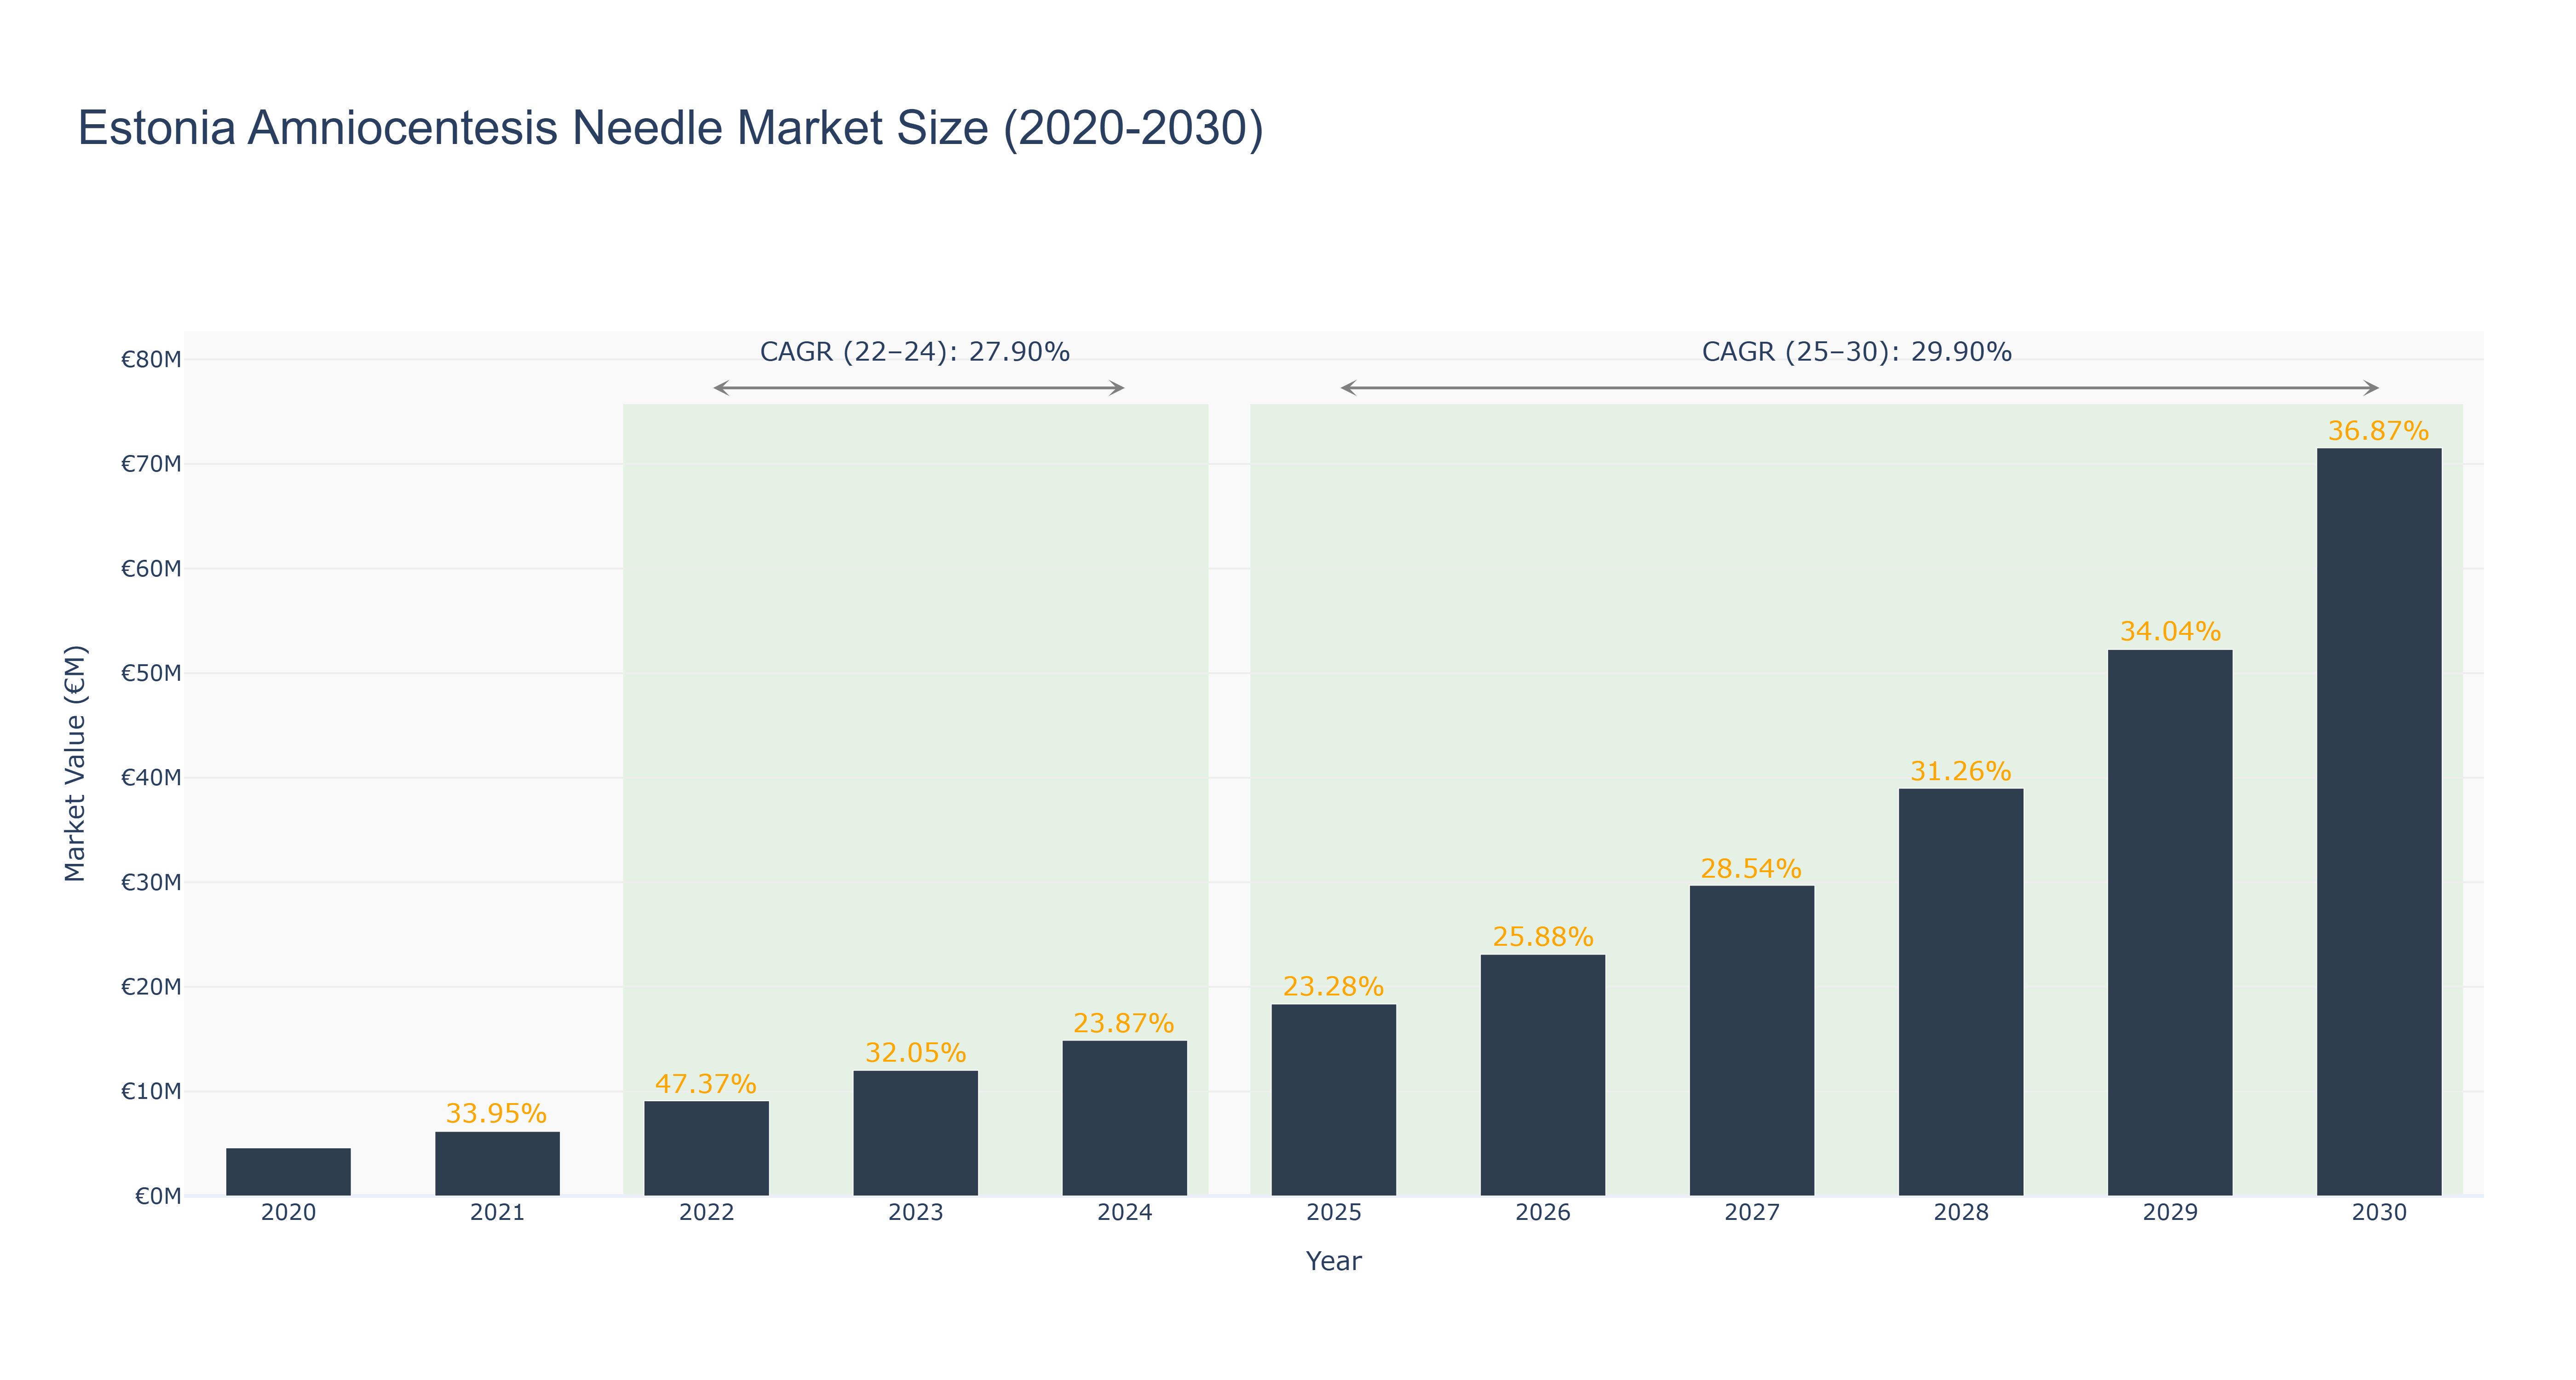
The Estonia Amniocentesis Needle Market has shown remarkable growth in the recent past, with actual market sizes escalating from €4.61 million in 2020 to €12.02 million in 2023, reflecting a significant compound annual growth rate (CAGR) of 27.90% from 2022 to 2024. The market reached its peak in 2024 with a size of €14.89 million, marking a transition into a robust forecasted growth phase. Projected values indicate an upward trajectory, with the market anticipated to expand to €71.55 million by 2030, achieving a CAGR of 29.90% from 2025 to 2030. This positive outlook is driven by increased maternal healthcare awareness, technological advancements in prenatal diagnostics, and rising demand for non-invasive procedures. Additionally, ongoing investments in healthcare infrastructure are expected to further bolster market expansion, making Estonia a key player in the advancement of prenatal diagnostics in the region.
Estonia Amniocentesis Needle Market: Production & Trade Performance (2019-2025)
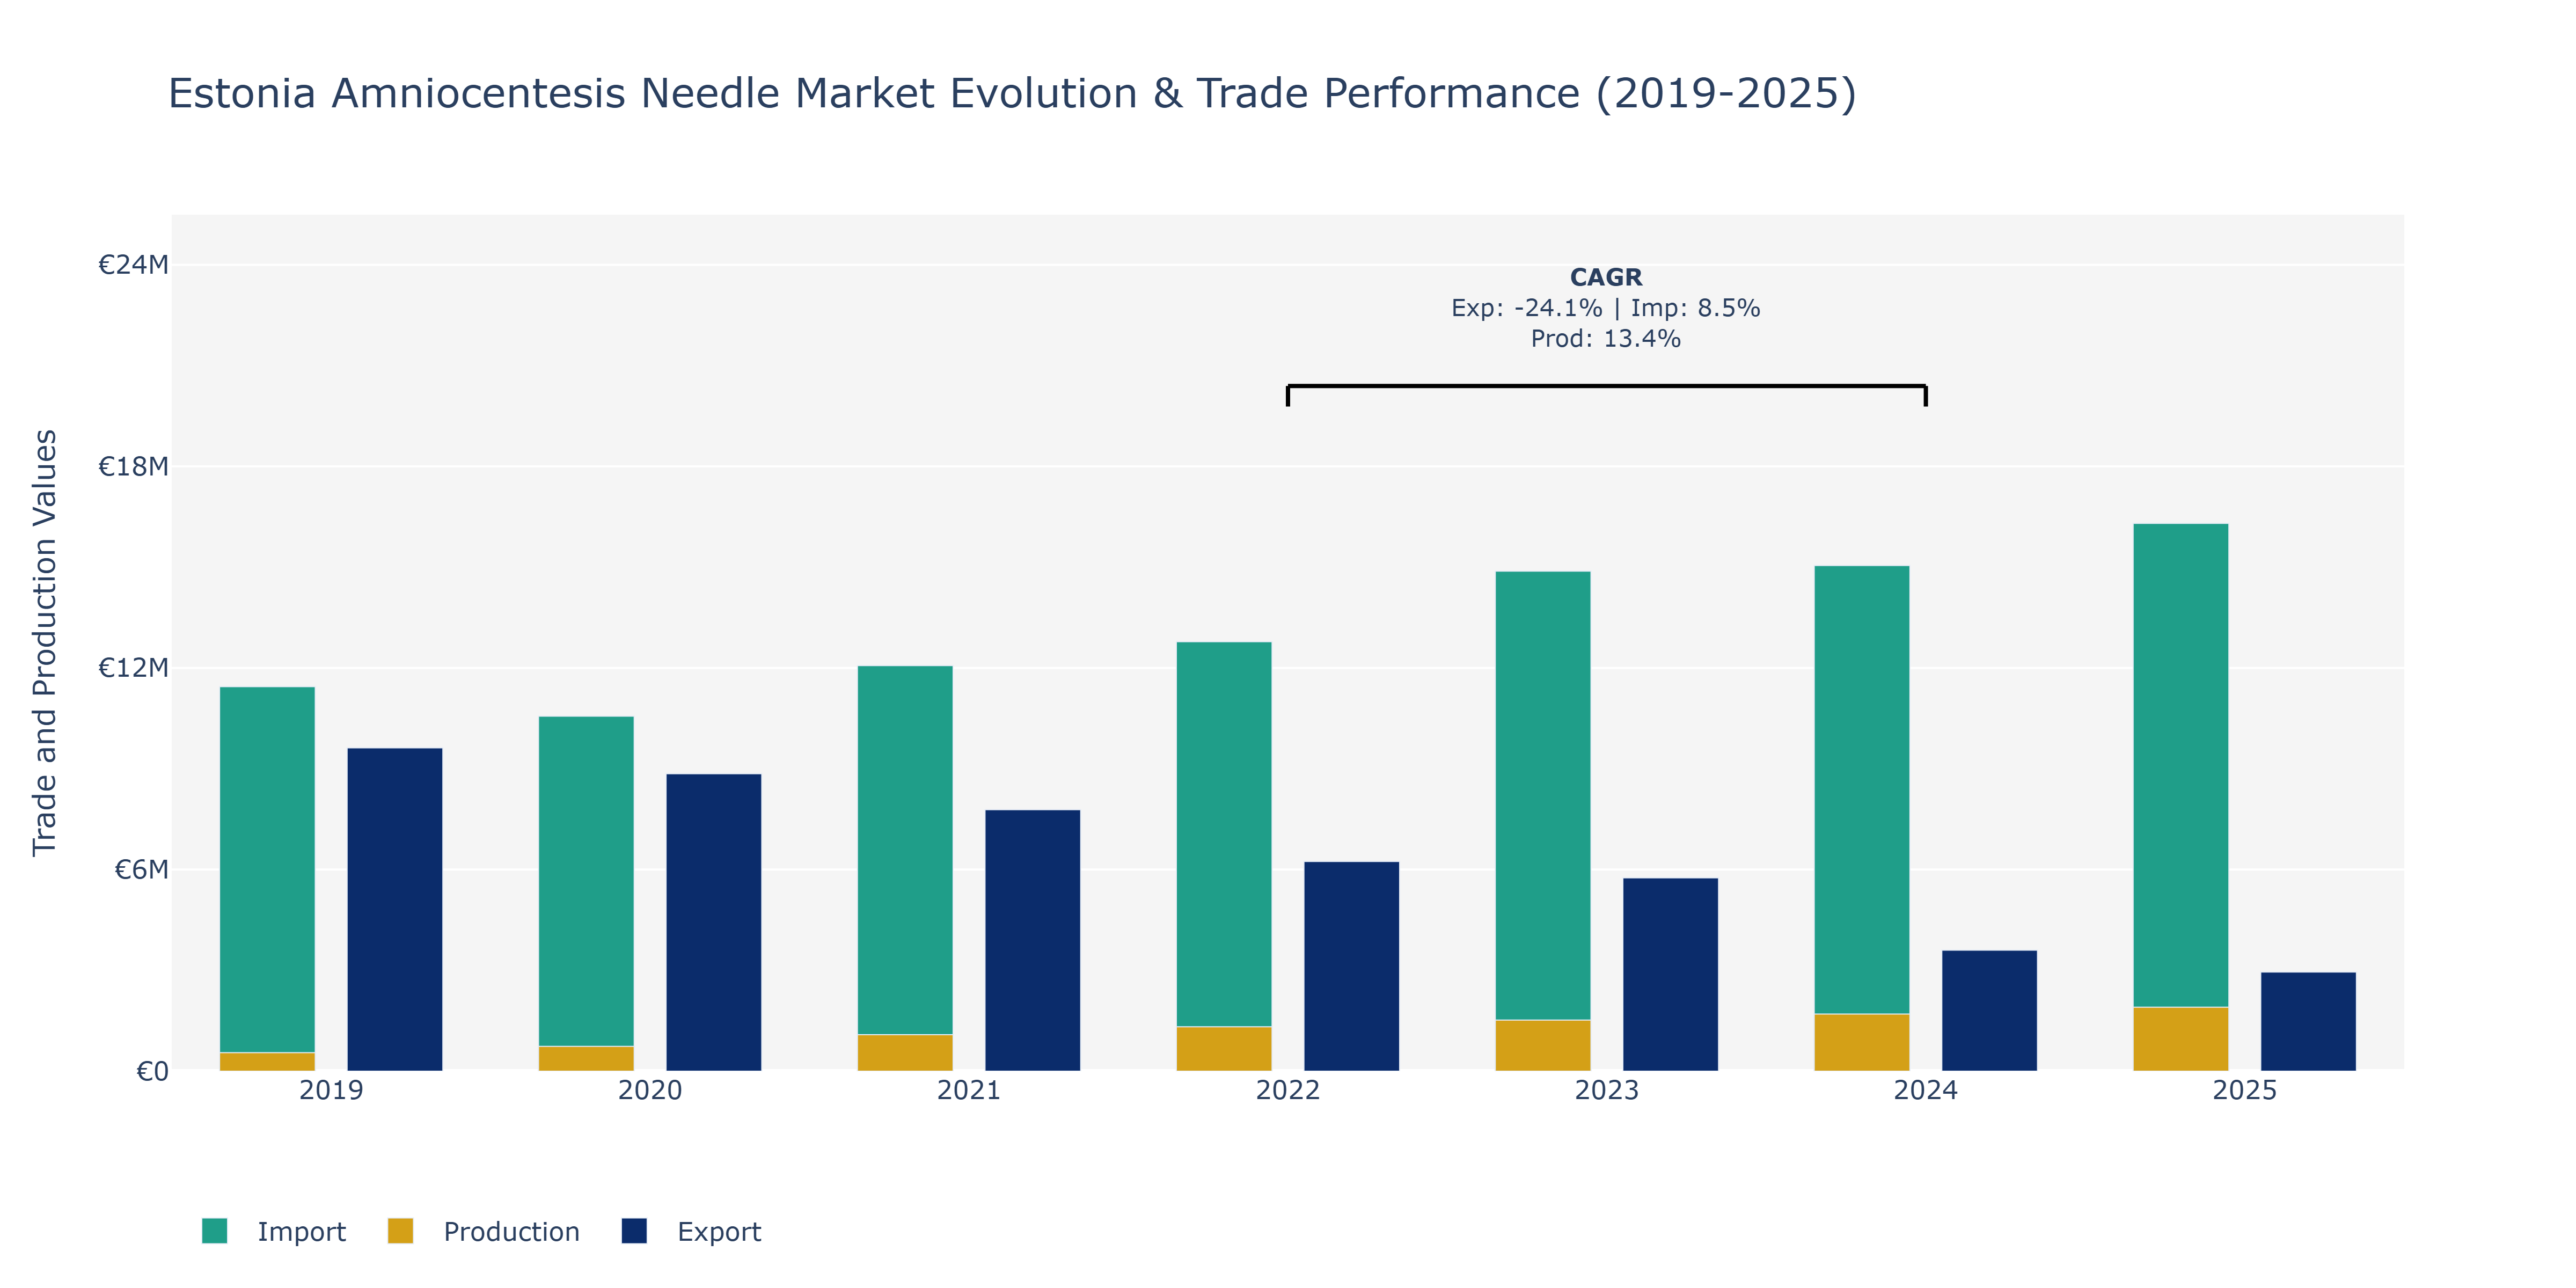
The Estonia Amniocentesis Needle Market experienced varying trends in exports, imports, and production from 2019 to 2025. Exports declined from €9.62 million in 2019 to €2.95 million in 2025, indicating a steady decrease over the period. In contrast, imports showed an upward trajectory, increasing from €11.45 million in 2019 to €16.3 million in 2025, with a significant spike in 2024. Production also saw a consistent rise, reaching €1.91 million in 2025 from €549.27 million in 2019. The surge in imports can be attributed to growing demand for advanced healthcare technologies in Estonia, leading to increased reliance on imported amniocentesis needles. The decline in exports might be linked to intensified competition from other markets or a shift in production focus towards meeting domestic demands. The notable production growth aligns with advancements in manufacturing processes and potentially increased local consumption. Such market dynamics reflect Estonia's evolving healthcare landscape, emphasizing the need for strategic market positioning and product innovation to maintain competitiveness.
Key Highlights of the Report:
- Estonia Amniocentesis Needle Market Outlook
- Market Size of Estonia Amniocentesis Needle Market, 2025
- Forecast of Estonia Amniocentesis Needle Market, 2032
- Historical Data and Forecast of Estonia Amniocentesis Needle Revenues & Volume for the Period 2022 - 2032
- Estonia Amniocentesis Needle Market Trend Evolution
- Estonia Amniocentesis Needle Market Drivers and Challenges
- Estonia Amniocentesis Needle Price Trends
- Estonia Amniocentesis Needle Porter's Five Forces
- Estonia Amniocentesis Needle Industry Life Cycle
- Historical Data and Forecast of Estonia Amniocentesis Needle Market Revenues & Volume By Type for the Period 2022 - 2032
- Historical Data and Forecast of Estonia Amniocentesis Needle Market Revenues & Volume By 100 150 mm Needles for the Period 2022 - 2032
- Historical Data and Forecast of Estonia Amniocentesis Needle Market Revenues & Volume By Larger Than 150 mm Needles for the Period 2022 - 2032
- Historical Data and Forecast of Estonia Amniocentesis Needle Market Revenues & Volume By Smaller Than 100 mm Needles for the Period 2022 - 2032
- Historical Data and Forecast of Estonia Amniocentesis Needle Market Revenues & Volume By Procedure for the Period 2022 - 2032
- Historical Data and Forecast of Estonia Amniocentesis Needle Market Revenues & Volume By Amniocentesis Procedures for the Period 2022 - 2032
- Historical Data and Forecast of Estonia Amniocentesis Needle Market Revenues & Volume By Amnioreduction Procedures for the Period 2022 - 2032
- Historical Data and Forecast of Estonia Amniocentesis Needle Market Revenues & Volume By Foetal Blood Transfusion Procedures for the Period 2022 - 2032
- Historical Data and Forecast of Estonia Amniocentesis Needle Market Revenues & Volume By Amnioinfusion Procedures for the Period 2022 - 2032
- Historical Data and Forecast of Estonia Amniocentesis Needle Market Revenues & Volume By Cordocentesis Procedures for the Period 2022 - 2032
- Historical Data and Forecast of Estonia Amniocentesis Needle Market Revenues & Volume By End User for the Period 2022 - 2032
- Historical Data and Forecast of Estonia Amniocentesis Needle Market Revenues & Volume By Hospitals for the Period 2022 - 2032
- Historical Data and Forecast of Estonia Amniocentesis Needle Market Revenues & Volume By Diagnostic Centres for the Period 2022 - 2032
- Historical Data and Forecast of Estonia Amniocentesis Needle Market Revenues & Volume By Clinics for the Period 2022 - 2032
- Historical Data and Forecast of Estonia Amniocentesis Needle Market Revenues & Volume By Other End Users for the Period 2022 - 2032
- Estonia Amniocentesis Needle Import Export Trade Statistics
- Market Opportunity Assessment By Type
- Market Opportunity Assessment By Procedure
- Market Opportunity Assessment By End User
- Estonia Amniocentesis Needle Top Companies Market Share
- Estonia Amniocentesis Needle Competitive Benchmarking By Technical and Operational Parameters
- Estonia Amniocentesis Needle Company Profiles
- Estonia Amniocentesis Needle Key Strategic Recommendations
Frequently Asked Questions About the Market Study (FAQs):
6Wresearch actively monitors the Estonia Amniocentesis Needle Market and publishes its comprehensive annual report, highlighting emerging trends, growth drivers, revenue analysis, and forecast outlook. Our insights help businesses to make data-backed strategic decisions with ongoing market dynamics. Our analysts track relevent industries related to the Estonia Amniocentesis Needle Market, allowing our clients with actionable intelligence and reliable forecasts tailored to emerging regional needs.
Yes, we provide customisation as per your requirements. To learn more, feel free to contact us on sales@6wresearch.com
1 Executive Summary |
2 Introduction |
2.1 Key Highlights of the Report |
2.2 Report Description |
2.3 Market Scope & Segmentation |
2.4 Research Methodology |
2.5 Assumptions |
3 Estonia Amniocentesis Needle Market Overview |
3.1 Estonia Country Macro Economic Indicators |
3.2 Estonia Amniocentesis Needle Market Revenues & Volume, 2022 & 2032F |
3.3 Estonia Amniocentesis Needle Market - Industry Life Cycle |
3.4 Estonia Amniocentesis Needle Market - Porter's Five Forces |
3.5 Estonia Amniocentesis Needle Market Revenues & Volume Share, By Type, 2022 & 2032F |
3.6 Estonia Amniocentesis Needle Market Revenues & Volume Share, By Procedure, 2022 & 2032F |
3.7 Estonia Amniocentesis Needle Market Revenues & Volume Share, By End User, 2022 & 2032F |
4 Estonia Amniocentesis Needle Market Dynamics |
4.1 Impact Analysis |
4.2 Market Drivers |
4.3 Market Restraints |
5 Estonia Amniocentesis Needle Market Trends |
6 Estonia Amniocentesis Needle Market, By Types |
6.1 Estonia Amniocentesis Needle Market, By Type |
6.1.1 Overview and Analysis |
6.1.2 Estonia Amniocentesis Needle Market Revenues & Volume, By Type, 2022 - 2032F |
6.1.3 Estonia Amniocentesis Needle Market Revenues & Volume, By 100 150 mm Needles, 2022 - 2032F |
6.1.4 Estonia Amniocentesis Needle Market Revenues & Volume, By Larger Than 150 mm Needles, 2022 - 2032F |
6.1.5 Estonia Amniocentesis Needle Market Revenues & Volume, By Smaller Than 100 mm Needles, 2022 - 2032F |
6.2 Estonia Amniocentesis Needle Market, By Procedure |
6.2.1 Overview and Analysis |
6.2.2 Estonia Amniocentesis Needle Market Revenues & Volume, By Amniocentesis Procedures, 2022 - 2032F |
6.2.3 Estonia Amniocentesis Needle Market Revenues & Volume, By Amnioreduction Procedures, 2022 - 2032F |
6.2.4 Estonia Amniocentesis Needle Market Revenues & Volume, By Foetal Blood Transfusion Procedures, 2022 - 2032F |
6.2.5 Estonia Amniocentesis Needle Market Revenues & Volume, By Amnioinfusion Procedures, 2022 - 2032F |
6.2.6 Estonia Amniocentesis Needle Market Revenues & Volume, By Cordocentesis Procedures, 2022 - 2032F |
6.3 Estonia Amniocentesis Needle Market, By End User |
6.3.1 Overview and Analysis |
6.3.2 Estonia Amniocentesis Needle Market Revenues & Volume, By Hospitals, 2022 - 2032F |
6.3.3 Estonia Amniocentesis Needle Market Revenues & Volume, By Diagnostic Centres, 2022 - 2032F |
6.3.4 Estonia Amniocentesis Needle Market Revenues & Volume, By Clinics, 2022 - 2032F |
6.3.5 Estonia Amniocentesis Needle Market Revenues & Volume, By Other End Users, 2022 - 2032F |
7 Estonia Amniocentesis Needle Market Import-Export Trade Statistics |
7.1 Estonia Amniocentesis Needle Market Export to Major Countries |
7.2 Estonia Amniocentesis Needle Market Imports from Major Countries |
8 Estonia Amniocentesis Needle Market Key Performance Indicators |
9 Estonia Amniocentesis Needle Market - Opportunity Assessment |
9.1 Estonia Amniocentesis Needle Market Opportunity Assessment, By Type, 2022 & 2032F |
9.2 Estonia Amniocentesis Needle Market Opportunity Assessment, By Procedure, 2022 & 2032F |
9.3 Estonia Amniocentesis Needle Market Opportunity Assessment, By End User, 2022 & 2032F |
10 Estonia Amniocentesis Needle Market - Competitive Landscape |
10.1 Estonia Amniocentesis Needle Market Revenue Share, By Companies, 2025 |
10.2 Estonia Amniocentesis Needle Market Competitive Benchmarking, By Operating and Technical Parameters |
11 Company Profiles |
12 Recommendations |
13 Disclaimer |
Global Go To Market Strategy - 2030
Export potential enables firms to identify high-growth global markets with greater confidence by combining advanced trade intelligence with a structured quantitative methodology. The framework analyzes emerging demand trends and country-level import patterns while integrating macroeconomic and trade datasets such as GDP and population forecasts, bilateral import–export flows, tariff structures, elasticity differentials between developed and developing economies, geographic distance, and import demand projections. Using weighted trade values from 2020–2024 as the base period to project country-to-country export potential for 2030, these inputs are operationalized through calculated drivers such as gravity model parameters, tariff impact factors, and projected GDP per-capita growth. Through an analysis of hidden potentials, demand hotspots, and market conditions that are most favorable to success, this method enables firms to focus on target countries, maximize returns, and global expansion with data, backed by accuracy.
By factoring in the projected importer demand gap that is currently unmet and could be potential opportunity, it identifies the potential for the Exporter (Country) among 190 countries, against the general trade analysis, which identifies the biggest importer or exporter.
To discover high-growth global markets and optimize your business strategy:
Click Here
Pricing
- Single User License$ 1,995
- Department License$ 2,400
- Site License$ 3,120
- Global License$ 3,795

Leadership Perspectives from Industry Events
Search
Thought Leadership and Analyst Meet


Our Clients
6WResearch In News
- India Export Attractiveness Tracker 2026
- India Air Conditioner Market Set for Strong Rebound in 2026 After Weather-Led Correction and GST-Driven Recovery: 6Wresearch
- ADAS in India: How Automatic Emergency Braking, Blind Spot Detection & Driver Monitoring are Transforming Road Safety
- Doha a strategic location for EV manufacturing hub: IPA Qatar
- Demand for luxury TVs surging in the GCC, says Samsung
- Empowering Growth: The Thriving Journey of Bangladesh’s Cable Industry
Latest Reports
- Nicaragua RPG Gaming Market (2026-2032)
- New Zealand RPG Gaming Market (2026-2032)
- Netherlands RPG Gaming Market (2026-2032)
- Nauru RPG Gaming Market (2026-2032)
- Namibia RPG Gaming Market (2026-2032)
- Mozambique RPG Gaming Market (2026-2032)
- Montenegro RPG Gaming Market (2026-2032)
- Mongolia RPG Gaming Market (2026-2032)
- Monaco RPG Gaming Market (2026-2032)
- Micronesia RPG Gaming Market (2026-2032)
Industry Events and Analyst Meet

EV India Expo 2026

HIMTEX 2026

India Refining Summit 2026

India EV Show 2026

EV tech India Expo 2026
Whitepaper
- Middle East & Africa Commercial Security Market Click here to view more.
- Middle East & Africa Fire Safety Systems & Equipment Market Click here to view more.
- GCC Drone Market Click here to view more.
- Middle East Lighting Fixture Market Click here to view more.
- GCC Physical & Perimeter Security Market Click here to view more.