Estonia Automated Curtains Market (2026-2032) | Industry, Competitive Landscape, Outlook, Segmentation, Analysis, Companies, Size & Revenue, Growth, Forecast, Share, Trends, Value
Market Forecast By Product (Ripplefold, Pinch Pleat), By Application (Residential, Commercial) And Competitive Landscape
| Product Code: ETC7126272 | Publication Date: Sep 2024 | Updated Date: Apr 2026 | Product Type: Market Research Report | |
| Publisher: 6Wresearch | Author: Sumit Sagar | No. of Pages: 75 | No. of Figures: 35 | No. of Tables: 20 |
Estonia Automated Curtains Market Size (2020-2030)
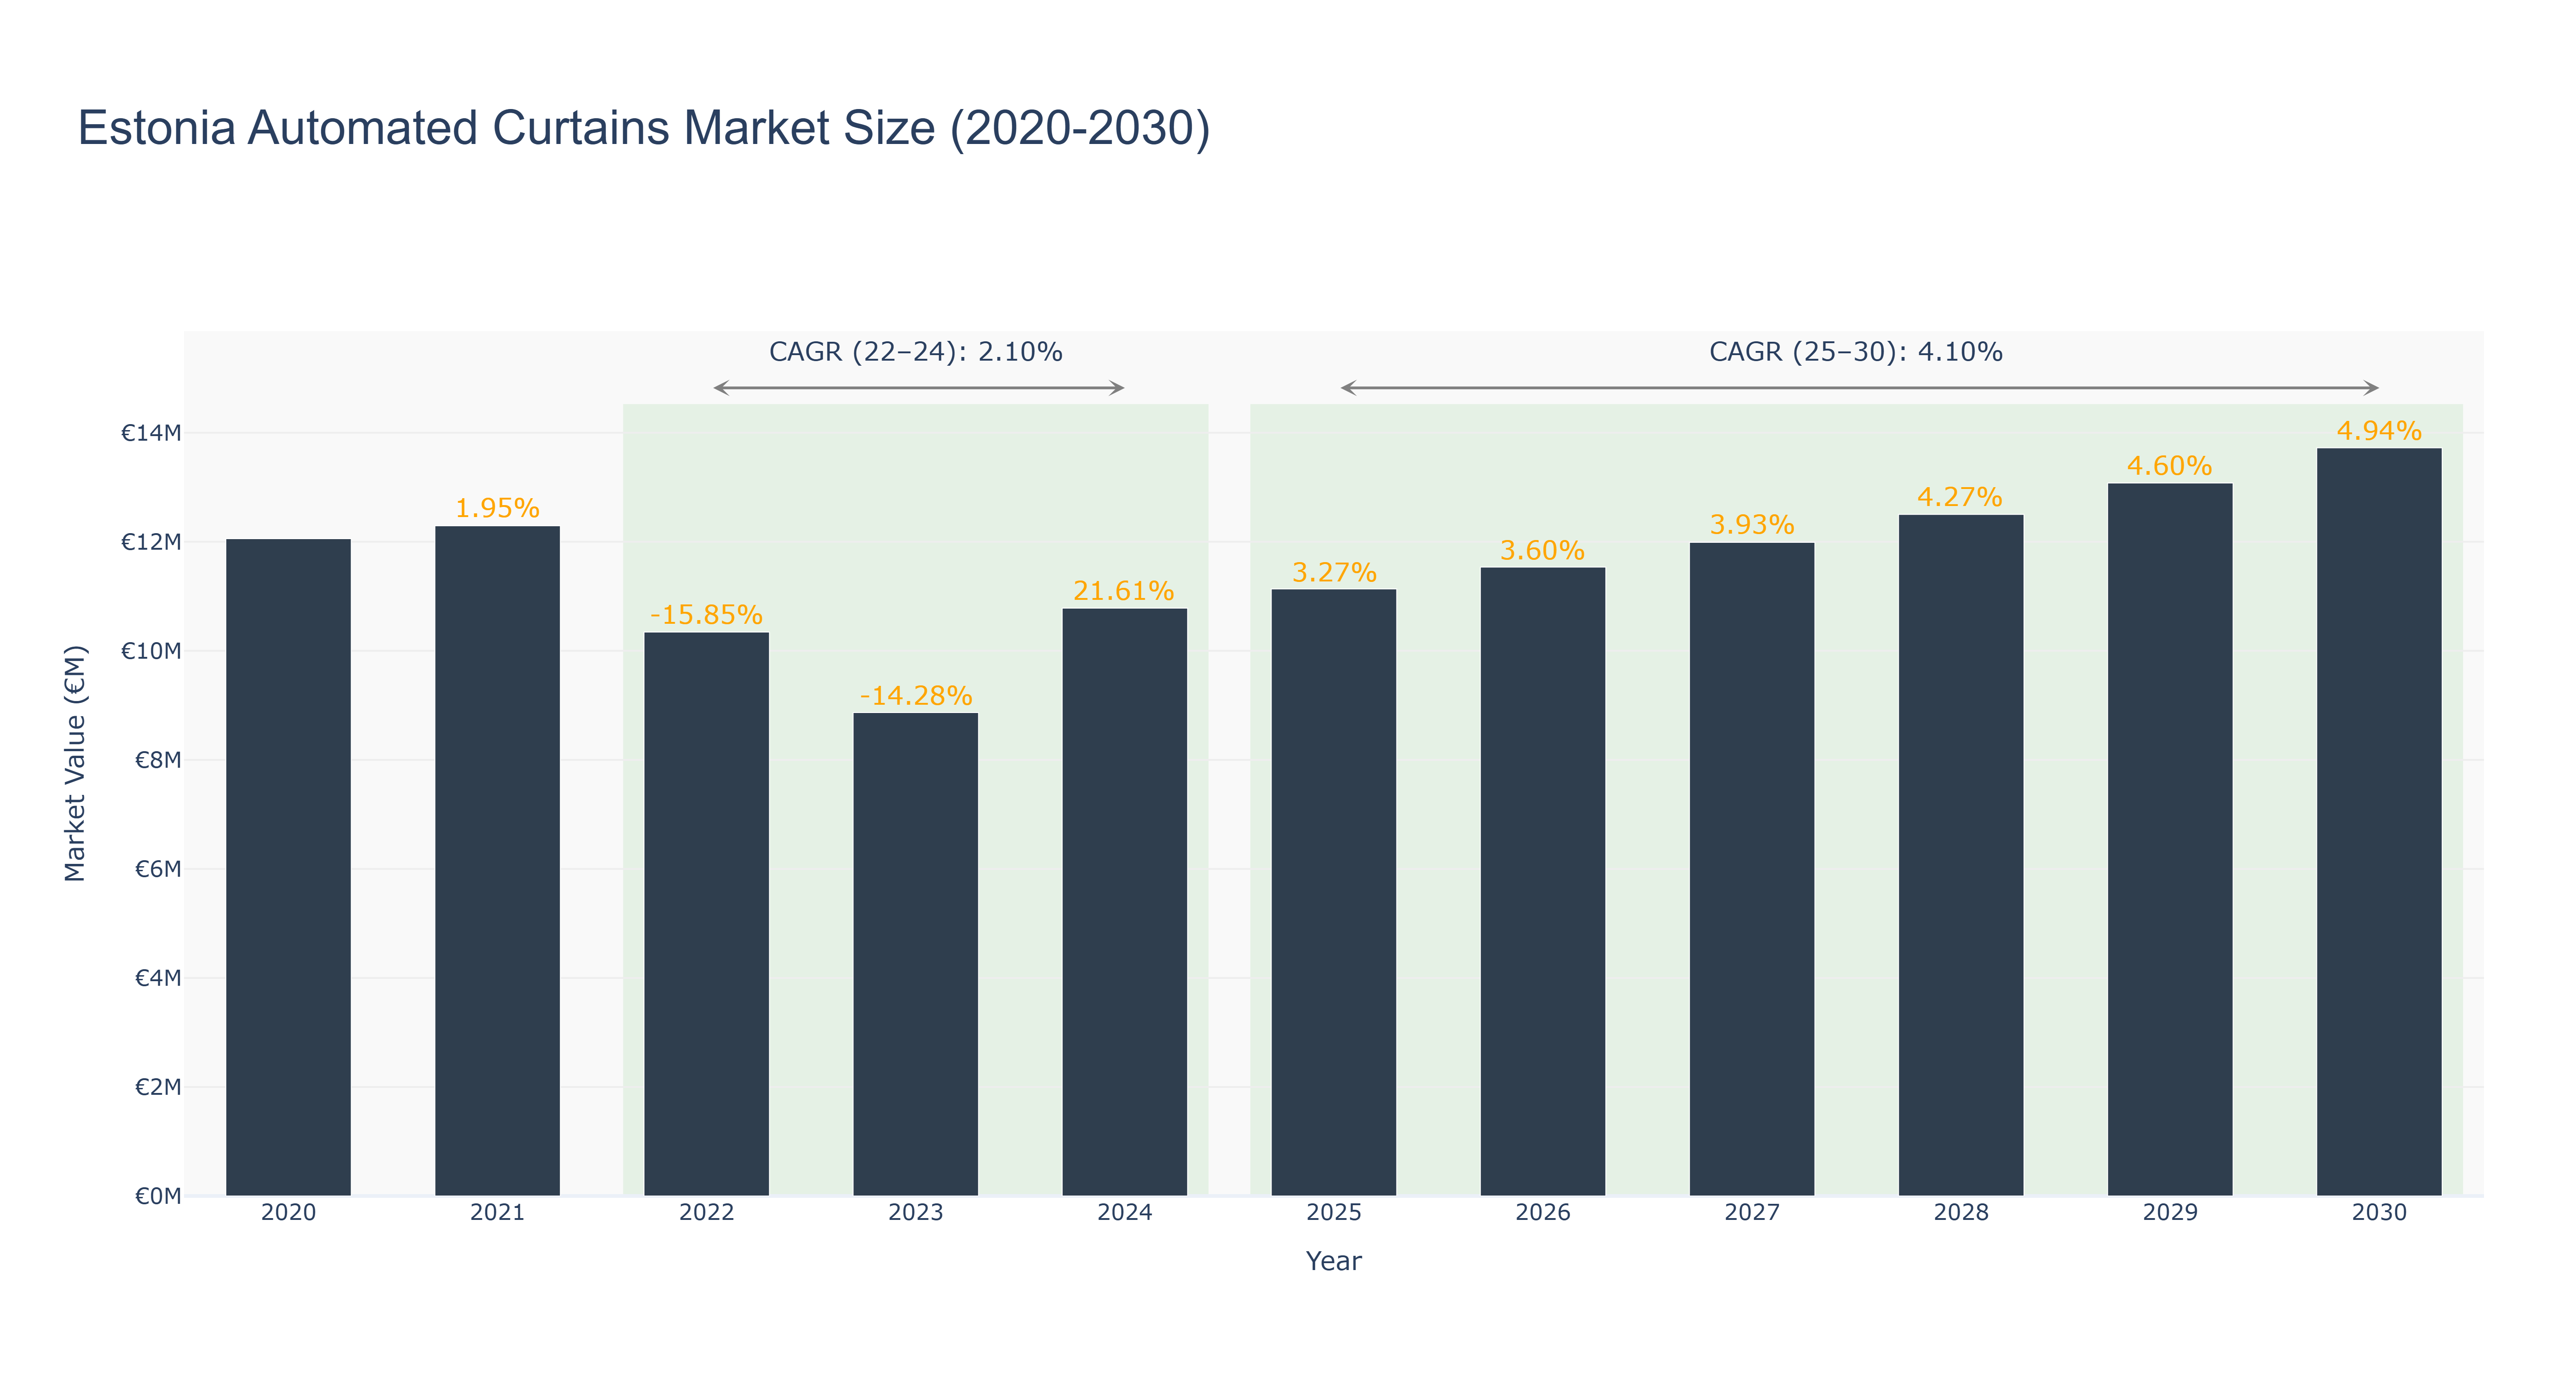
The Estonia Automated Curtains Market experienced a decline in market size from €12.06 million in 2020 to €8.87 million in 2023, attributed to economic uncertainties and reduced consumer spending. However, the market rebounded significantly in 2024, reaching a peak size of €10.78 million, driven by technological advancements and increased demand for smart home solutions. The forecasted market size is expected to continue growing steadily from €11.14 million in 2025 to €13.72 million in 2030, with a CAGR of 4.100231985% from 2025-30. The market's growth can be attributed to the rising adoption of home automation systems and the increasing focus on energy efficiency in residential buildings. Recent developments in Estonia's construction sector, such as the implementation of sustainable building practices, are expected to further drive the demand for automated curtains in the near future.
Estonia Automated Curtains Market: Production & Trade Performance (2019-2025)
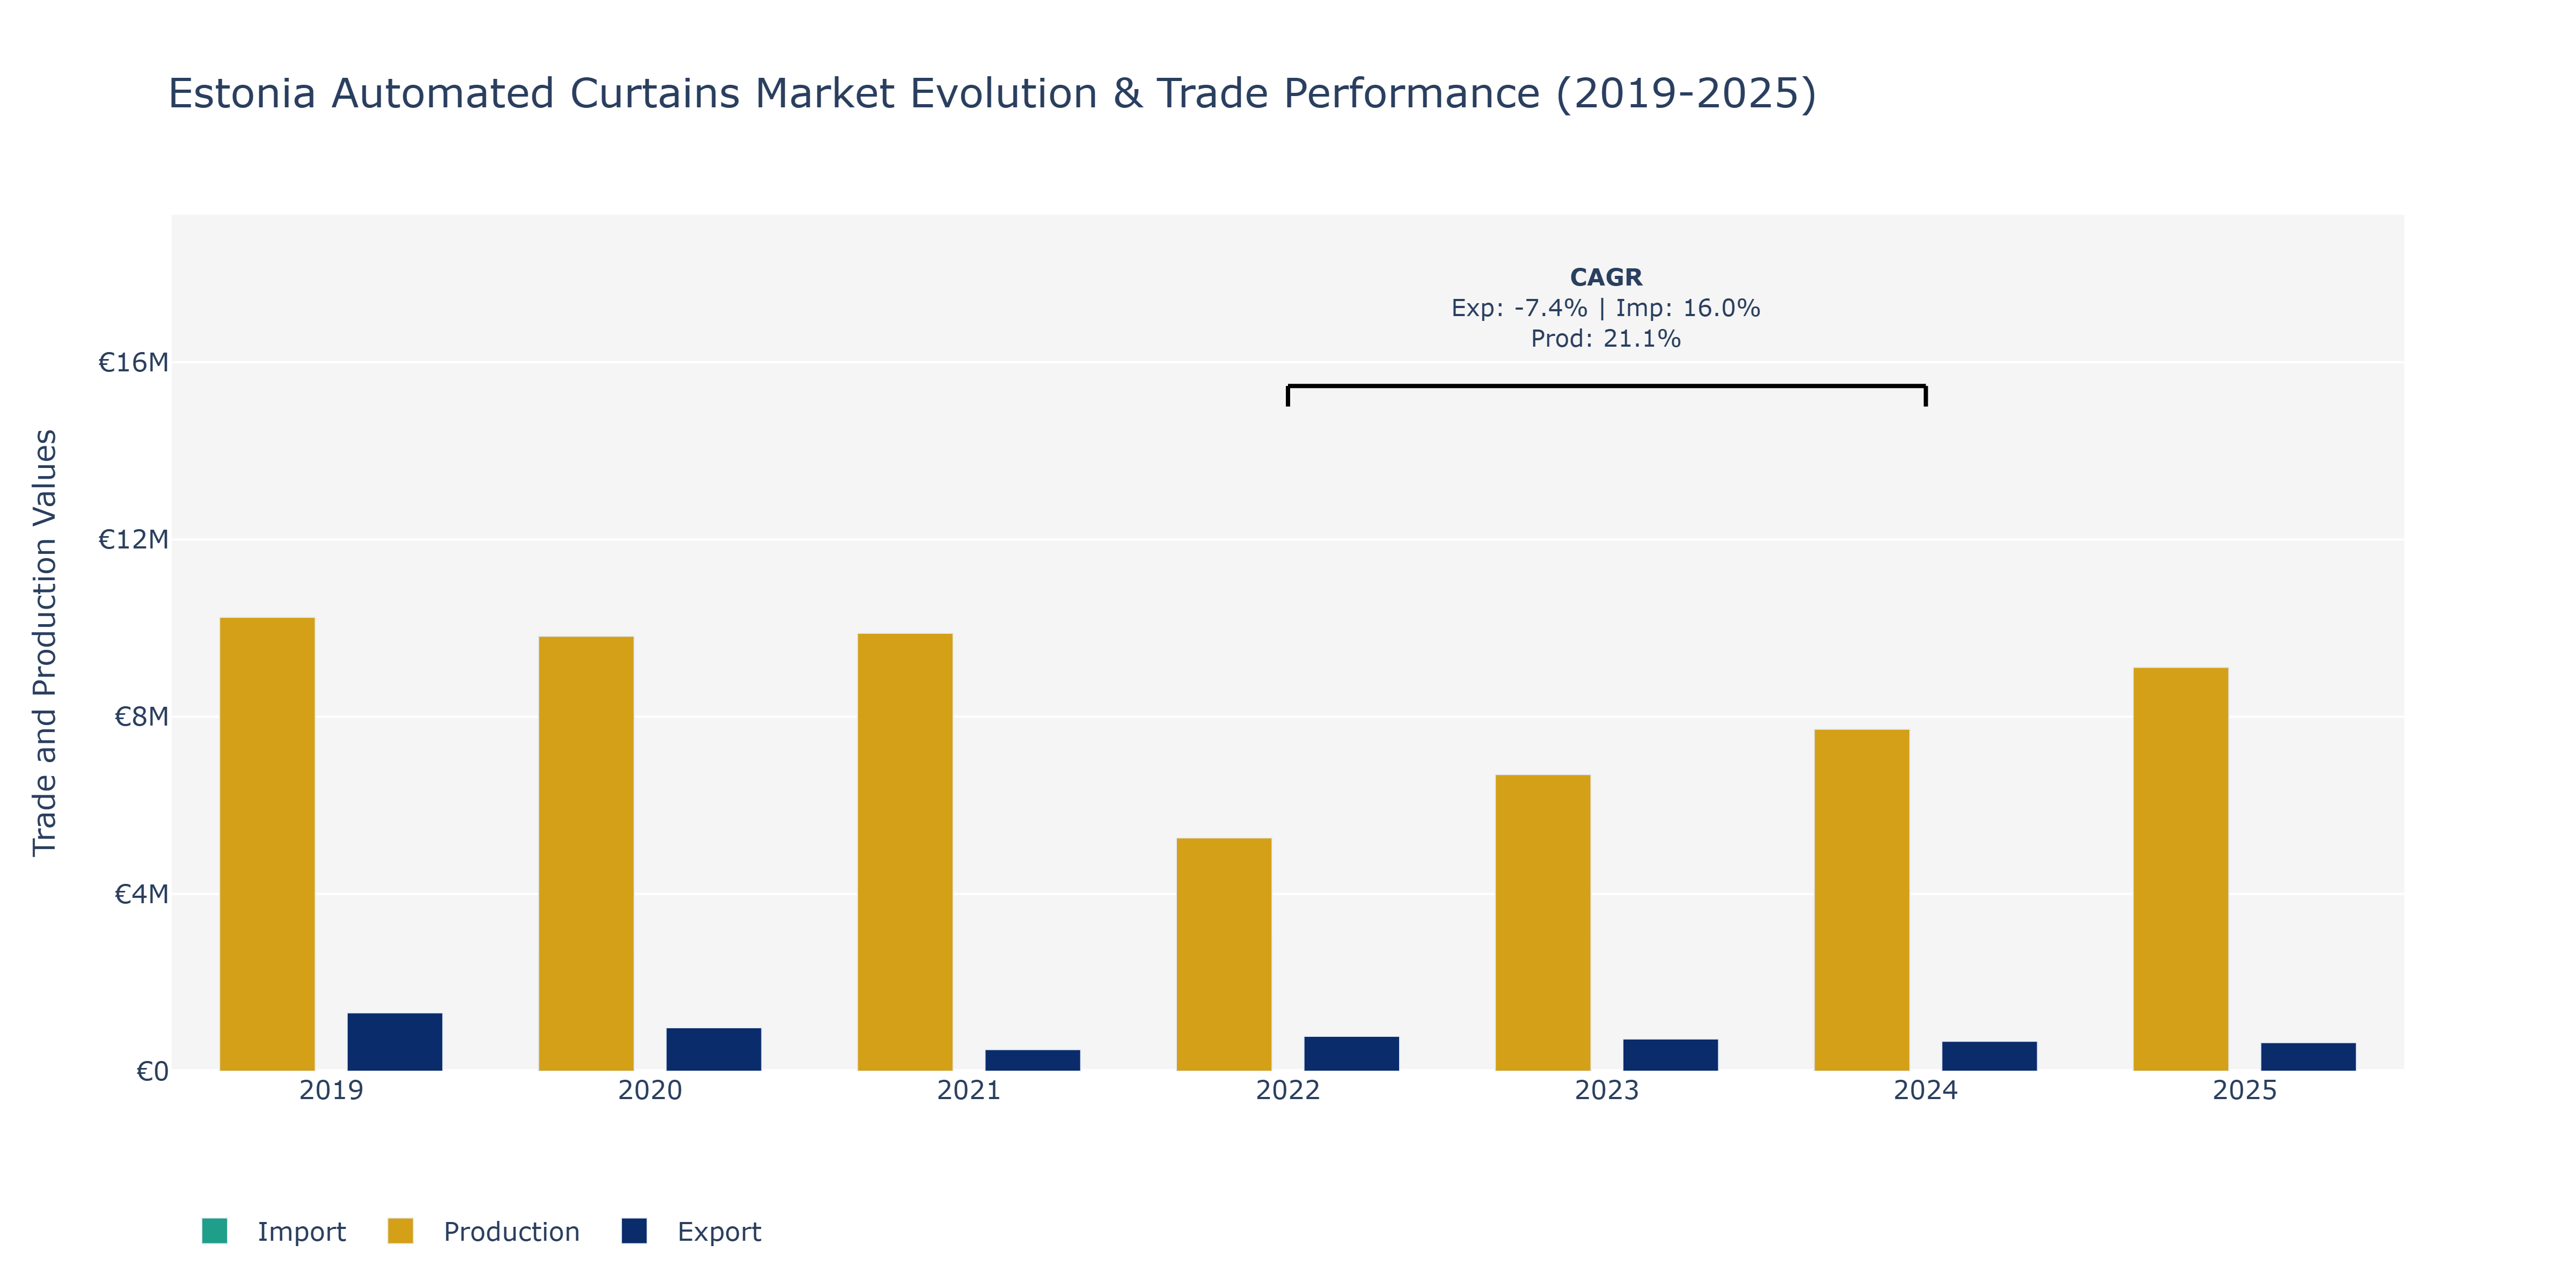
In the Estonia Automated Curtains Market, from 2019 to 2025, there were notable fluctuations in the key metrics of Exports, Imports, and Production. Exports experienced a consistent decline from €1.32 million in 2019 to around €0.65 million in 2025. Conversely, Imports showcased an upward trend, increasing from €2.62 million in 2019 to approximately €4.69 million in 2025. Production, on the other hand, initially stood at €10.24 million in 2019, decreased to €5.27 million in 2022, and then steadily rose to €9.11 million in 2025. These movements can be attributed to various factors such as changes in consumer demand, technological advancements, and global economic conditions. The decline in Exports may be linked to shifting trade policies or increased competition, while the rise in Imports could be driven by growing demand for automated curtain products in Estonia. The fluctuations in Production might reflect adjustments in manufacturing capacities or investments in innovation to meet market demands. To sustain growth, companies in the automated curtains market could focus on enhancing product quality, expanding distribution channels, and leveraging digital marketing strategies to reach a wider customer base.
Key Highlights of the Report:
- Estonia Automated Curtains Market Outlook
- Market Size of Estonia Automated Curtains Market, 2025
- Forecast of Estonia Automated Curtains Market, 2032
- Historical Data and Forecast of Estonia Automated Curtains Revenues & Volume for the Period 2022 - 2032
- Estonia Automated Curtains Market Trend Evolution
- Estonia Automated Curtains Market Drivers and Challenges
- Estonia Automated Curtains Price Trends
- Estonia Automated Curtains Porter's Five Forces
- Estonia Automated Curtains Industry Life Cycle
- Historical Data and Forecast of Estonia Automated Curtains Market Revenues & Volume By Product for the Period 2022 - 2032
- Historical Data and Forecast of Estonia Automated Curtains Market Revenues & Volume By Ripplefold for the Period 2022 - 2032
- Historical Data and Forecast of Estonia Automated Curtains Market Revenues & Volume By Pinch Pleat for the Period 2022 - 2032
- Historical Data and Forecast of Estonia Automated Curtains Market Revenues & Volume By Application for the Period 2022 - 2032
- Historical Data and Forecast of Estonia Automated Curtains Market Revenues & Volume By Residential for the Period 2022 - 2032
- Historical Data and Forecast of Estonia Automated Curtains Market Revenues & Volume By Commercial for the Period 2022 - 2032
- Estonia Automated Curtains Import Export Trade Statistics
- Market Opportunity Assessment By Product
- Market Opportunity Assessment By Application
- Estonia Automated Curtains Top Companies Market Share
- Estonia Automated Curtains Competitive Benchmarking By Technical and Operational Parameters
- Estonia Automated Curtains Company Profiles
- Estonia Automated Curtains Key Strategic Recommendations
Frequently Asked Questions About the Market Study (FAQs):
6Wresearch actively monitors the Estonia Automated Curtains Market and publishes its comprehensive annual report, highlighting emerging trends, growth drivers, revenue analysis, and forecast outlook. Our insights help businesses to make data-backed strategic decisions with ongoing market dynamics. Our analysts track relevent industries related to the Estonia Automated Curtains Market, allowing our clients with actionable intelligence and reliable forecasts tailored to emerging regional needs.
Yes, we provide customisation as per your requirements. To learn more, feel free to contact us on sales@6wresearch.com
1 Executive Summary |
2 Introduction |
2.1 Key Highlights of the Report |
2.2 Report Description |
2.3 Market Scope & Segmentation |
2.4 Research Methodology |
2.5 Assumptions |
3 Estonia Automated Curtains Market Overview |
3.1 Estonia Country Macro Economic Indicators |
3.2 Estonia Automated Curtains Market Revenues & Volume, 2022 & 2032F |
3.3 Estonia Automated Curtains Market - Industry Life Cycle |
3.4 Estonia Automated Curtains Market - Porter's Five Forces |
3.5 Estonia Automated Curtains Market Revenues & Volume Share, By Product, 2022 & 2032F |
3.6 Estonia Automated Curtains Market Revenues & Volume Share, By Application, 2022 & 2032F |
4 Estonia Automated Curtains Market Dynamics |
4.1 Impact Analysis |
4.2 Market Drivers |
4.2.1 Increasing adoption of smart home technology in Estonia |
4.2.2 Growing awareness about energy efficiency and convenience offered by automated curtains |
4.2.3 Rising disposable income levels in Estonia |
4.3 Market Restraints |
4.3.1 High initial cost of automated curtains installation |
4.3.2 Limited availability of skilled professionals for installation and maintenance |
5 Estonia Automated Curtains Market Trends |
6 Estonia Automated Curtains Market, By Types |
6.1 Estonia Automated Curtains Market, By Product |
6.1.1 Overview and Analysis |
6.1.2 Estonia Automated Curtains Market Revenues & Volume, By Product, 2022 - 2032F |
6.1.3 Estonia Automated Curtains Market Revenues & Volume, By Ripplefold, 2022 - 2032F |
6.1.4 Estonia Automated Curtains Market Revenues & Volume, By Pinch Pleat, 2022 - 2032F |
6.2 Estonia Automated Curtains Market, By Application |
6.2.1 Overview and Analysis |
6.2.2 Estonia Automated Curtains Market Revenues & Volume, By Residential, 2022 - 2032F |
6.2.3 Estonia Automated Curtains Market Revenues & Volume, By Commercial, 2022 - 2032F |
7 Estonia Automated Curtains Market Import-Export Trade Statistics |
7.1 Estonia Automated Curtains Market Export to Major Countries |
7.2 Estonia Automated Curtains Market Imports from Major Countries |
8 Estonia Automated Curtains Market Key Performance Indicators |
8.1 Number of new smart homes being built in Estonia |
8.2 Percentage increase in energy efficiency awareness campaigns |
8.3 Growth in the number of retailers offering automated curtains installation services |
8.4 Adoption rate of smart home technology in urban areas |
8.5 Number of government initiatives promoting energy-efficient solutions in households |
9 Estonia Automated Curtains Market - Opportunity Assessment |
9.1 Estonia Automated Curtains Market Opportunity Assessment, By Product, 2022 & 2032F |
9.2 Estonia Automated Curtains Market Opportunity Assessment, By Application, 2022 & 2032F |
10 Estonia Automated Curtains Market - Competitive Landscape |
10.1 Estonia Automated Curtains Market Revenue Share, By Companies, 2025 |
10.2 Estonia Automated Curtains Market Competitive Benchmarking, By Operating and Technical Parameters |
11 Company Profiles |
12 Recommendations |
13 Disclaimer |
Global Go To Market Strategy - 2030
Export potential enables firms to identify high-growth global markets with greater confidence by combining advanced trade intelligence with a structured quantitative methodology. The framework analyzes emerging demand trends and country-level import patterns while integrating macroeconomic and trade datasets such as GDP and population forecasts, bilateral import–export flows, tariff structures, elasticity differentials between developed and developing economies, geographic distance, and import demand projections. Using weighted trade values from 2020–2024 as the base period to project country-to-country export potential for 2030, these inputs are operationalized through calculated drivers such as gravity model parameters, tariff impact factors, and projected GDP per-capita growth. Through an analysis of hidden potentials, demand hotspots, and market conditions that are most favorable to success, this method enables firms to focus on target countries, maximize returns, and global expansion with data, backed by accuracy.
By factoring in the projected importer demand gap that is currently unmet and could be potential opportunity, it identifies the potential for the Exporter (Country) among 190 countries, against the general trade analysis, which identifies the biggest importer or exporter.
To discover high-growth global markets and optimize your business strategy:
Click Here
Pricing
- Single User License$ 1,995
- Department License$ 2,400
- Site License$ 3,120
- Global License$ 3,795

Leadership Perspectives from Industry Events
Search
Thought Leadership and Analyst Meet


Our Clients
6WResearch In News
- India Export Attractiveness Tracker 2026
- India Air Conditioner Market Set for Strong Rebound in 2026 After Weather-Led Correction and GST-Driven Recovery: 6Wresearch
- ADAS in India: How Automatic Emergency Braking, Blind Spot Detection & Driver Monitoring are Transforming Road Safety
- Doha a strategic location for EV manufacturing hub: IPA Qatar
- Demand for luxury TVs surging in the GCC, says Samsung
- Empowering Growth: The Thriving Journey of Bangladesh’s Cable Industry
Latest Reports
- Nicaragua RPG Gaming Market (2026-2032)
- New Zealand RPG Gaming Market (2026-2032)
- Netherlands RPG Gaming Market (2026-2032)
- Nauru RPG Gaming Market (2026-2032)
- Namibia RPG Gaming Market (2026-2032)
- Mozambique RPG Gaming Market (2026-2032)
- Montenegro RPG Gaming Market (2026-2032)
- Mongolia RPG Gaming Market (2026-2032)
- Monaco RPG Gaming Market (2026-2032)
- Micronesia RPG Gaming Market (2026-2032)
Industry Events and Analyst Meet

EV India Expo 2026

HIMTEX 2026

India Refining Summit 2026

India EV Show 2026

EV tech India Expo 2026
Whitepaper
- Middle East & Africa Commercial Security Market Click here to view more.
- Middle East & Africa Fire Safety Systems & Equipment Market Click here to view more.
- GCC Drone Market Click here to view more.
- Middle East Lighting Fixture Market Click here to view more.
- GCC Physical & Perimeter Security Market Click here to view more.