Estonia Automated Fluid Dispensing Systems Market (2026-2032) | Segmentation, Revenue, Outlook, Consumer Insights, Competition, Value, Pricing Analysis, Trends, Supply, Size, Industry, Competitive, Growth, Strategic Insights, Investment Trends, Strategy, Companies, Analysis, Segments, Drivers, Restraints, Forecast, Demand, Challenges, Share, Opportunities
Market Forecast By Product Type (Fluid Dispensers, Automated Liquid Systems, Syringe Pumps), By Application (Medical Devices, Healthcare, Biotech), By End User (Drug Delivery, Lab Testing, Medical Research), By Functionality (Precision Dispensing, Liquid Handling, Automated Fluid Control) And Competitive Landscape
| Product Code: ETC10325727 | Publication Date: Apr 2025 | Updated Date: Apr 2026 | Product Type: Market Research Report | |
| Publisher: 6Wresearch | Author: Bhawna Singh | No. of Pages: 65 | No. of Figures: 34 | No. of Tables: 19 |
Estonia Automated Fluid Dispensing Systems Market Size (2020-2030)
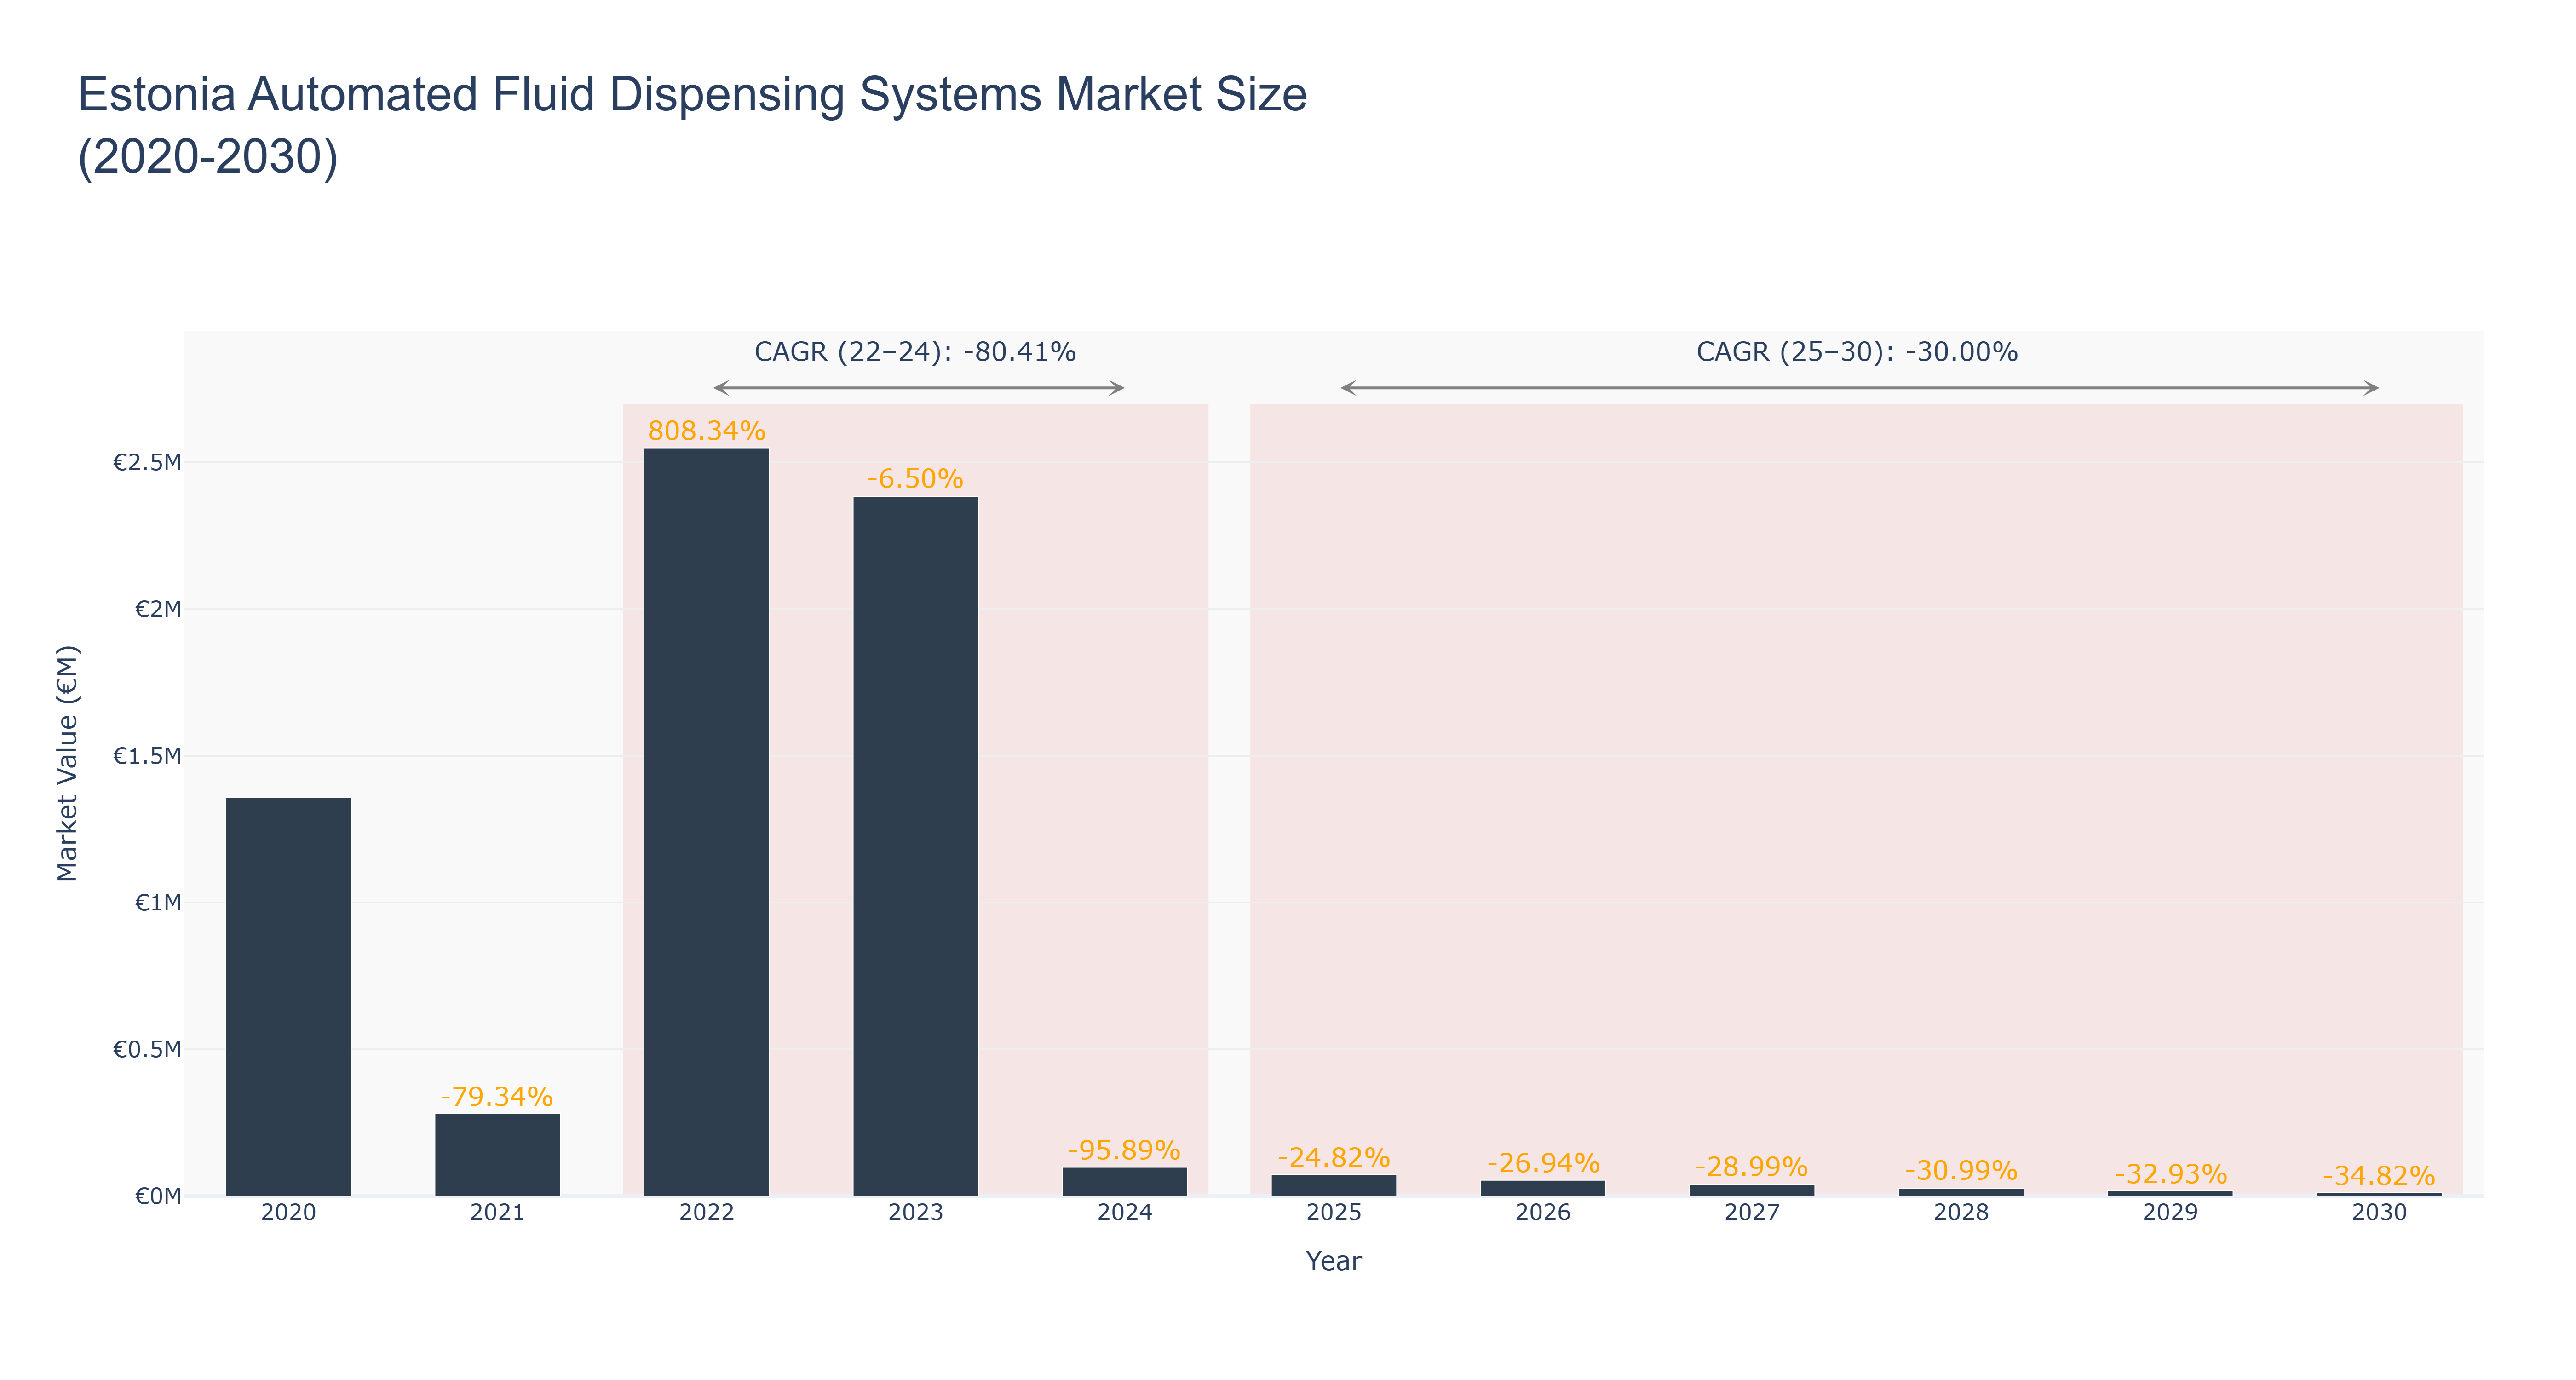
The Estonia Automated Fluid Dispensing Systems Market experienced a peak market size of €2.55 million in 2022, followed by a significant decline to €0.10 million in 2024. The market is forecasted to continue shrinking, reaching €0.01 million by 2030, with a CAGR of -30.0% from 2025 to 2030. The market's downfall can be attributed to factors such as technological advancements leading to more efficient systems, saturation in the market, and economic challenges impacting investment in automation technologies. However, recent developments in sustainable fluid dispensing systems and collaborations with key industry players are expected to drive growth in the near future. As Estonia focuses on enhancing its manufacturing capabilities, the market may see opportunities for innovation and expansion in the coming years.
Estonia Automated Fluid Dispensing Systems Market: Production & Trade Performance (2019-2025)
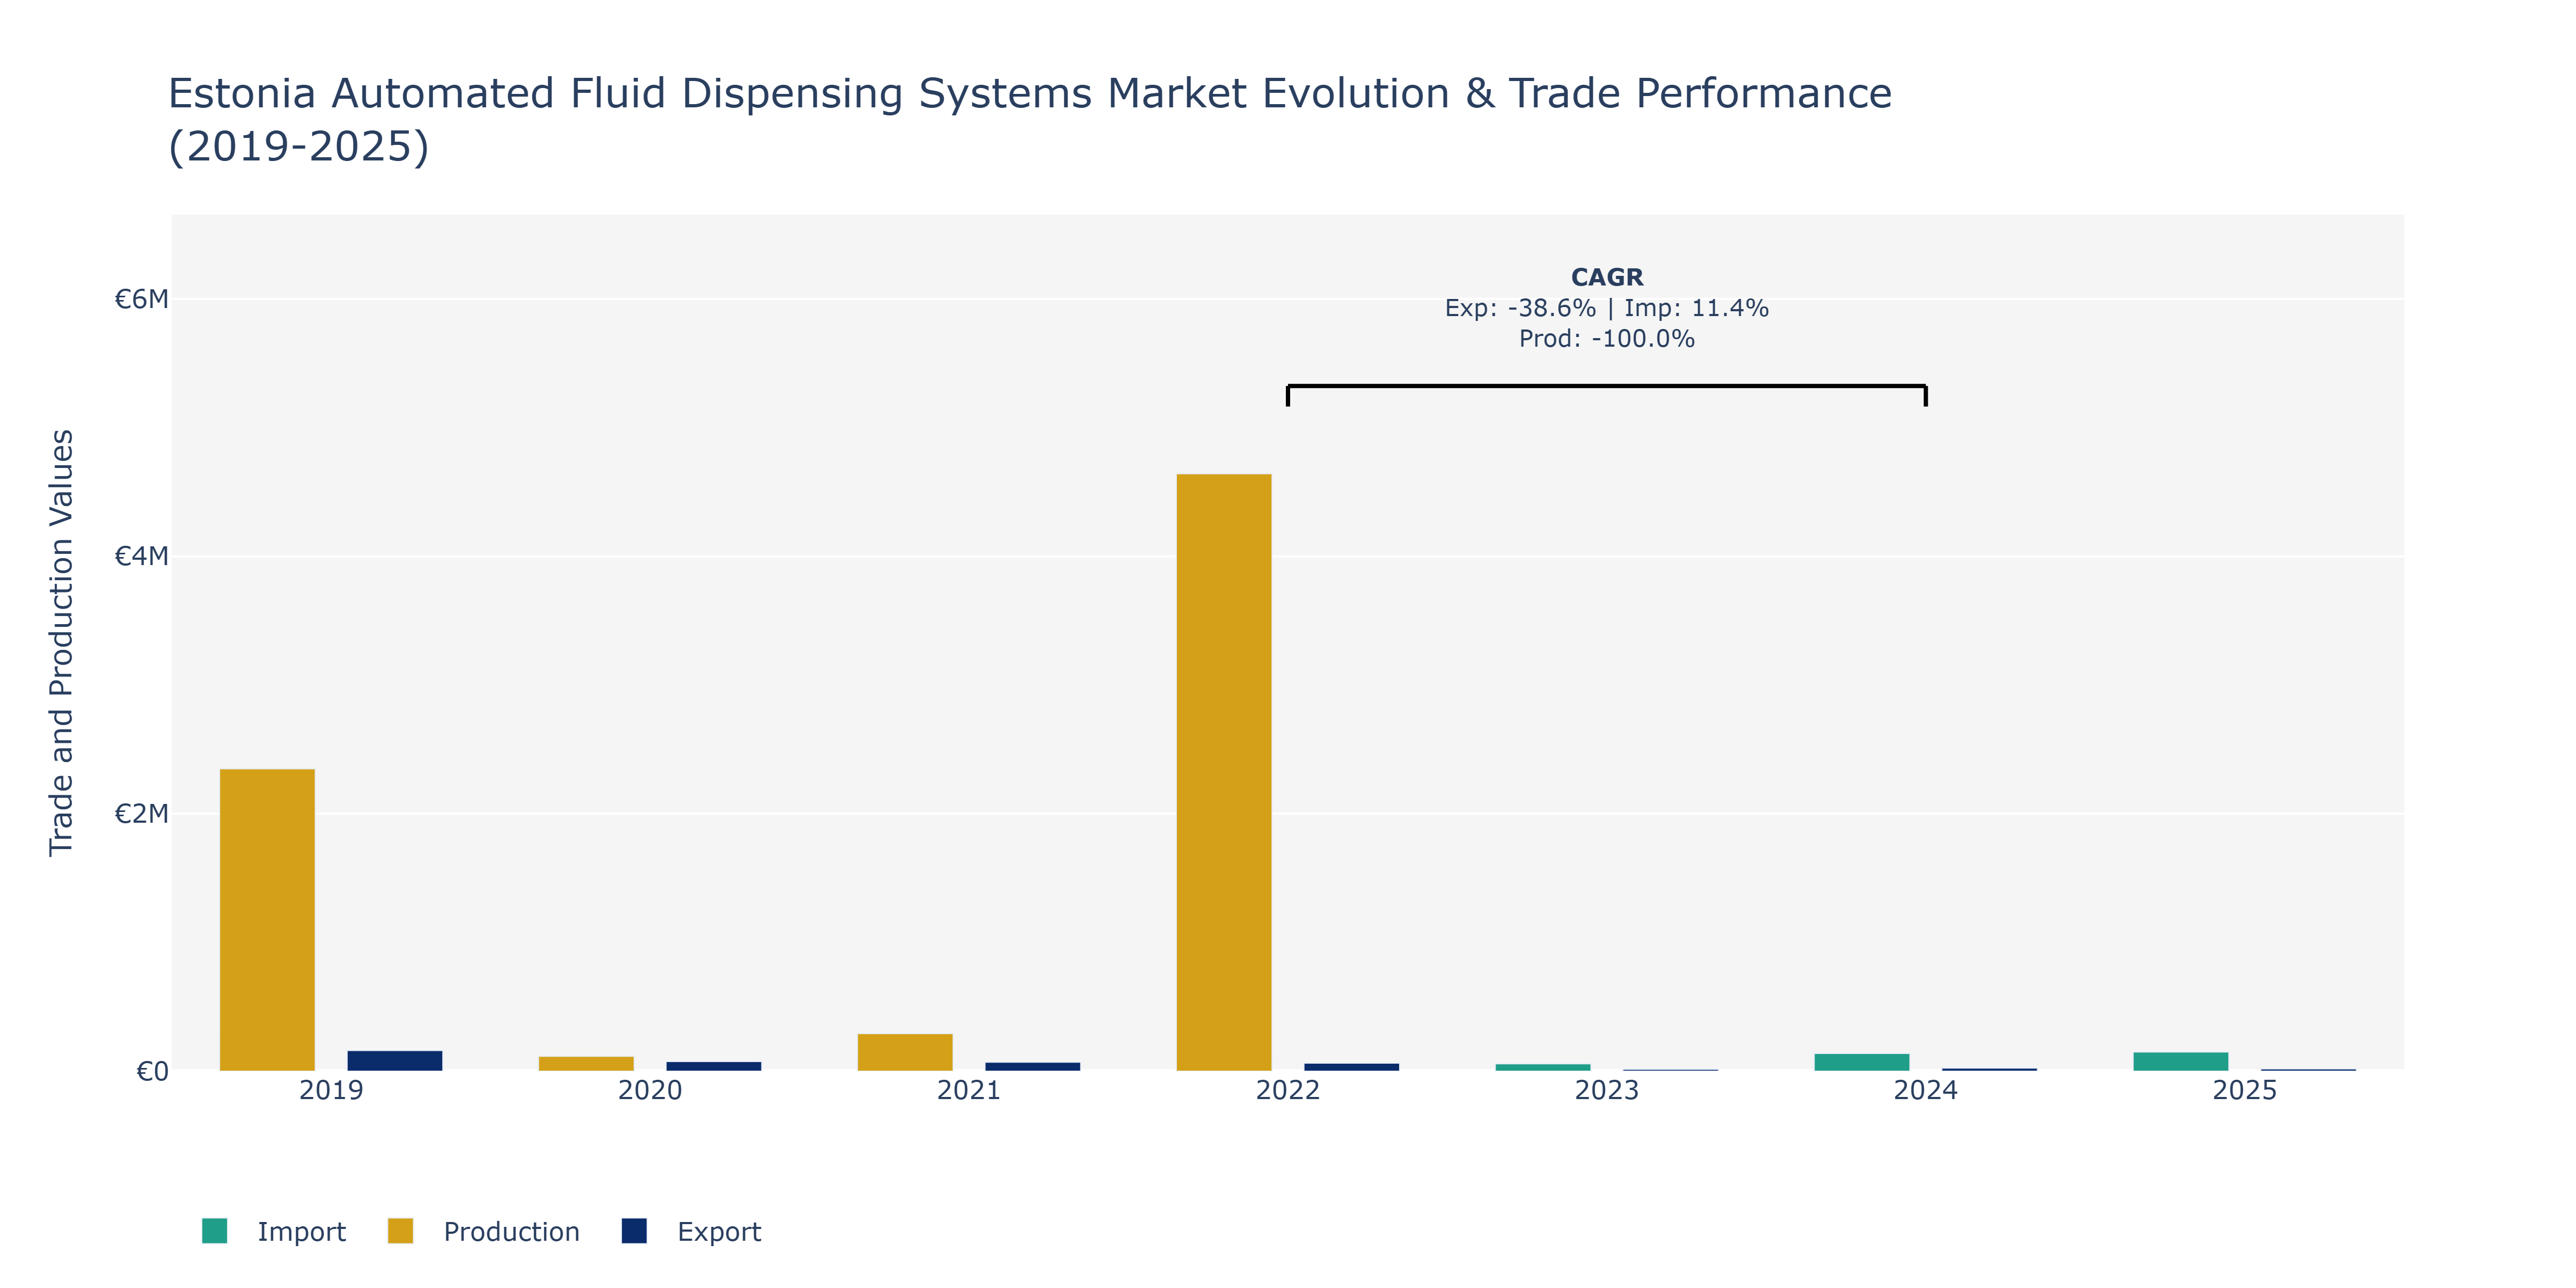
In the Estonia Automated Fluid Dispensing Systems Market, exports experienced a notable decline from €160.36 thousand in 2019 to €17.69 thousand in 2025. This downward trend could be attributed to economic factors impacting demand for automated fluid dispensing systems globally, potentially leading to a decrease in production volumes and subsequent export activities. Conversely, imports showed fluctuating patterns, with a peak of €293.04 thousand in 2019, followed by a gradual decrease to €149.2 thousand in 2025. This fluctuation may indicate shifting preferences among Estonian businesses for sourcing such systems from different markets or a response to changes in domestic production capabilities. Production levels exhibited a substantial increase from €2349.42 thousand in 2019 to €4642.00 thousand in 2022, possibly driven by advancements in technology, automation, and the growing demand for efficient fluid dispensing solutions in various industries. These trends align with the broader automation and technology adoption trends in manufacturing industries, where efficiency and precision are key drivers for market growth.
Key Highlights of the Report:
- Estonia Automated Fluid Dispensing Systems Market Outlook
- Market Size of Estonia Automated Fluid Dispensing Systems Market, 2025
- Forecast of Estonia Automated Fluid Dispensing Systems Market, 2032
- Historical Data and Forecast of Estonia Automated Fluid Dispensing Systems Revenues & Volume for the Period 2022 - 2032F
- Estonia Automated Fluid Dispensing Systems Market Trend Evolution
- Estonia Automated Fluid Dispensing Systems Market Drivers and Challenges
- Estonia Automated Fluid Dispensing Systems Price Trends
- Estonia Automated Fluid Dispensing Systems Porter's Five Forces
- Estonia Automated Fluid Dispensing Systems Industry Life Cycle
- Historical Data and Forecast of Estonia Automated Fluid Dispensing Systems Market Revenues & Volume By Product Type for the Period 2022 - 2032F
- Historical Data and Forecast of Estonia Automated Fluid Dispensing Systems Market Revenues & Volume By Fluid Dispensers for the Period 2022 - 2032F
- Historical Data and Forecast of Estonia Automated Fluid Dispensing Systems Market Revenues & Volume By Automated Liquid Systems for the Period 2022 - 2032F
- Historical Data and Forecast of Estonia Automated Fluid Dispensing Systems Market Revenues & Volume By Syringe Pumps for the Period 2022 - 2032F
- Historical Data and Forecast of Estonia Automated Fluid Dispensing Systems Market Revenues & Volume By Application for the Period 2022 - 2032F
- Historical Data and Forecast of Estonia Automated Fluid Dispensing Systems Market Revenues & Volume By Medical Devices for the Period 2022 - 2032F
- Historical Data and Forecast of Estonia Automated Fluid Dispensing Systems Market Revenues & Volume By Healthcare for the Period 2022 - 2032F
- Historical Data and Forecast of Estonia Automated Fluid Dispensing Systems Market Revenues & Volume By Biotech for the Period 2022 - 2032F
- Historical Data and Forecast of Estonia Automated Fluid Dispensing Systems Market Revenues & Volume By End User for the Period 2022 - 2032F
- Historical Data and Forecast of Estonia Automated Fluid Dispensing Systems Market Revenues & Volume By Drug Delivery for the Period 2022 - 2032F
- Historical Data and Forecast of Estonia Automated Fluid Dispensing Systems Market Revenues & Volume By Lab Testing for the Period 2022 - 2032F
- Historical Data and Forecast of Estonia Automated Fluid Dispensing Systems Market Revenues & Volume By Medical Research for the Period 2022 - 2032F
- Historical Data and Forecast of Estonia Automated Fluid Dispensing Systems Market Revenues & Volume By Functionality for the Period 2022 - 2032F
- Historical Data and Forecast of Estonia Automated Fluid Dispensing Systems Market Revenues & Volume By Precision Dispensing for the Period 2022 - 2032F
- Historical Data and Forecast of Estonia Automated Fluid Dispensing Systems Market Revenues & Volume By Liquid Handling for the Period 2022 - 2032F
- Historical Data and Forecast of Estonia Automated Fluid Dispensing Systems Market Revenues & Volume By Automated Fluid Control for the Period 2022 - 2032F
- Estonia Automated Fluid Dispensing Systems Import Export Trade Statistics
- Market Opportunity Assessment By Product Type
- Market Opportunity Assessment By Application
- Market Opportunity Assessment By End User
- Market Opportunity Assessment By Functionality
- Estonia Automated Fluid Dispensing Systems Top Companies Market Share
- Estonia Automated Fluid Dispensing Systems Competitive Benchmarking By Technical and Operational Parameters
- Estonia Automated Fluid Dispensing Systems Company Profiles
- Estonia Automated Fluid Dispensing Systems Key Strategic Recommendations
Frequently Asked Questions About the Market Study (FAQs):
6Wresearch actively monitors the Estonia Automated Fluid Dispensing Systems Market and publishes its comprehensive annual report, highlighting emerging trends, growth drivers, revenue analysis, and forecast outlook. Our insights help businesses to make data-backed strategic decisions with ongoing market dynamics. Our analysts track relevent industries related to the Estonia Automated Fluid Dispensing Systems Market, allowing our clients with actionable intelligence and reliable forecasts tailored to emerging regional needs.
Yes, we provide customisation as per your requirements. To learn more, feel free to contact us on sales@6wresearch.com
1 Executive Summary |
2 Introduction |
2.1 Key Highlights of the Report |
2.2 Report Description |
2.3 Market Scope & Segmentation |
2.4 Research Methodology |
2.5 Assumptions |
3 Estonia Automated Fluid Dispensing Systems Market Overview |
3.1 Estonia Country Macro Economic Indicators |
3.2 Estonia Automated Fluid Dispensing Systems Market Revenues & Volume, 2022 & 2032F |
3.3 Estonia Automated Fluid Dispensing Systems Market - Industry Life Cycle |
3.4 Estonia Automated Fluid Dispensing Systems Market - Porter's Five Forces |
3.5 Estonia Automated Fluid Dispensing Systems Market Revenues & Volume Share, By Product Type, 2022 & 2032F |
3.6 Estonia Automated Fluid Dispensing Systems Market Revenues & Volume Share, By Application, 2022 & 2032F |
3.7 Estonia Automated Fluid Dispensing Systems Market Revenues & Volume Share, By End User, 2022 & 2032F |
3.8 Estonia Automated Fluid Dispensing Systems Market Revenues & Volume Share, By Functionality, 2022 & 2032F |
4 Estonia Automated Fluid Dispensing Systems Market Dynamics |
4.1 Impact Analysis |
4.2 Market Drivers |
4.2.1 Technological advancements in automated fluid dispensing systems |
4.2.2 Increasing demand for precision and accuracy in dispensing fluids |
4.2.3 Growing adoption of automation in manufacturing processes |
4.3 Market Restraints |
4.3.1 High initial investment costs for automated fluid dispensing systems |
4.3.2 Limited awareness and understanding of the benefits of automated fluid dispensing systems |
4.3.3 Concerns regarding the complexity of implementation and maintenance of these systems |
5 Estonia Automated Fluid Dispensing Systems Market Trends |
6 Estonia Automated Fluid Dispensing Systems Market, By Types |
6.1 Estonia Automated Fluid Dispensing Systems Market, By Product Type |
6.1.1 Overview and Analysis |
6.1.2 Estonia Automated Fluid Dispensing Systems Market Revenues & Volume, By Product Type, 2022 - 2032F |
6.1.3 Estonia Automated Fluid Dispensing Systems Market Revenues & Volume, By Fluid Dispensers, 2022 - 2032F |
6.1.4 Estonia Automated Fluid Dispensing Systems Market Revenues & Volume, By Automated Liquid Systems, 2022 - 2032F |
6.1.5 Estonia Automated Fluid Dispensing Systems Market Revenues & Volume, By Syringe Pumps, 2022 - 2032F |
6.2 Estonia Automated Fluid Dispensing Systems Market, By Application |
6.2.1 Overview and Analysis |
6.2.2 Estonia Automated Fluid Dispensing Systems Market Revenues & Volume, By Medical Devices, 2022 - 2032F |
6.2.3 Estonia Automated Fluid Dispensing Systems Market Revenues & Volume, By Healthcare, 2022 - 2032F |
6.2.4 Estonia Automated Fluid Dispensing Systems Market Revenues & Volume, By Biotech, 2022 - 2032F |
6.3 Estonia Automated Fluid Dispensing Systems Market, By End User |
6.3.1 Overview and Analysis |
6.3.2 Estonia Automated Fluid Dispensing Systems Market Revenues & Volume, By Drug Delivery, 2022 - 2032F |
6.3.3 Estonia Automated Fluid Dispensing Systems Market Revenues & Volume, By Lab Testing, 2022 - 2032F |
6.3.4 Estonia Automated Fluid Dispensing Systems Market Revenues & Volume, By Medical Research, 2022 - 2032F |
6.4 Estonia Automated Fluid Dispensing Systems Market, By Functionality |
6.4.1 Overview and Analysis |
6.4.2 Estonia Automated Fluid Dispensing Systems Market Revenues & Volume, By Precision Dispensing, 2022 - 2032F |
6.4.3 Estonia Automated Fluid Dispensing Systems Market Revenues & Volume, By Liquid Handling, 2022 - 2032F |
6.4.4 Estonia Automated Fluid Dispensing Systems Market Revenues & Volume, By Automated Fluid Control, 2022 - 2032F |
7 Estonia Automated Fluid Dispensing Systems Market Import-Export Trade Statistics |
7.1 Estonia Automated Fluid Dispensing Systems Market Export to Major Countries |
7.2 Estonia Automated Fluid Dispensing Systems Market Imports from Major Countries |
8 Estonia Automated Fluid Dispensing Systems Market Key Performance Indicators |
8.1 Percentage increase in the adoption rate of automated fluid dispensing systems in manufacturing industries in Estonia |
8.2 Reduction in dispensing errors and wastage rates after the implementation of automated systems |
8.3 Improvement in production efficiency and throughput due to the use of automated fluid dispensing systems |
9 Estonia Automated Fluid Dispensing Systems Market - Opportunity Assessment |
9.1 Estonia Automated Fluid Dispensing Systems Market Opportunity Assessment, By Product Type, 2022 & 2032F |
9.2 Estonia Automated Fluid Dispensing Systems Market Opportunity Assessment, By Application, 2022 & 2032F |
9.3 Estonia Automated Fluid Dispensing Systems Market Opportunity Assessment, By End User, 2022 & 2032F |
9.4 Estonia Automated Fluid Dispensing Systems Market Opportunity Assessment, By Functionality, 2022 & 2032F |
10 Estonia Automated Fluid Dispensing Systems Market - Competitive Landscape |
10.1 Estonia Automated Fluid Dispensing Systems Market Revenue Share, By Companies, 2025 |
10.2 Estonia Automated Fluid Dispensing Systems Market Competitive Benchmarking, By Operating and Technical Parameters |
11 Company Profiles |
12 Recommendations |
13 Disclaimer |
Export potential assessment - trade Analytics for 2030
Export potential enables firms to identify high-growth global markets with greater confidence by combining advanced trade intelligence with a structured quantitative methodology. The framework analyzes emerging demand trends and country-level import patterns while integrating macroeconomic and trade datasets such as GDP and population forecasts, bilateral import–export flows, tariff structures, elasticity differentials between developed and developing economies, geographic distance, and import demand projections. Using weighted trade values from 2020–2024 as the base period to project country-to-country export potential for 2030, these inputs are operationalized through calculated drivers such as gravity model parameters, tariff impact factors, and projected GDP per-capita growth. Through an analysis of hidden potentials, demand hotspots, and market conditions that are most favorable to success, this method enables firms to focus on target countries, maximize returns, and global expansion with data, backed by accuracy.
By factoring in the projected importer demand gap that is currently unmet and could be potential opportunity, it identifies the potential for the Exporter (Country) among 190 countries, against the general trade analysis, which identifies the biggest importer or exporter.
To discover high-growth global markets and optimize your business strategy:
Click Here
Pricing
- Single User License$ 1,995
- Department License$ 2,400
- Site License$ 3,120
- Global License$ 3,795

Search
Thought Leadership and Analyst Meet


Our Clients
Latest Reports
- India Ultrasonic Smart Water Meter Market (2026-2032) | Outlook, Competition, Drivers, Trends, Demand, Competitive, Strategic Insights, Companies, Challenges, Strategy, Consumer Insights, Analysis, Opportunities, Growth, Size, Share, Industry, Revenue, Segments, Value, Segmentation, Supply, Forecast, Restraints,
- India Electromagnetic Bulk Flow Meter Market (2026-2032) | Analysis, Challenges, Strategic Insights, Supply, Forecast, Growth, Share, Consumer Insights, Competitive, Value, Outlook, Size & Demand,
- India Battery Powered Bulk Flow Meter Market (2026-2032) | Outlook, Analysis, Competitive Landscape, Growth, Size, Trends, Value, Revenue, Companies, Segmentation, Share & Forecast
- Bosnia and Herzegovina Fuel-Efficient Winglets Market (2026-2032) | Growth, Competition, Strategy, Restraints, Trends, Challenges, segmentation, Value, Outlook, Investment Opportunities, Analysis, Revenue, Companies, Insights, Pricing, Size, Drivers, Demand, Share, Forecast
- Canada Cloud CFD Market (2026-2032) | Size & Revenue, Industry, Growth, Competitive Landscape, Forecast, Segmentation, Value, Outlook, Trends, Share, Analysis, Companies
- Taiwan Food Delivery Platform Market (2026-2032) | Companies, Outlook, Analysis, Trends, Value, Revenue, Segmentation, Share, Forecast, Competitive Landscape, Growth, Size & Forecast
- United Kingdom (UK) Long-term Care Insurance Market (2026-2032) | Growth, Share, Consumer Insights, Drivers, Opportunities, Competition, Pricing Analysis, Segments, Restraints, Companies, Competitive, Value, Outlook, Size, Demand, Analysis, Challenges, Strategic Insights, Investment Trends, Revenue, Trends, Supply, Forecast
- United Kingdom (UK) Long Term Care Market (2026-2032) | Companies, Outlook, Analysis, Trends, Value, Revenue, Segmentation, Share, Forecast, Competitive Landscape, Growth, Size & Forecast
- Iraq Insulation and Waterproofing Market (2026-2032) | Outlook, Drivers, Growth, Size, Share, Industry, Revenue, Trends, Demand, Competitive, Strategic Insights, Opportunities, Segments, Companies, Challenges, Strategy, Consumer Insights, Analysis, Investment Trends, Value, Segmentation, Forecast, Restraints
- India Switchgear Market Outlook (2026-2032) | Size, Share, Trends, Growth, Revenue, Forecast, Analysis, Value, Outlook
Industry Events and Analyst Meet

HIMTEX 2026

India Refining Summit 2026

India EV Show 2026

EV tech India Expo 2026

Auto Tech Asia 2026
Whitepaper
- Middle East & Africa Commercial Security Market Click here to view more.
- Middle East & Africa Fire Safety Systems & Equipment Market Click here to view more.
- GCC Drone Market Click here to view more.
- Middle East Lighting Fixture Market Click here to view more.
- GCC Physical & Perimeter Security Market Click here to view more.
6WResearch In News
- Doha a strategic location for EV manufacturing hub: IPA Qatar
- Demand for luxury TVs surging in the GCC, says Samsung
- Empowering Growth: The Thriving Journey of Bangladesh’s Cable Industry
- Demand for luxury TVs surging in the GCC, says Samsung
- Video call with a traditional healer? Once unthinkable, it’s now common in South Africa
- Intelligent Buildings To Smooth GCC’s Path To Net Zero